Cities with the Highest Costs of Housing as Percentage of Income in New Jersey
RELATED REPORTS & OPTIONS
Highest Housing Costs / Income
New Jersey
Compare Cities
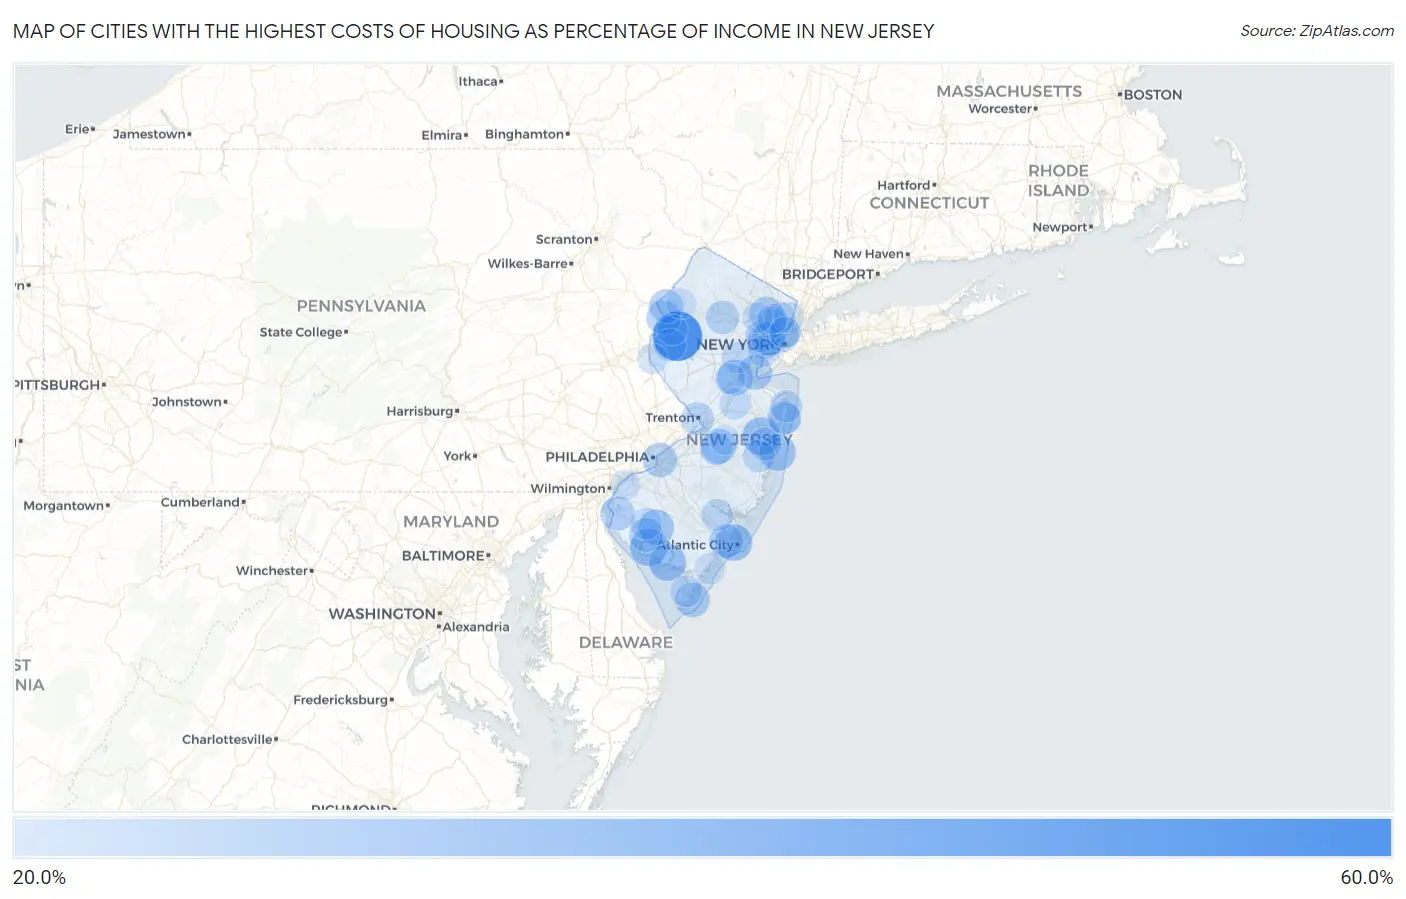
Map of Cities with the Highest Costs of Housing as Percentage of Income in New Jersey
0.0%
60.0%
Cities with the Highest Costs of Housing as Percentage of Income in New Jersey
| City | Housing Costs / Income | vs State | vs National | |
| 1. | Port Colden | 59.9% | 22.5%(+37.5)#1 | 20.4%(+39.6)#43 |
| 2. | Port Morris | 44.4% | 22.5%(+21.9)#2 | 20.4%(+24.0)#121 |
| 3. | Penns Grove Borough | 42.7% | 22.5%(+20.3)#3 | 20.4%(+22.4)#143 |
| 4. | Prospect Park Borough | 40.9% | 22.5%(+18.5)#4 | 20.4%(+20.6)#167 |
| 5. | Lakewood | 39.9% | 22.5%(+17.5)#5 | 20.4%(+19.5)#196 |
| 6. | Cedarville | 39.0% | 22.5%(+16.5)#6 | 20.4%(+18.6)#222 |
| 7. | Port Norris | 38.5% | 22.5%(+16.0)#7 | 20.4%(+18.1)#232 |
| 8. | Atlantic City | 38.2% | 22.5%(+15.7)#8 | 20.4%(+17.8)#240 |
| 9. | New Vernon | 37.5% | 22.5%(+15.0)#9 | 20.4%(+17.1)#268 |
| 10. | Dover Beaches North | 37.5% | 22.5%(+15.0)#10 | 20.4%(+17.1)#270 |
| 11. | Harrisonville | 37.2% | 22.5%(+14.7)#11 | 20.4%(+16.8)#290 |
| 12. | New Brunswick | 36.3% | 22.5%(+13.9)#12 | 20.4%(+16.0)#335 |
| 13. | Rosenhayn | 36.1% | 22.5%(+13.7)#13 | 20.4%(+15.8)#342 |
| 14. | Jobstown | 35.3% | 22.5%(+12.9)#14 | 20.4%(+14.9)#384 |
| 15. | Newark | 35.3% | 22.5%(+12.8)#15 | 20.4%(+14.9)#385 |
| 16. | Fairview Borough | 34.9% | 22.5%(+12.5)#16 | 20.4%(+14.5)#410 |
| 17. | Mcguire Afb | 34.8% | 22.5%(+12.4)#17 | 20.4%(+14.5)#416 |
| 18. | Perth Amboy | 34.5% | 22.5%(+12.0)#18 | 20.4%(+14.1)#438 |
| 19. | Wildwood | 34.2% | 22.5%(+11.7)#19 | 20.4%(+13.8)#457 |
| 20. | Paterson | 34.0% | 22.5%(+11.6)#20 | 20.4%(+13.6)#470 |
| 21. | Camden | 34.0% | 22.5%(+11.5)#21 | 20.4%(+13.6)#475 |
| 22. | Delaware | 33.8% | 22.5%(+11.4)#22 | 20.4%(+13.5)#486 |
| 23. | Hainesburg | 33.2% | 22.5%(+10.7)#23 | 20.4%(+12.8)#534 |
| 24. | Bridgeton | 33.2% | 22.5%(+10.7)#24 | 20.4%(+12.8)#539 |
| 25. | Keasbey | 33.2% | 22.5%(+10.7)#25 | 20.4%(+12.8)#542 |
| 26. | Salem | 33.2% | 22.5%(+10.7)#26 | 20.4%(+12.8)#543 |
| 27. | Pleasantville | 33.1% | 22.5%(+10.7)#27 | 20.4%(+12.7)#546 |
| 28. | East Newark Borough | 33.0% | 22.5%(+10.5)#28 | 20.4%(+12.6)#559 |
| 29. | Fortescue | 32.9% | 22.5%(+10.4)#29 | 20.4%(+12.5)#577 |
| 30. | Seaside Heights Borough | 32.7% | 22.5%(+10.2)#30 | 20.4%(+12.3)#596 |
| 31. | Clearbrook | 32.6% | 22.5%(+10.1)#31 | 20.4%(+12.2)#602 |
| 32. | Harrison | 32.3% | 22.5%(+9.83)#32 | 20.4%(+11.9)#636 |
| 33. | Dover | 32.1% | 22.5%(+9.68)#33 | 20.4%(+11.8)#647 |
| 34. | Asbury Park | 32.0% | 22.5%(+9.55)#34 | 20.4%(+11.6)#662 |
| 35. | Trenton | 31.9% | 22.5%(+9.40)#35 | 20.4%(+11.5)#684 |
| 36. | Fort Dix | 31.2% | 22.5%(+8.75)#36 | 20.4%(+10.8)#764 |
| 37. | Green | 31.1% | 22.5%(+8.61)#37 | 20.4%(+10.7)#789 |
| 38. | Windsor | 31.0% | 22.5%(+8.51)#38 | 20.4%(+10.6)#803 |
| 39. | Leisure Village | 30.9% | 22.5%(+8.42)#39 | 20.4%(+10.5)#815 |
| 40. | Asbury | 30.6% | 22.5%(+8.16)#40 | 20.4%(+10.2)#859 |
| 41. | Freehold Borough | 30.6% | 22.5%(+8.11)#41 | 20.4%(+10.2)#872 |
| 42. | Victory Gardens Borough | 30.2% | 22.5%(+7.78)#42 | 20.4%(+9.86)#924 |
| 43. | Ocean Grove | 30.2% | 22.5%(+7.73)#43 | 20.4%(+9.81)#936 |
| 44. | Watsessing | 30.1% | 22.5%(+7.65)#44 | 20.4%(+9.73)#948 |
| 45. | Silver Ridge | 30.1% | 22.5%(+7.62)#45 | 20.4%(+9.71)#957 |
| 46. | Egg Harbor City | 29.9% | 22.5%(+7.47)#46 | 20.4%(+9.56)#990 |
| 47. | East Orange | 29.9% | 22.5%(+7.47)#47 | 20.4%(+9.55)#993 |
| 48. | Union City | 29.8% | 22.5%(+7.35)#48 | 20.4%(+9.44)#1,003 |
| 49. | Passaic | 29.7% | 22.5%(+7.23)#49 | 20.4%(+9.32)#1,029 |
| 50. | Long Branch | 29.7% | 22.5%(+7.23)#50 | 20.4%(+9.31)#1,031 |
| 51. | Cranford | 29.6% | 22.5%(+7.16)#51 | 20.4%(+9.25)#1,043 |
| 52. | Dorchester | 29.5% | 22.5%(+7.08)#52 | 20.4%(+9.17)#1,059 |
| 53. | Seabrook Farms | 29.5% | 22.5%(+7.03)#53 | 20.4%(+9.11)#1,072 |
| 54. | Whitesboro | 29.4% | 22.5%(+6.98)#54 | 20.4%(+9.07)#1,082 |
| 55. | Ampere North | 29.4% | 22.5%(+6.95)#55 | 20.4%(+9.04)#1,091 |
| 56. | Plainfield | 29.4% | 22.5%(+6.93)#56 | 20.4%(+9.02)#1,095 |
| 57. | Encore At Monroe | 29.3% | 22.5%(+6.84)#57 | 20.4%(+8.93)#1,114 |
| 58. | Elizabeth | 29.3% | 22.5%(+6.83)#58 | 20.4%(+8.91)#1,118 |
| 59. | Concordia | 29.0% | 22.5%(+6.53)#59 | 20.4%(+8.61)#1,190 |
| 60. | Mckee | 28.7% | 22.5%(+6.25)#60 | 20.4%(+8.34)#1,257 |
| 61. | Guttenberg | 28.7% | 22.5%(+6.24)#61 | 20.4%(+8.32)#1,263 |
| 62. | Rutgers University-Busch Campus | 28.7% | 22.5%(+6.22)#62 | 20.4%(+8.30)#1,274 |
| 63. | Seaside Park Borough | 28.4% | 22.5%(+5.91)#63 | 20.4%(+8.00)#1,362 |
| 64. | Absecon Highlands | 28.4% | 22.5%(+5.91)#64 | 20.4%(+7.99)#1,364 |
| 65. | Thorofare | 28.4% | 22.5%(+5.90)#65 | 20.4%(+7.99)#1,369 |
| 66. | Englewood | 28.3% | 22.5%(+5.86)#66 | 20.4%(+7.94)#1,383 |
| 67. | West New York | 28.2% | 22.5%(+5.77)#67 | 20.4%(+7.85)#1,409 |
| 68. | Elmwood Park Borough | 28.2% | 22.5%(+5.74)#68 | 20.4%(+7.83)#1,414 |
| 69. | Hackensack | 28.2% | 22.5%(+5.74)#69 | 20.4%(+7.83)#1,415 |
| 70. | Carteret Borough | 28.2% | 22.5%(+5.73)#70 | 20.4%(+7.81)#1,420 |
| 71. | Ocean Gate Borough | 28.2% | 22.5%(+5.70)#71 | 20.4%(+7.79)#1,430 |
| 72. | Little Ferry Borough | 28.1% | 22.5%(+5.59)#72 | 20.4%(+7.68)#1,470 |
| 73. | Roselle Borough | 27.9% | 22.5%(+5.47)#73 | 20.4%(+7.56)#1,519 |
| 74. | Hi Nella Borough | 27.9% | 22.5%(+5.42)#74 | 20.4%(+7.51)#1,542 |
| 75. | Deal Borough | 27.9% | 22.5%(+5.42)#75 | 20.4%(+7.51)#1,544 |
| 76. | Mount Arlington Borough | 27.8% | 22.5%(+5.33)#76 | 20.4%(+7.41)#1,589 |
| 77. | Leonia Borough | 27.7% | 22.5%(+5.28)#77 | 20.4%(+7.37)#1,605 |
| 78. | Voorhees | 27.7% | 22.5%(+5.23)#78 | 20.4%(+7.32)#1,619 |
| 79. | Strathmere | 27.7% | 22.5%(+5.21)#79 | 20.4%(+7.30)#1,625 |
| 80. | Lindenwold Borough | 27.7% | 22.5%(+5.21)#80 | 20.4%(+7.30)#1,626 |
| 81. | Singac | 27.6% | 22.5%(+5.09)#81 | 20.4%(+7.18)#1,664 |
| 82. | Bound Brook Borough | 27.5% | 22.5%(+5.08)#82 | 20.4%(+7.17)#1,668 |
| 83. | English Creek | 27.5% | 22.5%(+5.07)#83 | 20.4%(+7.16)#1,671 |
| 84. | Milmay | 27.5% | 22.5%(+5.01)#84 | 20.4%(+7.10)#1,694 |
| 85. | Finesville | 27.5% | 22.5%(+5.00)#85 | 20.4%(+7.09)#1,700 |
| 86. | Pedricktown | 27.3% | 22.5%(+4.84)#86 | 20.4%(+6.92)#1,764 |
| 87. | Oxford | 27.3% | 22.5%(+4.82)#87 | 20.4%(+6.91)#1,774 |
| 88. | Fieldsboro Borough | 27.3% | 22.5%(+4.81)#88 | 20.4%(+6.89)#1,784 |
| 89. | Dorothy | 27.1% | 22.5%(+4.65)#89 | 20.4%(+6.74)#1,835 |
| 90. | Newport | 27.0% | 22.5%(+4.59)#90 | 20.4%(+6.67)#1,873 |
| 91. | Marksboro | 27.0% | 22.5%(+4.52)#91 | 20.4%(+6.60)#1,903 |
| 92. | Wharton Borough | 26.9% | 22.5%(+4.45)#92 | 20.4%(+6.53)#1,936 |
| 93. | Dunellen Borough | 26.9% | 22.5%(+4.44)#93 | 20.4%(+6.53)#1,938 |
| 94. | New Egypt | 26.8% | 22.5%(+4.38)#94 | 20.4%(+6.46)#1,973 |
| 95. | North Plainfield Borough | 26.8% | 22.5%(+4.31)#95 | 20.4%(+6.40)#2,002 |
| 96. | Wrightstown Borough | 26.8% | 22.5%(+4.31)#96 | 20.4%(+6.39)#2,006 |
| 97. | Garfield | 26.8% | 22.5%(+4.30)#97 | 20.4%(+6.38)#2,012 |
| 98. | Gouldtown | 26.8% | 22.5%(+4.30)#98 | 20.4%(+6.38)#2,013 |
| 99. | Hamburg Borough | 26.7% | 22.5%(+4.21)#99 | 20.4%(+6.30)#2,053 |
| 100. | Paulsboro Borough | 26.6% | 22.5%(+4.17)#100 | 20.4%(+6.25)#2,077 |
Common Questions
What are the Top 10 Cities with the Highest Costs of Housing as Percentage of Income in New Jersey?
Top 10 Cities with the Highest Costs of Housing as Percentage of Income in New Jersey are:
#1
59.9%
#2
39.9%
#3
39.0%
#4
38.5%
#5
38.2%
#6
37.5%
#7
36.3%
#8
36.1%
#9
35.3%
#10
34.8%
What city has the Highest Costs of Housing as Percentage of Income in New Jersey?
Port Colden has the Highest Costs of Housing as Percentage of Income in New Jersey with 59.9%.
What is the Average Housing Costs as Percentage of Income in the State of New Jersey?
Average Housing Costs as Percentage of Income in New Jersey is 22.5%.
What is the Average Housing Costs as Percentage of Income in the United States?
Average Housing Costs as Percentage of Income in the United States is 20.4%.