Cities with the Most Immigrants from Romania in New Jersey
RELATED REPORTS & OPTIONS
Romania
New Jersey
Compare Cities
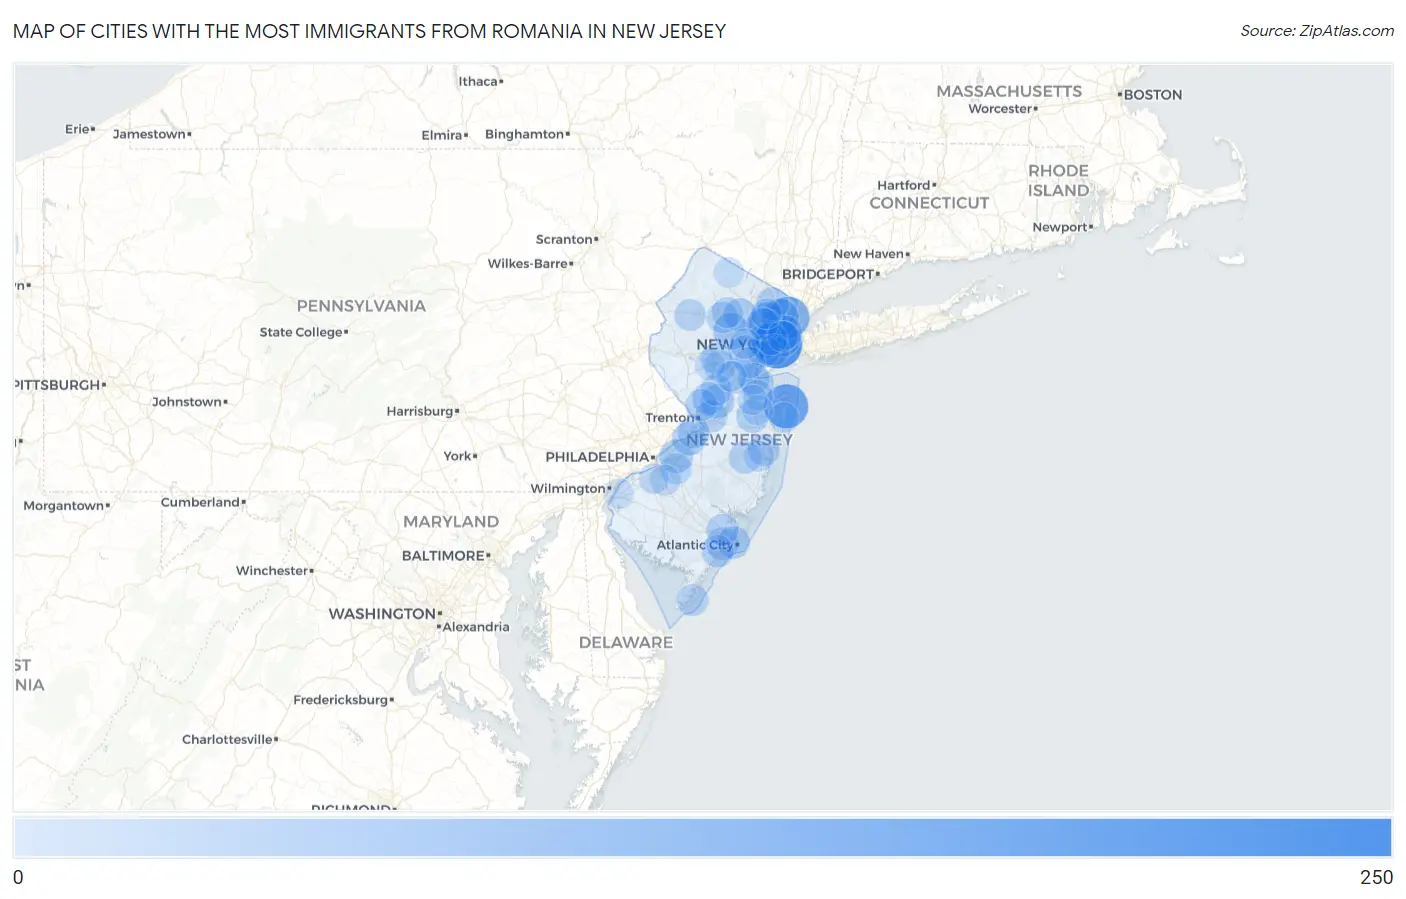
Map of Cities with the Most Immigrants from Romania in New Jersey
0
250
Cities with the Most Immigrants from Romania in New Jersey
| City | Romania | vs State | vs National | |
| 1. | Jersey City | 216 | 6,033(3.58%)#1 | 164,406(0.13%)#96 |
| 2. | Fort Lee Borough | 199 | 6,033(3.30%)#2 | 164,406(0.12%)#105 |
| 3. | Cliffside Park Borough | 195 | 6,033(3.23%)#3 | 164,406(0.12%)#108 |
| 4. | Long Branch | 158 | 6,033(2.62%)#4 | 164,406(0.10%)#136 |
| 5. | Englewood | 128 | 6,033(2.12%)#5 | 164,406(0.08%)#189 |
| 6. | Clifton | 89 | 6,033(1.48%)#6 | 164,406(0.05%)#291 |
| 7. | Hackensack | 88 | 6,033(1.46%)#7 | 164,406(0.05%)#293 |
| 8. | Tenafly Borough | 73 | 6,033(1.21%)#8 | 164,406(0.04%)#366 |
| 9. | Morristown | 72 | 6,033(1.19%)#9 | 164,406(0.04%)#372 |
| 10. | Hoboken | 68 | 6,033(1.13%)#10 | 164,406(0.04%)#393 |
| 11. | Fair Lawn Borough | 68 | 6,033(1.13%)#11 | 164,406(0.04%)#395 |
| 12. | Westfield | 57 | 6,033(0.94%)#12 | 164,406(0.03%)#475 |
| 13. | Newark | 56 | 6,033(0.93%)#13 | 164,406(0.03%)#481 |
| 14. | Wood Ridge Borough | 53 | 6,033(0.88%)#14 | 164,406(0.03%)#510 |
| 15. | West New York | 51 | 6,033(0.85%)#15 | 164,406(0.03%)#531 |
| 16. | Plainsboro Center | 50 | 6,033(0.83%)#16 | 164,406(0.03%)#553 |
| 17. | Moorestown Lenola | 48 | 6,033(0.80%)#17 | 164,406(0.03%)#574 |
| 18. | Ramsey Borough | 47 | 6,033(0.78%)#18 | 164,406(0.03%)#587 |
| 19. | Burlington | 47 | 6,033(0.78%)#19 | 164,406(0.03%)#588 |
| 20. | Butler Borough | 45 | 6,033(0.75%)#20 | 164,406(0.03%)#613 |
| 21. | Fairview Borough | 44 | 6,033(0.73%)#21 | 164,406(0.03%)#624 |
| 22. | Paramus Borough | 43 | 6,033(0.71%)#22 | 164,406(0.03%)#636 |
| 23. | Boonton | 43 | 6,033(0.71%)#23 | 164,406(0.03%)#641 |
| 24. | Washington Borough | 42 | 6,033(0.70%)#24 | 164,406(0.03%)#655 |
| 25. | Closter Borough | 41 | 6,033(0.68%)#25 | 164,406(0.02%)#673 |
| 26. | Ridgewood | 40 | 6,033(0.66%)#26 | 164,406(0.02%)#676 |
| 27. | Great Notch | 40 | 6,033(0.66%)#27 | 164,406(0.02%)#685 |
| 28. | West Freehold | 39 | 6,033(0.65%)#28 | 164,406(0.02%)#706 |
| 29. | Laurence Harbor | 39 | 6,033(0.65%)#29 | 164,406(0.02%)#711 |
| 30. | Brookdale | 38 | 6,033(0.63%)#30 | 164,406(0.02%)#724 |
| 31. | Princeton | 37 | 6,033(0.61%)#31 | 164,406(0.02%)#731 |
| 32. | Park Ridge Borough | 37 | 6,033(0.61%)#32 | 164,406(0.02%)#742 |
| 33. | Bogota Borough | 37 | 6,033(0.61%)#33 | 164,406(0.02%)#743 |
| 34. | Northfield | 37 | 6,033(0.61%)#34 | 164,406(0.02%)#744 |
| 35. | Little Silver Borough | 37 | 6,033(0.61%)#35 | 164,406(0.02%)#747 |
| 36. | Atlantic City | 36 | 6,033(0.60%)#36 | 164,406(0.02%)#757 |
| 37. | Haledon Borough | 36 | 6,033(0.60%)#37 | 164,406(0.02%)#768 |
| 38. | Elizabeth | 35 | 6,033(0.58%)#38 | 164,406(0.02%)#771 |
| 39. | Hamilton Square | 35 | 6,033(0.58%)#39 | 164,406(0.02%)#786 |
| 40. | Kearny | 34 | 6,033(0.56%)#40 | 164,406(0.02%)#793 |
| 41. | Crestwood Village | 34 | 6,033(0.56%)#41 | 164,406(0.02%)#798 |
| 42. | New Brunswick | 33 | 6,033(0.55%)#42 | 164,406(0.02%)#804 |
| 43. | Somers Point | 33 | 6,033(0.55%)#43 | 164,406(0.02%)#816 |
| 44. | Pomona | 32 | 6,033(0.53%)#44 | 164,406(0.02%)#834 |
| 45. | North Caldwell Borough | 32 | 6,033(0.53%)#45 | 164,406(0.02%)#838 |
| 46. | Florence | 31 | 6,033(0.51%)#46 | 164,406(0.02%)#861 |
| 47. | Basking Ridge | 30 | 6,033(0.50%)#47 | 164,406(0.02%)#880 |
| 48. | Wildwood | 29 | 6,033(0.48%)#48 | 164,406(0.02%)#905 |
| 49. | Lawrenceville | 29 | 6,033(0.48%)#49 | 164,406(0.02%)#907 |
| 50. | Toms River | 28 | 6,033(0.46%)#50 | 164,406(0.02%)#917 |
| 51. | Highland Park Borough | 28 | 6,033(0.46%)#51 | 164,406(0.02%)#931 |
| 52. | Upper Montclair | 28 | 6,033(0.46%)#52 | 164,406(0.02%)#935 |
| 53. | South Amboy | 28 | 6,033(0.46%)#53 | 164,406(0.02%)#938 |
| 54. | Cresskill Borough | 28 | 6,033(0.46%)#54 | 164,406(0.02%)#940 |
| 55. | Panther Valley | 27 | 6,033(0.45%)#55 | 164,406(0.02%)#970 |
| 56. | Allenhurst Borough | 27 | 6,033(0.45%)#56 | 164,406(0.02%)#973 |
| 57. | Mizpah | 27 | 6,033(0.45%)#57 | 164,406(0.02%)#974 |
| 58. | South Plainfield Borough | 26 | 6,033(0.43%)#58 | 164,406(0.02%)#986 |
| 59. | Montvale Borough | 26 | 6,033(0.43%)#59 | 164,406(0.02%)#991 |
| 60. | Finderne | 26 | 6,033(0.43%)#60 | 164,406(0.02%)#996 |
| 61. | East Rocky Hill | 26 | 6,033(0.43%)#61 | 164,406(0.02%)#1,000 |
| 62. | Bayonne | 25 | 6,033(0.41%)#62 | 164,406(0.02%)#1,006 |
| 63. | Dover | 25 | 6,033(0.41%)#63 | 164,406(0.02%)#1,018 |
| 64. | Springdale | 24 | 6,033(0.40%)#64 | 164,406(0.01%)#1,046 |
| 65. | Green Knoll | 24 | 6,033(0.40%)#65 | 164,406(0.01%)#1,050 |
| 66. | The Hills | 23 | 6,033(0.38%)#66 | 164,406(0.01%)#1,073 |
| 67. | Bergenfield Borough | 22 | 6,033(0.36%)#67 | 164,406(0.01%)#1,092 |
| 68. | Raritan Borough | 22 | 6,033(0.36%)#68 | 164,406(0.01%)#1,106 |
| 69. | Palisades Park Borough | 20 | 6,033(0.33%)#69 | 164,406(0.01%)#1,158 |
| 70. | Ridgefield Borough | 20 | 6,033(0.33%)#70 | 164,406(0.01%)#1,164 |
| 71. | White Meadow Lake | 20 | 6,033(0.33%)#71 | 164,406(0.01%)#1,166 |
| 72. | Colonia | 19 | 6,033(0.31%)#72 | 164,406(0.01%)#1,190 |
| 73. | Leonia Borough | 19 | 6,033(0.31%)#73 | 164,406(0.01%)#1,203 |
| 74. | Hopatcong Borough | 18 | 6,033(0.30%)#74 | 164,406(0.01%)#1,241 |
| 75. | Glen Rock Borough | 18 | 6,033(0.30%)#75 | 164,406(0.01%)#1,246 |
| 76. | Blackwood | 18 | 6,033(0.30%)#76 | 164,406(0.01%)#1,256 |
| 77. | Silver Ridge | 18 | 6,033(0.30%)#77 | 164,406(0.01%)#1,261 |
| 78. | Woodland Park Borough | 17 | 6,033(0.28%)#78 | 164,406(0.01%)#1,284 |
| 79. | Sayreville Borough | 16 | 6,033(0.27%)#79 | 164,406(0.01%)#1,320 |
| 80. | Summit | 16 | 6,033(0.27%)#80 | 164,406(0.01%)#1,331 |
| 81. | Bradley Gardens | 16 | 6,033(0.27%)#81 | 164,406(0.01%)#1,342 |
| 82. | Maywood Borough | 16 | 6,033(0.27%)#82 | 164,406(0.01%)#1,348 |
| 83. | East Franklin | 16 | 6,033(0.27%)#83 | 164,406(0.01%)#1,349 |
| 84. | Union City | 15 | 6,033(0.25%)#84 | 164,406(0.01%)#1,371 |
| 85. | Hillsdale Borough | 15 | 6,033(0.25%)#85 | 164,406(0.01%)#1,397 |
| 86. | Newfoundland | 15 | 6,033(0.25%)#86 | 164,406(0.01%)#1,405 |
| 87. | Paterson | 14 | 6,033(0.23%)#87 | 164,406(0.01%)#1,408 |
| 88. | Preakness | 14 | 6,033(0.23%)#88 | 164,406(0.01%)#1,426 |
| 89. | Asbury Park | 13 | 6,033(0.22%)#89 | 164,406(0.01%)#1,466 |
| 90. | Morganville | 13 | 6,033(0.22%)#90 | 164,406(0.01%)#1,482 |
| 91. | East Freehold | 13 | 6,033(0.22%)#91 | 164,406(0.01%)#1,483 |
| 92. | Oak Valley | 13 | 6,033(0.22%)#92 | 164,406(0.01%)#1,488 |
| 93. | Carneys Point | 12 | 6,033(0.20%)#93 | 164,406(0.01%)#1,522 |
| 94. | Vernon Center | 12 | 6,033(0.20%)#94 | 164,406(0.01%)#1,537 |
| 95. | Springfield | 12 | 6,033(0.20%)#95 | 164,406(0.01%)#1,538 |
| 96. | Parsippany | 11 | 6,033(0.18%)#96 | 164,406(0.01%)#1,568 |
| 97. | Robertsville | 11 | 6,033(0.18%)#97 | 164,406(0.01%)#1,578 |
| 98. | Chatham Borough | 11 | 6,033(0.18%)#98 | 164,406(0.01%)#1,586 |
| 99. | Rumson Borough | 11 | 6,033(0.18%)#99 | 164,406(0.01%)#1,591 |
| 100. | Rockaway Borough | 11 | 6,033(0.18%)#100 | 164,406(0.01%)#1,593 |
Common Questions
What are the Top 10 Cities with the Most Immigrants from Romania in New Jersey?
Top 10 Cities with the Most Immigrants from Romania in New Jersey are:
#1
216
#2
158
#3
128
#4
89
#5
88
#6
72
#7
68
#8
57
#9
56
#10
51
What city has the Most Immigrants from Romania in New Jersey?
Jersey City has the Most Immigrants from Romania in New Jersey with 216.
What is the Total Immigrants from Romania in the State of New Jersey?
Total Immigrants from Romania in New Jersey is 6,033.
What is the Total Immigrants from Romania in the United States?
Total Immigrants from Romania in the United States is 164,406.