Cities with the Highest Percentage of Population with a Degree in Bio, Nature & Agricultural in New Jersey
RELATED REPORTS & OPTIONS
Bio, Nature & Agricultural
New Jersey
Compare Cities
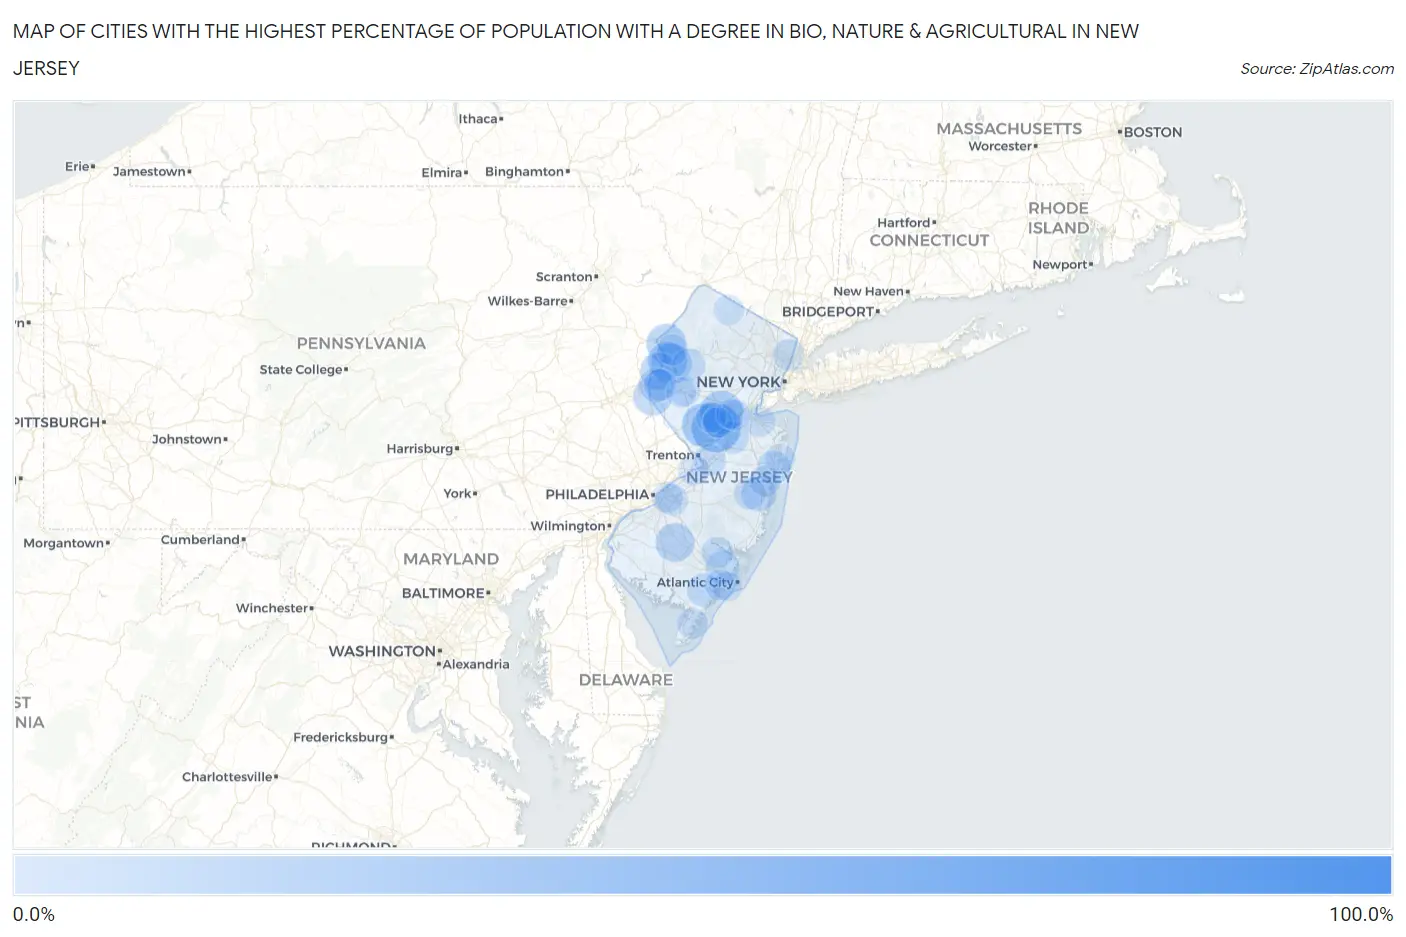
Map of Cities with the Highest Percentage of Population with a Degree in Bio, Nature & Agricultural in New Jersey
0.0%
100.0%
Cities with the Highest Percentage of Population with a Degree in Bio, Nature & Agricultural in New Jersey
| City | % Graduates | vs State | vs National | |
| 1. | Hibernia | 100.0% | 5.2%(+94.8)#1 | 6.4%(+93.6)#106 |
| 2. | Money Island | 57.1% | 5.2%(+51.9)#2 | 6.4%(+50.8)#263 |
| 3. | East Rocky Hill | 40.4% | 5.2%(+35.2)#3 | 6.4%(+34.1)#529 |
| 4. | Skillman | 31.2% | 5.2%(+26.0)#4 | 6.4%(+24.8)#910 |
| 5. | East Millstone | 30.4% | 5.2%(+25.1)#5 | 6.4%(+24.0)#959 |
| 6. | Germania | 28.0% | 5.2%(+22.8)#6 | 6.4%(+21.6)#1,103 |
| 7. | Buttzville | 26.3% | 5.2%(+21.0)#7 | 6.4%(+19.9)#1,254 |
| 8. | Kean University | 25.0% | 5.2%(+19.8)#8 | 6.4%(+18.6)#1,351 |
| 9. | Hainesburg | 24.5% | 5.2%(+19.3)#9 | 6.4%(+18.2)#1,466 |
| 10. | Bridgeville | 23.9% | 5.2%(+18.6)#10 | 6.4%(+17.5)#1,523 |
| 11. | Victory Lakes | 23.1% | 5.2%(+17.9)#11 | 6.4%(+16.8)#1,595 |
| 12. | Finesville | 22.7% | 5.2%(+17.4)#12 | 6.4%(+16.3)#1,659 |
| 13. | Milmay | 22.0% | 5.2%(+16.8)#13 | 6.4%(+15.7)#1,747 |
| 14. | Connecticut Farms | 21.8% | 5.2%(+16.6)#14 | 6.4%(+15.4)#1,772 |
| 15. | Seeley | 21.4% | 5.2%(+16.2)#15 | 6.4%(+15.1)#1,830 |
| 16. | Hutchinson | 21.1% | 5.2%(+15.8)#16 | 6.4%(+14.7)#1,883 |
| 17. | Mount Tabor | 19.6% | 5.2%(+14.4)#17 | 6.4%(+13.2)#2,134 |
| 18. | Fieldsboro Borough | 18.3% | 5.2%(+13.0)#18 | 6.4%(+11.9)#2,391 |
| 19. | Silver Ridge | 17.3% | 5.2%(+12.0)#19 | 6.4%(+10.9)#2,594 |
| 20. | Ogdensburg Borough | 16.8% | 5.2%(+11.6)#20 | 6.4%(+10.5)#2,677 |
| 21. | Greenwich | 15.7% | 5.2%(+10.5)#21 | 6.4%(+9.39)#3,024 |
| 22. | Dennisville | 15.5% | 5.2%(+10.3)#22 | 6.4%(+9.18)#3,083 |
| 23. | Woodlynne Borough | 14.9% | 5.2%(+9.71)#23 | 6.4%(+8.59)#3,254 |
| 24. | Lake Hiawatha | 14.9% | 5.2%(+9.70)#24 | 6.4%(+8.58)#3,257 |
| 25. | Pleasant Plains | 14.9% | 5.2%(+9.68)#25 | 6.4%(+8.56)#3,263 |
| 26. | Pomona | 14.9% | 5.2%(+9.63)#26 | 6.4%(+8.51)#3,281 |
| 27. | Corbin City | 14.7% | 5.2%(+9.50)#27 | 6.4%(+8.38)#3,312 |
| 28. | New Gretna | 14.7% | 5.2%(+9.47)#28 | 6.4%(+8.35)#3,326 |
| 29. | Allenwood | 14.7% | 5.2%(+9.44)#29 | 6.4%(+8.32)#3,332 |
| 30. | East Newark Borough | 14.4% | 5.2%(+9.14)#30 | 6.4%(+8.02)#3,452 |
| 31. | Ringoes | 14.3% | 5.2%(+9.05)#31 | 6.4%(+7.93)#3,487 |
| 32. | Pine Hill Borough | 14.0% | 5.2%(+8.74)#32 | 6.4%(+7.62)#3,657 |
| 33. | Beattystown | 13.8% | 5.2%(+8.54)#33 | 6.4%(+7.42)#3,744 |
| 34. | Millington | 13.4% | 5.2%(+8.17)#34 | 6.4%(+7.05)#3,889 |
| 35. | Auburn | 13.3% | 5.2%(+8.11)#35 | 6.4%(+6.99)#3,905 |
| 36. | Marshallville | 13.0% | 5.2%(+7.75)#36 | 6.4%(+6.63)#4,083 |
| 37. | Rossmoor | 13.0% | 5.2%(+7.72)#37 | 6.4%(+6.60)#4,096 |
| 38. | Flanders | 12.9% | 5.2%(+7.62)#38 | 6.4%(+6.51)#4,148 |
| 39. | Stewartsville | 12.3% | 5.2%(+7.04)#39 | 6.4%(+5.92)#4,468 |
| 40. | Keasbey | 12.2% | 5.2%(+6.99)#40 | 6.4%(+5.88)#4,492 |
| 41. | Washington Crossing | 12.2% | 5.2%(+6.99)#41 | 6.4%(+5.87)#4,497 |
| 42. | Yardville | 11.9% | 5.2%(+6.66)#42 | 6.4%(+5.54)#4,673 |
| 43. | Englewood | 11.8% | 5.2%(+6.57)#43 | 6.4%(+5.45)#4,721 |
| 44. | Neshanic Station | 11.8% | 5.2%(+6.55)#44 | 6.4%(+5.44)#4,724 |
| 45. | Dorothy | 11.7% | 5.2%(+6.44)#45 | 6.4%(+5.32)#4,799 |
| 46. | Oldwick | 11.7% | 5.2%(+6.43)#46 | 6.4%(+5.31)#4,805 |
| 47. | Pine Ridge At Crestwood | 11.7% | 5.2%(+6.41)#47 | 6.4%(+5.30)#4,809 |
| 48. | Egg Harbor City | 11.6% | 5.2%(+6.37)#48 | 6.4%(+5.26)#4,836 |
| 49. | Llewellyn Park | 11.6% | 5.2%(+6.31)#49 | 6.4%(+5.20)#4,864 |
| 50. | Roosevelt Borough | 11.5% | 5.2%(+6.29)#50 | 6.4%(+5.17)#4,888 |
| 51. | Laurel Springs Borough | 11.5% | 5.2%(+6.27)#51 | 6.4%(+5.15)#4,900 |
| 52. | Teterboro Borough | 11.1% | 5.2%(+5.88)#52 | 6.4%(+4.76)#5,184 |
| 53. | Pennington Borough | 11.0% | 5.2%(+5.74)#53 | 6.4%(+4.62)#5,242 |
| 54. | Mount Hermon | 11.0% | 5.2%(+5.72)#54 | 6.4%(+4.61)#5,250 |
| 55. | Union | 10.9% | 5.2%(+5.64)#55 | 6.4%(+4.53)#5,309 |
| 56. | Wharton Borough | 10.9% | 5.2%(+5.62)#56 | 6.4%(+4.50)#5,328 |
| 57. | High Bridge Borough | 10.8% | 5.2%(+5.60)#57 | 6.4%(+4.48)#5,343 |
| 58. | Othello | 10.8% | 5.2%(+5.57)#58 | 6.4%(+4.46)#5,373 |
| 59. | Franklinville | 10.7% | 5.2%(+5.51)#59 | 6.4%(+4.39)#5,409 |
| 60. | Ho Ho Kus Borough | 10.7% | 5.2%(+5.49)#60 | 6.4%(+4.37)#5,421 |
| 61. | National Park Borough | 10.7% | 5.2%(+5.43)#61 | 6.4%(+4.32)#5,475 |
| 62. | Neshanic | 10.6% | 5.2%(+5.40)#62 | 6.4%(+4.28)#5,497 |
| 63. | Stockton Borough | 10.6% | 5.2%(+5.36)#63 | 6.4%(+4.25)#5,520 |
| 64. | Kingston Estates | 10.5% | 5.2%(+5.31)#64 | 6.4%(+4.19)#5,557 |
| 65. | Pompton Lakes Borough | 10.5% | 5.2%(+5.24)#65 | 6.4%(+4.13)#5,625 |
| 66. | Cliffwood Beach | 10.5% | 5.2%(+5.24)#66 | 6.4%(+4.12)#5,630 |
| 67. | Leisure Village | 10.3% | 5.2%(+5.07)#67 | 6.4%(+3.95)#5,748 |
| 68. | Vincentown | 10.2% | 5.2%(+5.00)#68 | 6.4%(+3.88)#5,808 |
| 69. | Chesilhurst Borough | 10.2% | 5.2%(+4.99)#69 | 6.4%(+3.87)#5,811 |
| 70. | Golden Triangle | 10.2% | 5.2%(+4.96)#70 | 6.4%(+3.84)#5,841 |
| 71. | Rainbow Lakes | 10.2% | 5.2%(+4.91)#71 | 6.4%(+3.80)#5,864 |
| 72. | New Brunswick | 10.1% | 5.2%(+4.90)#72 | 6.4%(+3.78)#5,882 |
| 73. | Beesleys Point | 10.1% | 5.2%(+4.83)#73 | 6.4%(+3.72)#5,914 |
| 74. | Pemberton Borough | 10.0% | 5.2%(+4.81)#74 | 6.4%(+3.69)#5,928 |
| 75. | Old Tappan Borough | 10.0% | 5.2%(+4.79)#75 | 6.4%(+3.67)#5,937 |
| 76. | Barrington Borough | 10.0% | 5.2%(+4.78)#76 | 6.4%(+3.67)#5,943 |
| 77. | Florence | 10.0% | 5.2%(+4.75)#77 | 6.4%(+3.64)#6,028 |
| 78. | Monroe Manor | 10.0% | 5.2%(+4.73)#78 | 6.4%(+3.62)#6,036 |
| 79. | Cape May Court House | 9.9% | 5.2%(+4.67)#79 | 6.4%(+3.55)#6,067 |
| 80. | Wood Ridge Borough | 9.8% | 5.2%(+4.61)#80 | 6.4%(+3.49)#6,117 |
| 81. | Linwood | 9.8% | 5.2%(+4.56)#81 | 6.4%(+3.44)#6,160 |
| 82. | Farmingdale Borough | 9.8% | 5.2%(+4.53)#82 | 6.4%(+3.42)#6,180 |
| 83. | Magnolia Borough | 9.6% | 5.2%(+4.40)#83 | 6.4%(+3.28)#6,310 |
| 84. | Belle Mead | 9.6% | 5.2%(+4.36)#84 | 6.4%(+3.24)#6,345 |
| 85. | Penns Grove Borough | 9.5% | 5.2%(+4.23)#85 | 6.4%(+3.11)#6,472 |
| 86. | Griggstown | 9.4% | 5.2%(+4.19)#86 | 6.4%(+3.08)#6,512 |
| 87. | Far Hills Borough | 9.4% | 5.2%(+4.12)#87 | 6.4%(+3.00)#6,591 |
| 88. | Stratford Borough | 9.2% | 5.2%(+4.01)#88 | 6.4%(+2.89)#6,709 |
| 89. | Troy Hills | 9.2% | 5.2%(+3.98)#89 | 6.4%(+2.86)#6,733 |
| 90. | Annandale | 9.2% | 5.2%(+3.95)#90 | 6.4%(+2.83)#6,757 |
| 91. | Sweetwater | 9.2% | 5.2%(+3.93)#91 | 6.4%(+2.82)#6,770 |
| 92. | Clinton | 9.1% | 5.2%(+3.86)#92 | 6.4%(+2.74)#6,815 |
| 93. | Shark River Hills | 9.1% | 5.2%(+3.82)#93 | 6.4%(+2.70)#6,904 |
| 94. | Haddonfield Borough | 9.0% | 5.2%(+3.79)#94 | 6.4%(+2.68)#6,926 |
| 95. | Vernon Center | 9.0% | 5.2%(+3.78)#95 | 6.4%(+2.67)#6,936 |
| 96. | Margate City | 8.9% | 5.2%(+3.65)#96 | 6.4%(+2.54)#7,068 |
| 97. | Essex Fells Borough | 8.9% | 5.2%(+3.63)#97 | 6.4%(+2.51)#7,103 |
| 98. | Englewood Cliffs Borough | 8.8% | 5.2%(+3.60)#98 | 6.4%(+2.48)#7,136 |
| 99. | East Franklin | 8.8% | 5.2%(+3.58)#99 | 6.4%(+2.46)#7,167 |
| 100. | Oceanport Borough | 8.8% | 5.2%(+3.52)#100 | 6.4%(+2.40)#7,235 |
Common Questions
What are the Top 10 Cities with the Highest Percentage of Population with a Degree in Bio, Nature & Agricultural in New Jersey?
Top 10 Cities with the Highest Percentage of Population with a Degree in Bio, Nature & Agricultural in New Jersey are:
#1
40.4%
#2
31.2%
#3
30.4%
#4
26.3%
#5
24.5%
#6
23.9%
#7
23.1%
#8
22.7%
#9
21.1%
#10
17.3%
What city has the Highest Percentage of Population with a Degree in Bio, Nature & Agricultural in New Jersey?
East Rocky Hill has the Highest Percentage of Population with a Degree in Bio, Nature & Agricultural in New Jersey with 40.4%.
What is the Percentage of Population with a Degree in Bio, Nature & Agricultural in the State of New Jersey?
Percentage of Population with a Degree in Bio, Nature & Agricultural in New Jersey is 5.2%.
What is the Percentage of Population with a Degree in Bio, Nature & Agricultural in the United States?
Percentage of Population with a Degree in Bio, Nature & Agricultural in the United States is 6.4%.