Cities with the Lowest Inequality / Gini Index in New Jersey
RELATED REPORTS & OPTIONS
Lowest Inequality / Gini Index
New Jersey
Compare Cities
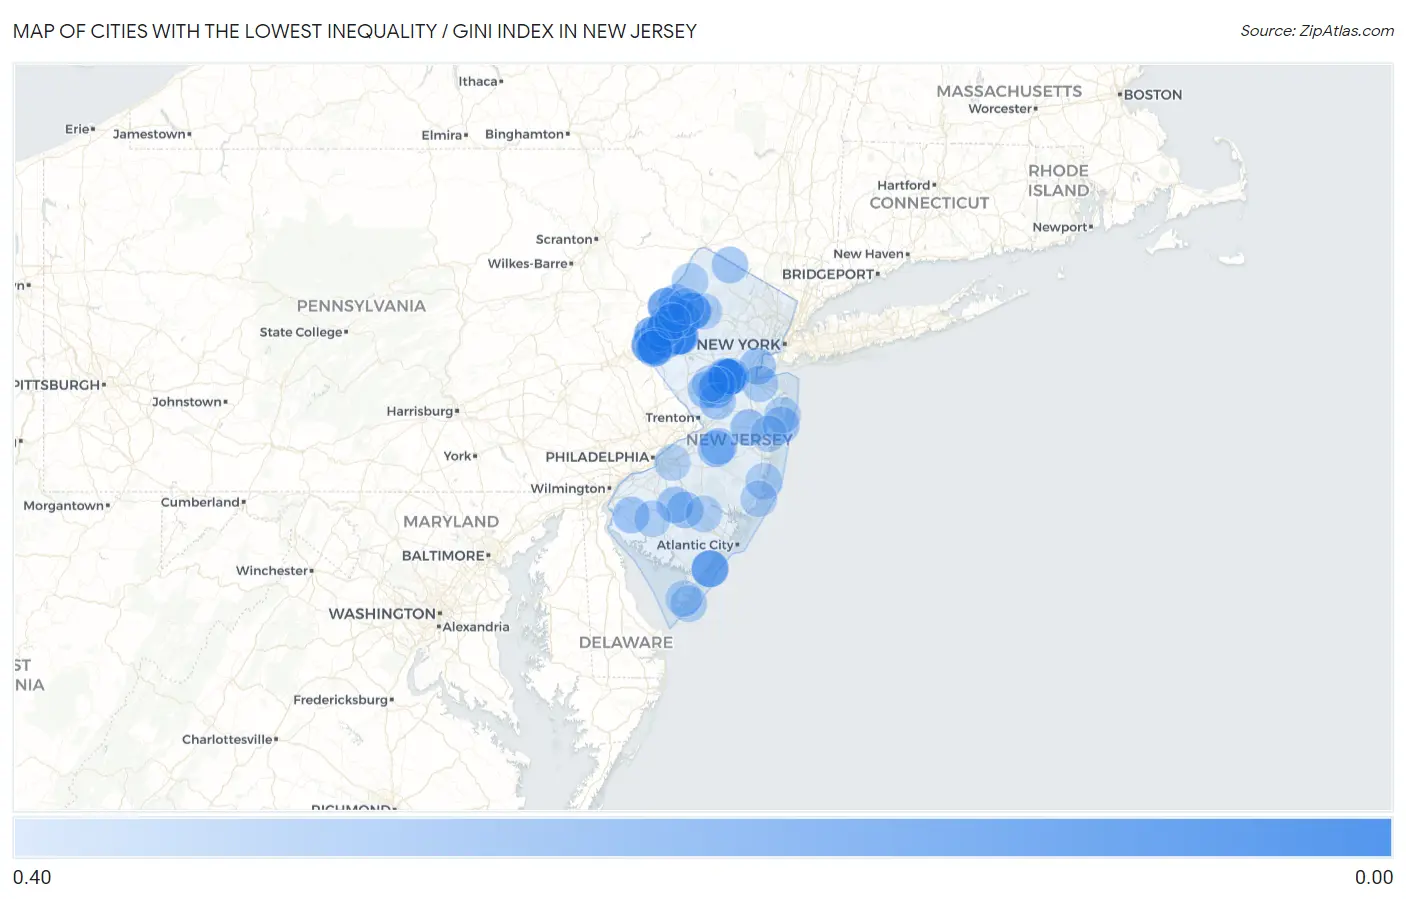
Map of Cities with the Lowest Inequality / Gini Index in New Jersey
0.40
0.00
Cities with the Lowest Inequality / Gini Index in New Jersey
| City | Inequality / Gini Index | vs State | vs National | |
| 1. | Gandys Beach | 0.06 | 0.48(-0.421)#1 | 0.48(-0.423)#165 |
| 2. | Clyde | 0.07 | 0.48(-0.412)#2 | 0.48(-0.413)#190 |
| 3. | Seeley | 0.08 | 0.48(-0.406)#3 | 0.48(-0.408)#211 |
| 4. | Heislerville | 0.11 | 0.48(-0.372)#4 | 0.48(-0.374)#342 |
| 5. | Port Colden | 0.11 | 0.48(-0.370)#5 | 0.48(-0.372)#349 |
| 6. | Allamuchy | 0.15 | 0.48(-0.331)#6 | 0.48(-0.332)#585 |
| 7. | Lamington | 0.15 | 0.48(-0.328)#7 | 0.48(-0.330)#607 |
| 8. | Tavistock Borough | 0.16 | 0.48(-0.325)#8 | 0.48(-0.327)#636 |
| 9. | Delaware Park | 0.16 | 0.48(-0.324)#9 | 0.48(-0.326)#643 |
| 10. | Strathmere | 0.17 | 0.48(-0.309)#10 | 0.48(-0.311)#780 |
| 11. | Bridgeville | 0.18 | 0.48(-0.306)#11 | 0.48(-0.307)#808 |
| 12. | Marshallville | 0.19 | 0.48(-0.295)#12 | 0.48(-0.296)#926 |
| 13. | Hainesburg | 0.19 | 0.48(-0.294)#13 | 0.48(-0.296)#927 |
| 14. | Bridgeport | 0.19 | 0.48(-0.290)#14 | 0.48(-0.292)#965 |
| 15. | Newtonville | 0.20 | 0.48(-0.285)#15 | 0.48(-0.287)#1,017 |
| 16. | Vincentown | 0.21 | 0.48(-0.275)#16 | 0.48(-0.277)#1,139 |
| 17. | East Vineland | 0.21 | 0.48(-0.274)#17 | 0.48(-0.276)#1,157 |
| 18. | Washington Crossing | 0.21 | 0.48(-0.270)#18 | 0.48(-0.272)#1,217 |
| 19. | Anderson | 0.21 | 0.48(-0.269)#19 | 0.48(-0.271)#1,229 |
| 20. | Brainards | 0.21 | 0.48(-0.269)#20 | 0.48(-0.271)#1,237 |
| 21. | Oceanville | 0.22 | 0.48(-0.265)#21 | 0.48(-0.267)#1,284 |
| 22. | Great Meadows | 0.22 | 0.48(-0.261)#22 | 0.48(-0.263)#1,343 |
| 23. | Dorothy | 0.23 | 0.48(-0.249)#23 | 0.48(-0.251)#1,520 |
| 24. | Greenwich | 0.25 | 0.48(-0.234)#24 | 0.48(-0.235)#1,812 |
| 25. | Forsgate | 0.25 | 0.48(-0.232)#25 | 0.48(-0.233)#1,852 |
| 26. | East Rocky Hill | 0.25 | 0.48(-0.229)#26 | 0.48(-0.230)#1,923 |
| 27. | Broadway | 0.26 | 0.48(-0.218)#27 | 0.48(-0.220)#2,170 |
| 28. | Dutch Neck | 0.26 | 0.48(-0.218)#28 | 0.48(-0.219)#2,184 |
| 29. | Pottersville | 0.26 | 0.48(-0.216)#29 | 0.48(-0.218)#2,222 |
| 30. | Nesco | 0.27 | 0.48(-0.216)#30 | 0.48(-0.217)#2,241 |
| 31. | Laurel Heights | 0.27 | 0.48(-0.215)#31 | 0.48(-0.217)#2,251 |
| 32. | Newfoundland | 0.27 | 0.48(-0.215)#32 | 0.48(-0.217)#2,256 |
| 33. | Hutchinson | 0.27 | 0.48(-0.210)#33 | 0.48(-0.212)#2,406 |
| 34. | Sweetwater | 0.27 | 0.48(-0.209)#34 | 0.48(-0.211)#2,445 |
| 35. | Mauricetown | 0.27 | 0.48(-0.209)#35 | 0.48(-0.211)#2,454 |
| 36. | Auburn | 0.27 | 0.48(-0.208)#36 | 0.48(-0.210)#2,466 |
| 37. | Goshen | 0.27 | 0.48(-0.208)#37 | 0.48(-0.209)#2,496 |
| 38. | Fort Dix | 0.27 | 0.48(-0.207)#38 | 0.48(-0.209)#2,507 |
| 39. | Delmont | 0.27 | 0.48(-0.207)#39 | 0.48(-0.209)#2,510 |
| 40. | Renaissance At Monroe | 0.28 | 0.48(-0.205)#40 | 0.48(-0.207)#2,570 |
| 41. | Brookfield | 0.28 | 0.48(-0.203)#41 | 0.48(-0.205)#2,669 |
| 42. | Millstone Borough | 0.28 | 0.48(-0.203)#42 | 0.48(-0.205)#2,670 |
| 43. | Dennisville | 0.28 | 0.48(-0.202)#43 | 0.48(-0.204)#2,710 |
| 44. | Port Reading | 0.28 | 0.48(-0.198)#44 | 0.48(-0.200)#2,841 |
| 45. | Blawenburg | 0.28 | 0.48(-0.198)#45 | 0.48(-0.200)#2,861 |
| 46. | Vista Center | 0.28 | 0.48(-0.198)#46 | 0.48(-0.200)#2,864 |
| 47. | Connecticut Farms | 0.29 | 0.48(-0.194)#47 | 0.48(-0.196)#2,996 |
| 48. | West Belmar | 0.29 | 0.48(-0.194)#48 | 0.48(-0.196)#3,005 |
| 49. | Vernon Valley | 0.29 | 0.48(-0.193)#49 | 0.48(-0.194)#3,069 |
| 50. | South Toms River Borough | 0.29 | 0.48(-0.192)#50 | 0.48(-0.193)#3,099 |
| 51. | Alloway | 0.29 | 0.48(-0.191)#51 | 0.48(-0.193)#3,123 |
| 52. | Middlebush | 0.29 | 0.48(-0.190)#52 | 0.48(-0.192)#3,160 |
| 53. | Branchville Borough | 0.29 | 0.48(-0.190)#53 | 0.48(-0.192)#3,161 |
| 54. | Stonebridge | 0.29 | 0.48(-0.190)#54 | 0.48(-0.192)#3,167 |
| 55. | Mizpah | 0.29 | 0.48(-0.190)#55 | 0.48(-0.192)#3,177 |
| 56. | Sewell | 0.29 | 0.48(-0.189)#56 | 0.48(-0.191)#3,200 |
| 57. | Collings Lakes | 0.29 | 0.48(-0.189)#57 | 0.48(-0.191)#3,224 |
| 58. | Port Elizabeth | 0.29 | 0.48(-0.188)#58 | 0.48(-0.190)#3,252 |
| 59. | South Dennis | 0.29 | 0.48(-0.187)#59 | 0.48(-0.189)#3,305 |
| 60. | Lopatcong Overlook | 0.29 | 0.48(-0.187)#60 | 0.48(-0.189)#3,307 |
| 61. | Stanhope Borough | 0.30 | 0.48(-0.184)#61 | 0.48(-0.186)#3,446 |
| 62. | Hope | 0.30 | 0.48(-0.184)#62 | 0.48(-0.185)#3,451 |
| 63. | Plainsboro Center | 0.30 | 0.48(-0.182)#63 | 0.48(-0.184)#3,554 |
| 64. | Victory Lakes | 0.30 | 0.48(-0.181)#64 | 0.48(-0.182)#3,611 |
| 65. | Blairstown | 0.30 | 0.48(-0.179)#65 | 0.48(-0.180)#3,713 |
| 66. | Mcguire Afb | 0.30 | 0.48(-0.176)#66 | 0.48(-0.178)#3,850 |
| 67. | Port Morris | 0.31 | 0.48(-0.172)#67 | 0.48(-0.173)#4,133 |
| 68. | Hewitt | 0.31 | 0.48(-0.171)#68 | 0.48(-0.173)#4,162 |
| 69. | Neshanic Station | 0.31 | 0.48(-0.171)#69 | 0.48(-0.173)#4,180 |
| 70. | Marlboro | 0.31 | 0.48(-0.169)#70 | 0.48(-0.171)#4,281 |
| 71. | Upper Pohatcong | 0.31 | 0.48(-0.168)#71 | 0.48(-0.169)#4,376 |
| 72. | Shiloh Borough | 0.31 | 0.48(-0.167)#72 | 0.48(-0.169)#4,401 |
| 73. | Diamond Beach | 0.32 | 0.48(-0.164)#73 | 0.48(-0.166)#4,604 |
| 74. | Troy Hills | 0.32 | 0.48(-0.164)#74 | 0.48(-0.166)#4,607 |
| 75. | Cliffwood Beach | 0.32 | 0.48(-0.164)#75 | 0.48(-0.165)#4,632 |
| 76. | East Franklin | 0.32 | 0.48(-0.164)#76 | 0.48(-0.165)#4,643 |
| 77. | Hi Nella Borough | 0.32 | 0.48(-0.163)#77 | 0.48(-0.165)#4,688 |
| 78. | Absecon Highlands | 0.32 | 0.48(-0.162)#78 | 0.48(-0.164)#4,726 |
| 79. | Byram Center | 0.32 | 0.48(-0.161)#79 | 0.48(-0.162)#4,811 |
| 80. | Crandon Lakes | 0.32 | 0.48(-0.160)#80 | 0.48(-0.162)#4,863 |
| 81. | The Ponds | 0.32 | 0.48(-0.160)#81 | 0.48(-0.161)#4,887 |
| 82. | Olivet | 0.32 | 0.48(-0.157)#82 | 0.48(-0.159)#5,085 |
| 83. | Elmer Borough | 0.32 | 0.48(-0.157)#83 | 0.48(-0.158)#5,159 |
| 84. | Lakeside-Beebe Run | 0.33 | 0.48(-0.156)#84 | 0.48(-0.158)#5,185 |
| 85. | Bargaintown | 0.33 | 0.48(-0.156)#85 | 0.48(-0.158)#5,187 |
| 86. | Waretown | 0.33 | 0.48(-0.156)#86 | 0.48(-0.158)#5,191 |
| 87. | Johnsonburg | 0.33 | 0.48(-0.156)#87 | 0.48(-0.158)#5,196 |
| 88. | Elwood | 0.33 | 0.48(-0.155)#88 | 0.48(-0.157)#5,276 |
| 89. | Richland | 0.33 | 0.48(-0.154)#89 | 0.48(-0.156)#5,326 |
| 90. | Beach Haven West | 0.33 | 0.48(-0.154)#90 | 0.48(-0.156)#5,341 |
| 91. | Griggstown | 0.33 | 0.48(-0.152)#91 | 0.48(-0.153)#5,573 |
| 92. | Erma | 0.33 | 0.48(-0.150)#92 | 0.48(-0.151)#5,734 |
| 93. | Wanamassa | 0.33 | 0.48(-0.148)#93 | 0.48(-0.150)#5,873 |
| 94. | Dorchester | 0.33 | 0.48(-0.148)#94 | 0.48(-0.150)#5,889 |
| 95. | Ramtown | 0.33 | 0.48(-0.147)#95 | 0.48(-0.149)#5,965 |
| 96. | Cookstown | 0.33 | 0.48(-0.147)#96 | 0.48(-0.149)#6,013 |
| 97. | Roadstown | 0.33 | 0.48(-0.146)#97 | 0.48(-0.148)#6,066 |
| 98. | Kingston Estates | 0.34 | 0.48(-0.146)#98 | 0.48(-0.148)#6,084 |
| 99. | Harlingen | 0.34 | 0.48(-0.146)#99 | 0.48(-0.148)#6,095 |
| 100. | Mountain Lake | 0.34 | 0.48(-0.145)#100 | 0.48(-0.147)#6,150 |
Common Questions
What are the Top 10 Cities with the Lowest Inequality / Gini Index in New Jersey?
Top 10 Cities with the Lowest Inequality / Gini Index in New Jersey are:
#1
0.07
#2
0.11
#3
0.15
#4
0.16
#5
0.17
#6
0.18
#7
0.19
#8
0.21
#9
0.21
#10
0.22
What city has the Lowest Inequality / Gini Index in New Jersey?
Clyde has the Lowest Inequality / Gini Index in New Jersey with 0.07.
What is the Inequality / Gini Index in the State of New Jersey?
Inequality / Gini Index in New Jersey is 0.48.
What is the Inequality / Gini Index in the United States?
Inequality / Gini Index in the United States is 0.48.