Belle Mead, NJ Map & Demographics
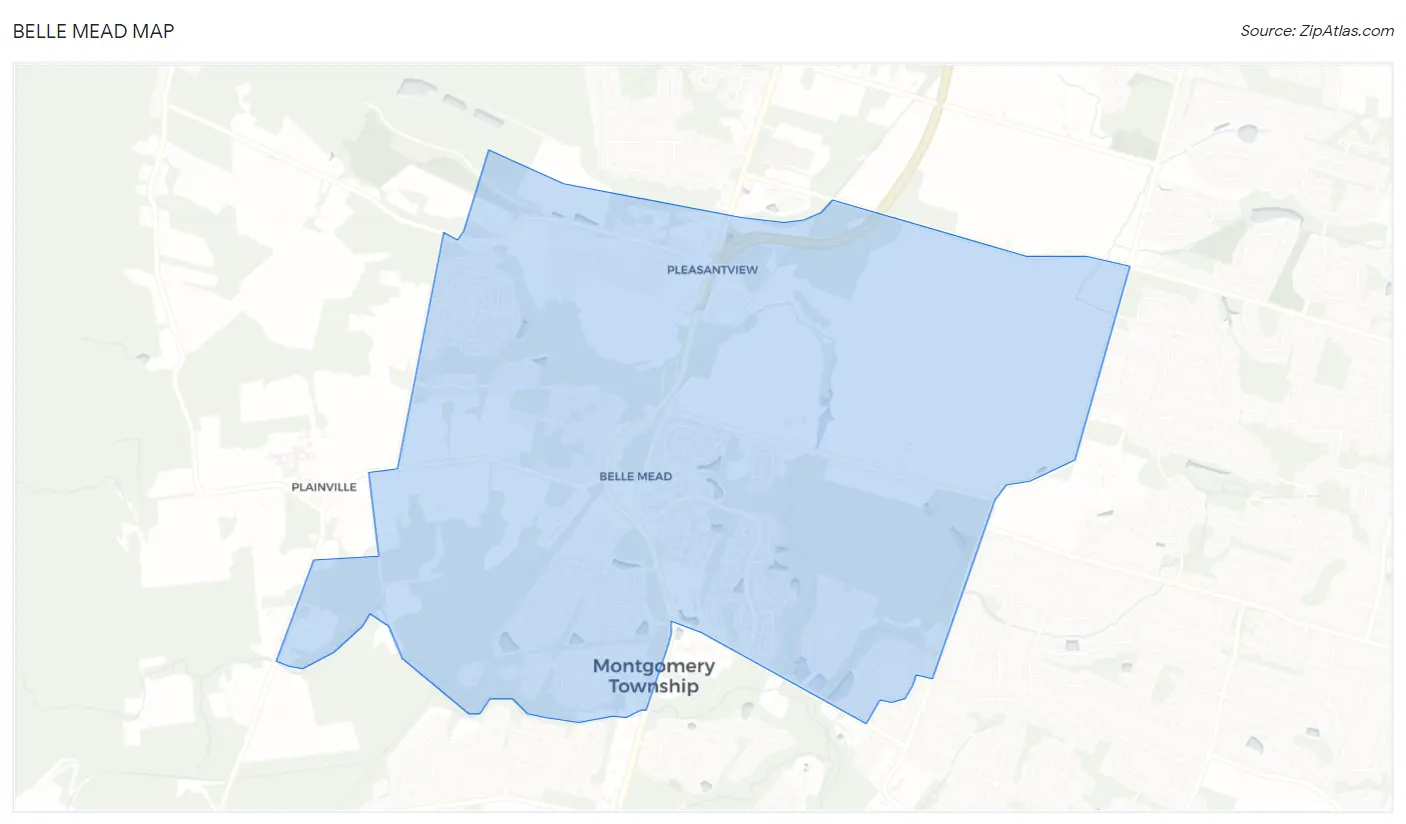
Belle Mead Map
Belle Mead Overview
$67,106
PER CAPITA INCOME
$213,125
AVG FAMILY INCOME
$203,942
AVG HOUSEHOLD INCOME
49.9%
WAGE / INCOME GAP [ % ]
50.1¢/ $1
WAGE / INCOME GAP [ $ ]
0.35
INEQUALITY / GINI INDEX
5,867
TOTAL POPULATION
3,023
MALE POPULATION
2,844
FEMALE POPULATION
106.29
MALES / 100 FEMALES
94.08
FEMALES / 100 MALES
35.9
MEDIAN AGE
3.4
AVG FAMILY SIZE
3.1
AVG HOUSEHOLD SIZE
3,166
LABOR FORCE [ PEOPLE ]
77.3%
PERCENT IN LABOR FORCE
3.0%
UNEMPLOYMENT RATE
Belle Mead Zip Codes
Belle Mead Area Codes
Income in Belle Mead
Income Overview in Belle Mead
Per Capita Income in Belle Mead is $67,106, while median incomes of families and households are $213,125 and $203,942 respectively.
| Characteristic | Number | Measure |
| Per Capita Income | 5,867 | $67,106 |
| Median Family Income | 1,601 | $213,125 |
| Mean Family Income | 1,601 | $224,664 |
| Median Household Income | 1,897 | $203,942 |
| Mean Household Income | 1,897 | $206,839 |
| Income Deficit | 1,601 | $0 |
| Wage / Income Gap (%) | 5,867 | 49.87% |
| Wage / Income Gap ($) | 5,867 | 50.13¢ per $1 |
| Gini / Inequality Index | 5,867 | 0.35 |
Earnings by Sex in Belle Mead
Average Earnings in Belle Mead are $102,750, $133,125 for men and $66,734 for women, a difference of 49.9%.
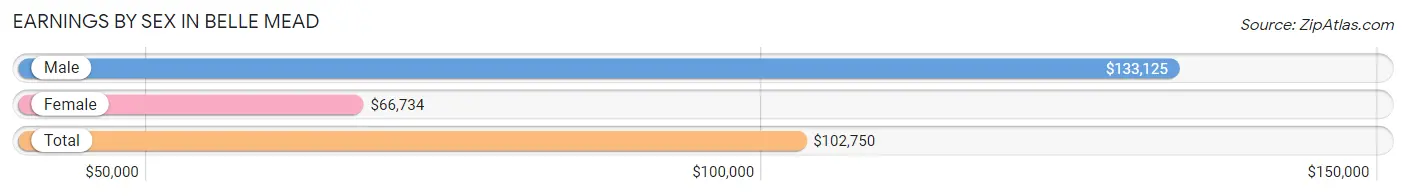
| Sex | Number | Average Earnings |
| Male | 1,766 (56.1%) | $133,125 |
| Female | 1,383 (43.9%) | $66,734 |
| Total | 3,149 (100.0%) | $102,750 |
Earnings by Sex by Income Bracket in Belle Mead
The most common earnings brackets in Belle Mead are $100,000+ for men (1,125 | 63.7%) and $100,000+ for women (493 | 35.6%).
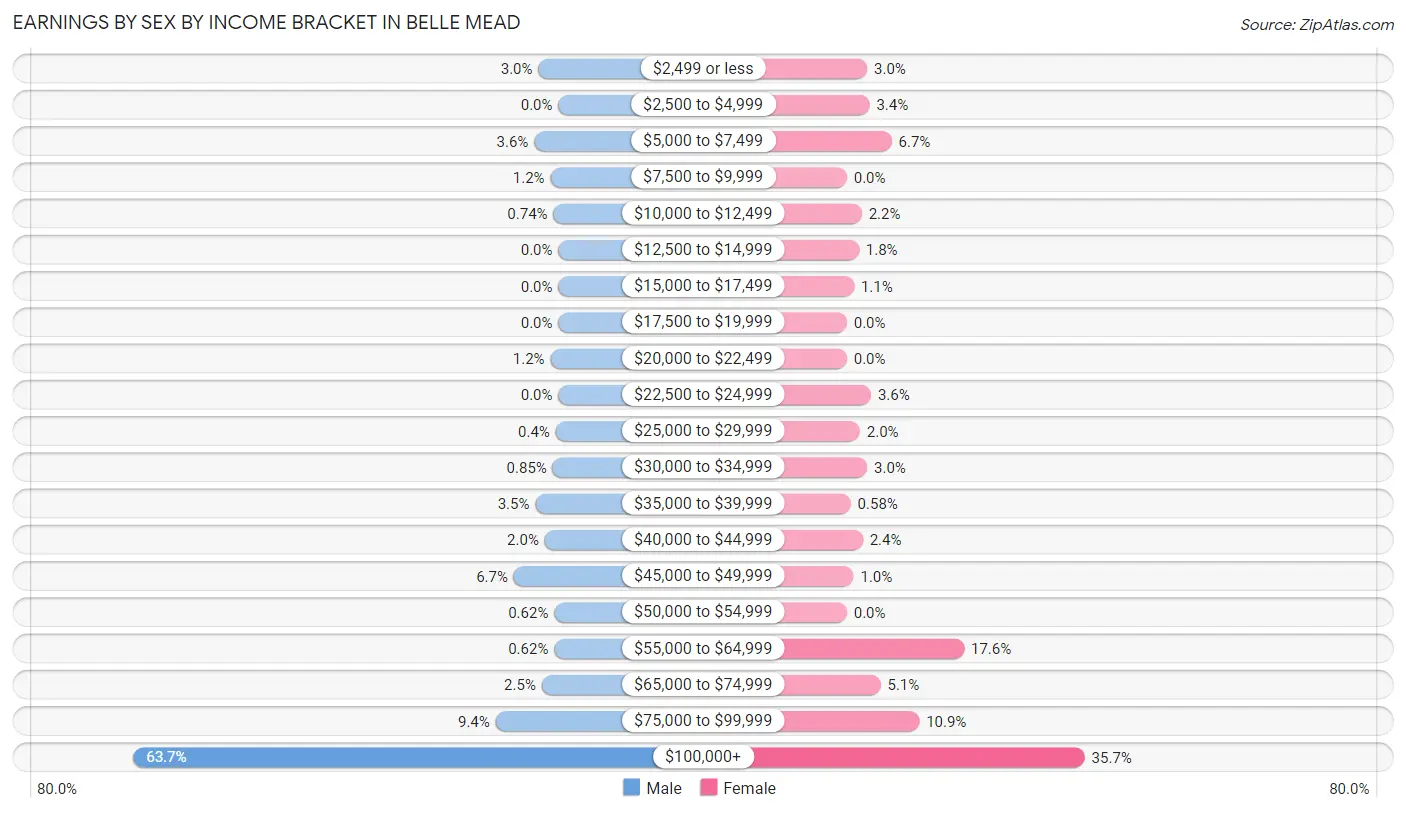
| Income | Male | Female |
| $2,499 or less | 53 (3.0%) | 42 (3.0%) |
| $2,500 to $4,999 | 0 (0.0%) | 47 (3.4%) |
| $5,000 to $7,499 | 64 (3.6%) | 93 (6.7%) |
| $7,500 to $9,999 | 21 (1.2%) | 0 (0.0%) |
| $10,000 to $12,499 | 13 (0.7%) | 31 (2.2%) |
| $12,500 to $14,999 | 0 (0.0%) | 25 (1.8%) |
| $15,000 to $17,499 | 0 (0.0%) | 15 (1.1%) |
| $17,500 to $19,999 | 0 (0.0%) | 0 (0.0%) |
| $20,000 to $22,499 | 21 (1.2%) | 0 (0.0%) |
| $22,500 to $24,999 | 0 (0.0%) | 50 (3.6%) |
| $25,000 to $29,999 | 7 (0.4%) | 27 (1.9%) |
| $30,000 to $34,999 | 15 (0.9%) | 42 (3.0%) |
| $35,000 to $39,999 | 61 (3.5%) | 8 (0.6%) |
| $40,000 to $44,999 | 36 (2.0%) | 33 (2.4%) |
| $45,000 to $49,999 | 118 (6.7%) | 14 (1.0%) |
| $50,000 to $54,999 | 11 (0.6%) | 0 (0.0%) |
| $55,000 to $64,999 | 11 (0.6%) | 243 (17.6%) |
| $65,000 to $74,999 | 44 (2.5%) | 70 (5.1%) |
| $75,000 to $99,999 | 166 (9.4%) | 150 (10.8%) |
| $100,000+ | 1,125 (63.7%) | 493 (35.6%) |
| Total | 1,766 (100.0%) | 1,383 (100.0%) |
Earnings by Sex by Educational Attainment in Belle Mead
Average earnings in Belle Mead are $152,669 for men and $71,218 for women, a difference of 53.3%. Men with an educational attainment of graduate degree enjoy the highest average annual earnings of $171,601, while those with college or associate's degree education earn the least with $49,069. Women with an educational attainment of graduate degree earn the most with the average annual earnings of $126,611, while those with college or associate's degree education have the smallest earnings of $58,115.
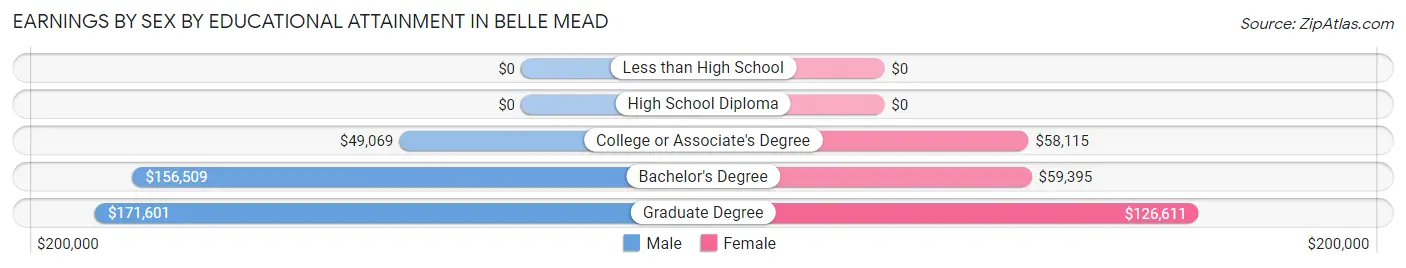
| Educational Attainment | Male Income | Female Income |
| Less than High School | - | - |
| High School Diploma | - | - |
| College or Associate's Degree | $49,069 | $58,115 |
| Bachelor's Degree | $156,509 | $59,395 |
| Graduate Degree | $171,601 | $126,611 |
| Total | $152,669 | $71,218 |
Family Income in Belle Mead
Family Income Brackets in Belle Mead
According to the Belle Mead family income data, there are 935 families falling into the $200,000+ income range, which is the most common income bracket and makes up 58.4% of all families.
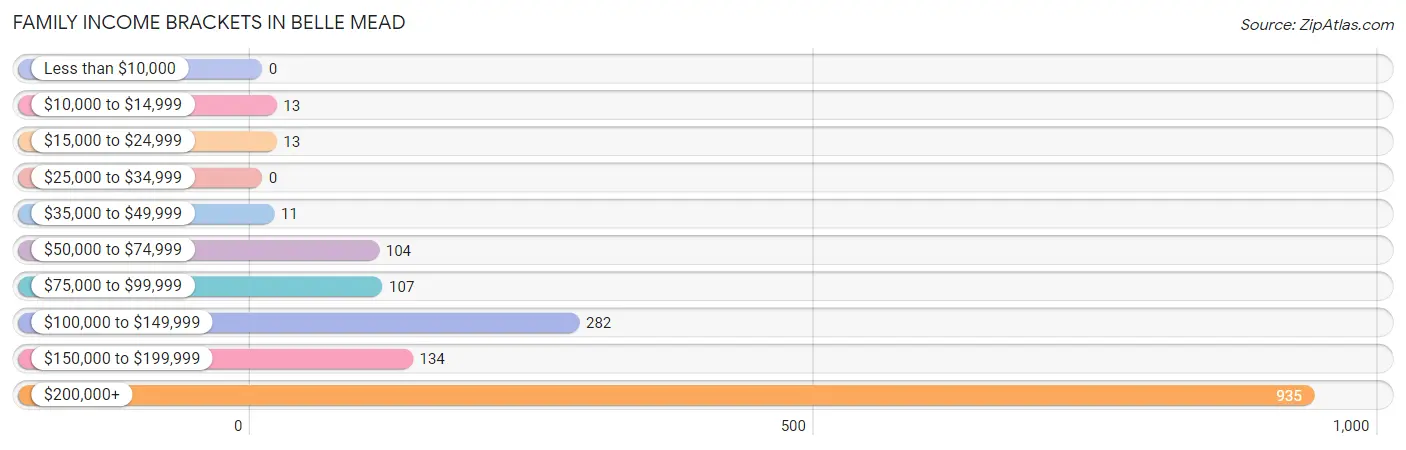
| Income Bracket | # Families | % Families |
| Less than $10,000 | 0 | 0.0% |
| $10,000 to $14,999 | 13 | 0.8% |
| $15,000 to $24,999 | 13 | 0.8% |
| $25,000 to $34,999 | 0 | 0.0% |
| $35,000 to $49,999 | 11 | 0.7% |
| $50,000 to $74,999 | 104 | 6.5% |
| $75,000 to $99,999 | 107 | 6.7% |
| $100,000 to $149,999 | 282 | 17.6% |
| $150,000 to $199,999 | 134 | 8.4% |
| $200,000+ | 935 | 58.4% |
Family Income by Famaliy Size in Belle Mead
5-person families (31 | 1.9%) account for the highest median family income in Belle Mead with $250,001 per family, while 2-person families (306 | 19.1%) have the highest median income of $75,125 per family member.
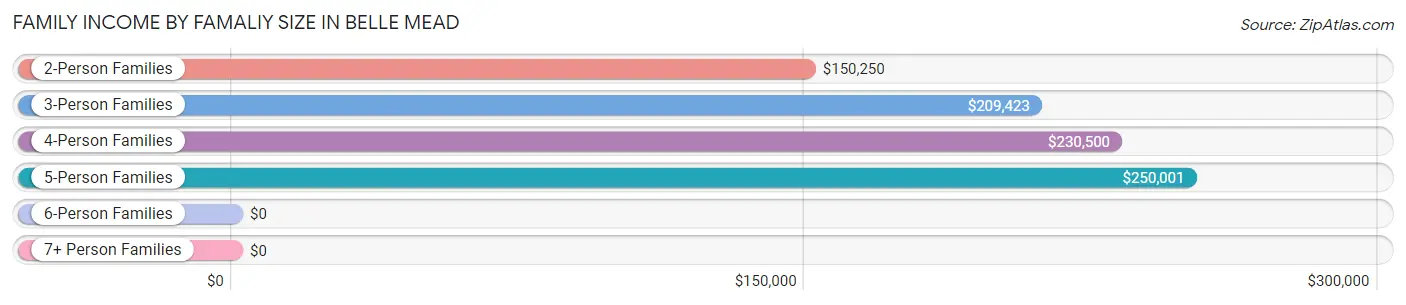
| Income Bracket | # Families | Median Income |
| 2-Person Families | 306 (19.1%) | $150,250 |
| 3-Person Families | 522 (32.6%) | $209,423 |
| 4-Person Families | 742 (46.4%) | $230,500 |
| 5-Person Families | 31 (1.9%) | $250,001 |
| 6-Person Families | 0 (0.0%) | $0 |
| 7+ Person Families | 0 (0.0%) | $0 |
| Total | 1,601 (100.0%) | $213,125 |
Family Income by Number of Earners in Belle Mead
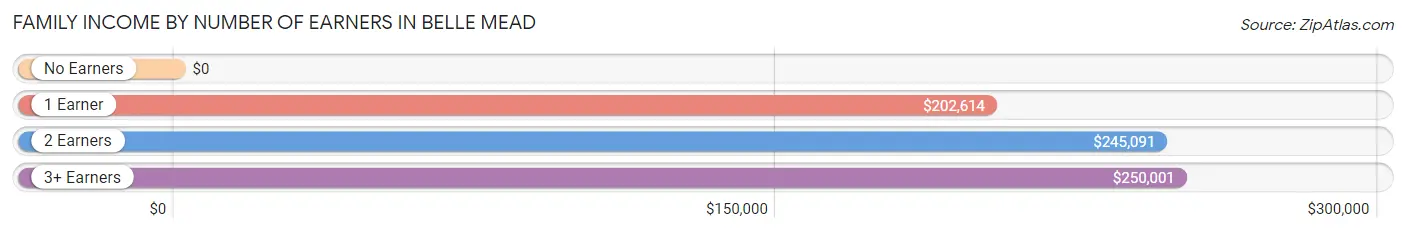
| Number of Earners | # Families | Median Income |
| No Earners | 52 (3.3%) | $0 |
| 1 Earner | 477 (29.8%) | $202,614 |
| 2 Earners | 973 (60.8%) | $245,091 |
| 3+ Earners | 99 (6.2%) | $250,001 |
| Total | 1,601 (100.0%) | $213,125 |
Household Income in Belle Mead
Household Income Brackets in Belle Mead
With 986 households falling in the category, the $200,000+ income range is the most frequent in Belle Mead, accounting for 52.0% of all households.
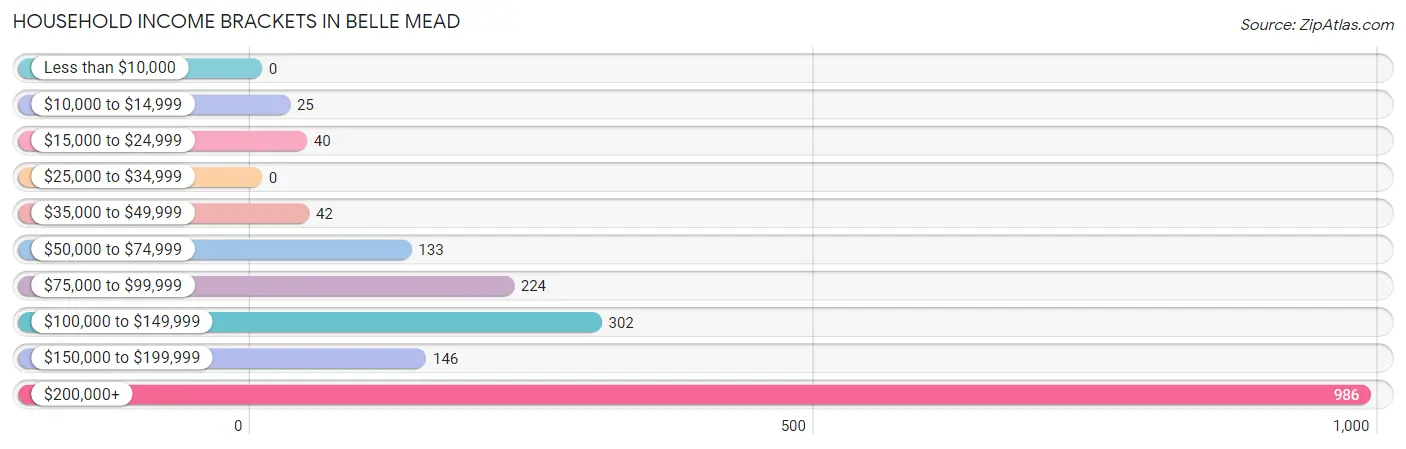
| Income Bracket | # Households | % Households |
| Less than $10,000 | 0 | 0.0% |
| $10,000 to $14,999 | 25 | 1.3% |
| $15,000 to $24,999 | 40 | 2.1% |
| $25,000 to $34,999 | 0 | 0.0% |
| $35,000 to $49,999 | 42 | 2.2% |
| $50,000 to $74,999 | 133 | 7.0% |
| $75,000 to $99,999 | 224 | 11.8% |
| $100,000 to $149,999 | 302 | 15.9% |
| $150,000 to $199,999 | 146 | 7.7% |
| $200,000+ | 986 | 52.0% |
Household Income by Householder Age in Belle Mead
The median household income in Belle Mead is $203,942, with the highest median household income of $209,462 found in the 45 to 64 years age bracket for the primary householder. A total of 914 households (48.2%) fall into this category. Meanwhile, the 15 to 24 years age bracket for the primary householder has the lowest median household income of $0, with 16 households (0.8%) in this group.
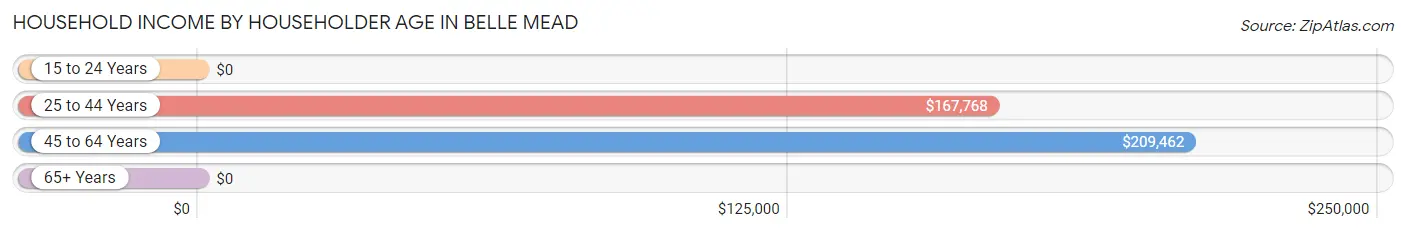
| Income Bracket | # Households | Median Income |
| 15 to 24 Years | 16 (0.8%) | $0 |
| 25 to 44 Years | 771 (40.6%) | $167,768 |
| 45 to 64 Years | 914 (48.2%) | $209,462 |
| 65+ Years | 196 (10.3%) | $0 |
| Total | 1,897 (100.0%) | $203,942 |
Poverty in Belle Mead
Income Below Poverty by Sex and Age in Belle Mead
With 4.0% poverty level for males and 2.5% for females among the residents of Belle Mead, 45 to 54 year old males and 75 year old and over females are the most vulnerable to poverty, with 71 males (11.4%) and 21 females (16.2%) in their respective age groups living below the poverty level.
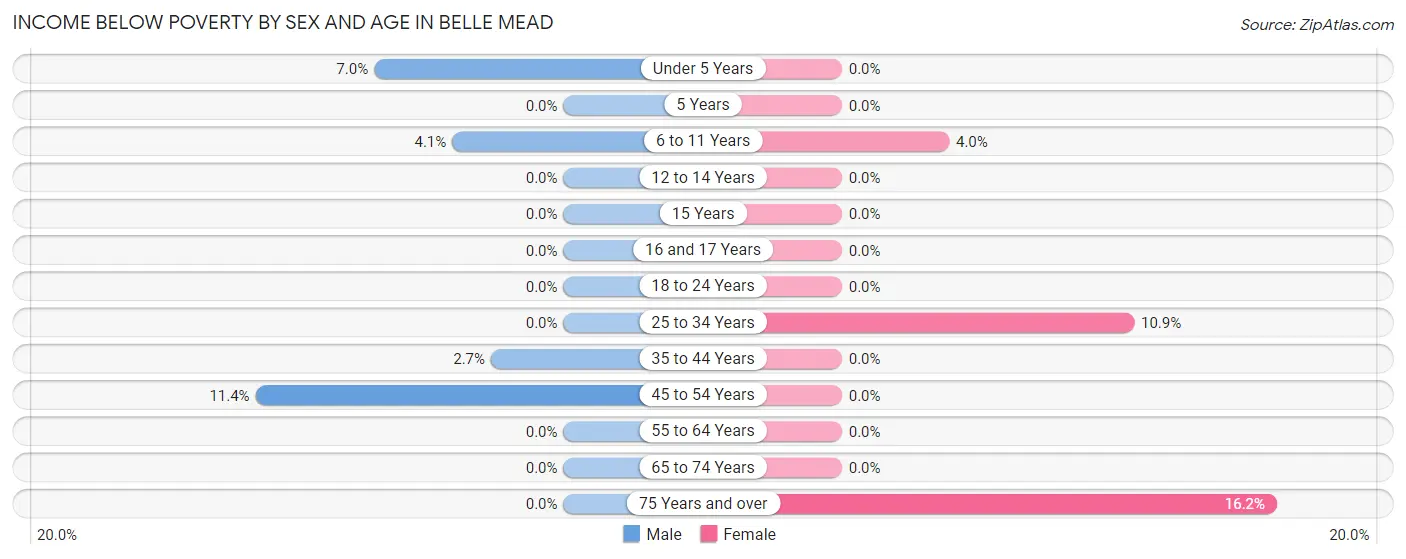
| Age Bracket | Male | Female |
| Under 5 Years | 22 (7.0%) | 0 (0.0%) |
| 5 Years | 0 (0.0%) | 0 (0.0%) |
| 6 to 11 Years | 14 (4.1%) | 14 (4.0%) |
| 12 to 14 Years | 0 (0.0%) | 0 (0.0%) |
| 15 Years | 0 (0.0%) | 0 (0.0%) |
| 16 and 17 Years | 0 (0.0%) | 0 (0.0%) |
| 18 to 24 Years | 0 (0.0%) | 0 (0.0%) |
| 25 to 34 Years | 0 (0.0%) | 37 (10.8%) |
| 35 to 44 Years | 13 (2.7%) | 0 (0.0%) |
| 45 to 54 Years | 71 (11.4%) | 0 (0.0%) |
| 55 to 64 Years | 0 (0.0%) | 0 (0.0%) |
| 65 to 74 Years | 0 (0.0%) | 0 (0.0%) |
| 75 Years and over | 0 (0.0%) | 21 (16.2%) |
| Total | 120 (4.0%) | 72 (2.5%) |
Income Above Poverty by Sex and Age in Belle Mead
According to the poverty statistics in Belle Mead, males aged 5 years and females aged under 5 years are the age groups that are most secure financially, with 100.0% of males and 100.0% of females in these age groups living above the poverty line.
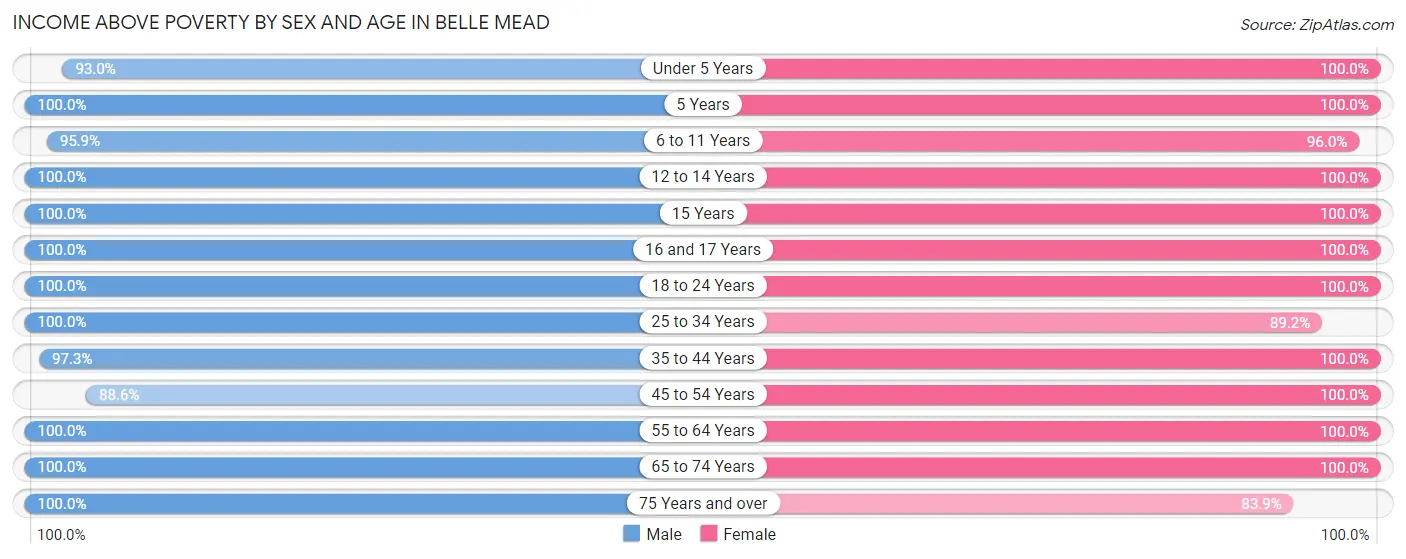
| Age Bracket | Male | Female |
| Under 5 Years | 291 (93.0%) | 79 (100.0%) |
| 5 Years | 62 (100.0%) | 82 (100.0%) |
| 6 to 11 Years | 325 (95.9%) | 338 (96.0%) |
| 12 to 14 Years | 161 (100.0%) | 272 (100.0%) |
| 15 Years | 76 (100.0%) | 35 (100.0%) |
| 16 and 17 Years | 93 (100.0%) | 48 (100.0%) |
| 18 to 24 Years | 165 (100.0%) | 121 (100.0%) |
| 25 to 34 Years | 315 (100.0%) | 304 (89.1%) |
| 35 to 44 Years | 471 (97.3%) | 708 (100.0%) |
| 45 to 54 Years | 550 (88.6%) | 327 (100.0%) |
| 55 to 64 Years | 222 (100.0%) | 258 (100.0%) |
| 65 to 74 Years | 139 (100.0%) | 91 (100.0%) |
| 75 Years and over | 33 (100.0%) | 109 (83.9%) |
| Total | 2,903 (96.0%) | 2,772 (97.5%) |
Income Below Poverty Among Married-Couple Families in Belle Mead
The poverty statistics for married-couple families in Belle Mead show that 0.9% or 13 of the total 1,477 families live below the poverty line. Families with 1 or 2 children have the highest poverty rate of 1.2%, comprising of 13 families. On the other hand, families with no children have the lowest poverty rate of 0.0%, which includes 0 families.
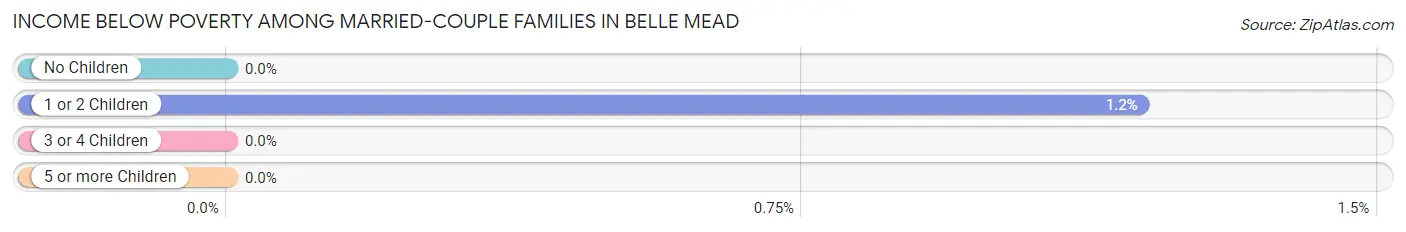
| Children | Above Poverty | Below Poverty |
| No Children | 386 (100.0%) | 0 (0.0%) |
| 1 or 2 Children | 1,078 (98.8%) | 13 (1.2%) |
| 3 or 4 Children | 0 (0.0%) | 0 (0.0%) |
| 5 or more Children | 0 (0.0%) | 0 (0.0%) |
| Total | 1,464 (99.1%) | 13 (0.9%) |
Income Below Poverty Among Single-Parent Households in Belle Mead
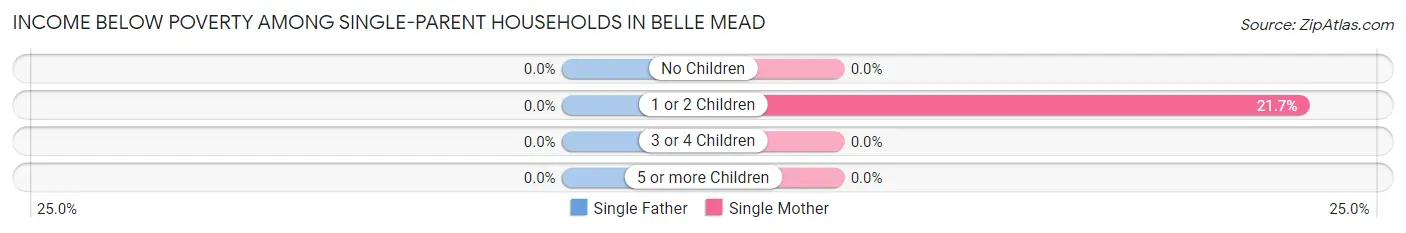
| Children | Single Father | Single Mother |
| No Children | 0 (0.0%) | 0 (0.0%) |
| 1 or 2 Children | 0 (0.0%) | 13 (21.7%) |
| 3 or 4 Children | 0 (0.0%) | 0 (0.0%) |
| 5 or more Children | 0 (0.0%) | 0 (0.0%) |
| Total | 0 (0.0%) | 13 (11.2%) |
Income Below Poverty Among Married-Couple vs Single-Parent Households in Belle Mead
The poverty data for Belle Mead shows that 13 of the married-couple family households (0.9%) and 13 of the single-parent households (10.5%) are living below the poverty level. Within the married-couple family households, those with 1 or 2 children have the highest poverty rate, with 13 households (1.2%) falling below the poverty line. Among the single-parent households, those with 1 or 2 children have the highest poverty rate, with 13 household (19.1%) living below poverty.
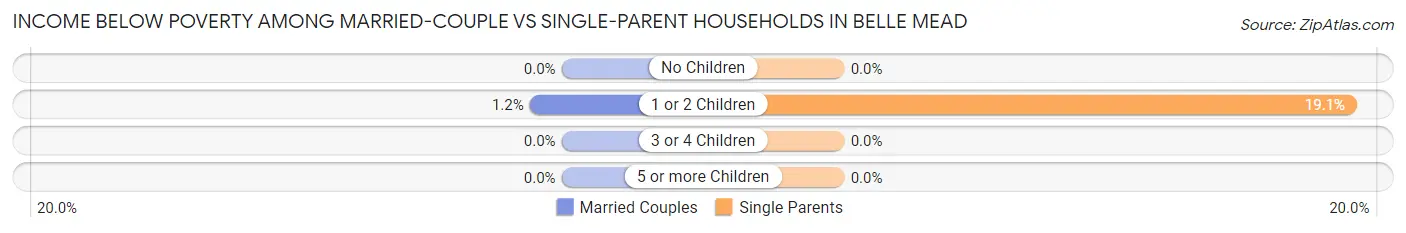
| Children | Married-Couple Families | Single-Parent Households |
| No Children | 0 (0.0%) | 0 (0.0%) |
| 1 or 2 Children | 13 (1.2%) | 13 (19.1%) |
| 3 or 4 Children | 0 (0.0%) | 0 (0.0%) |
| 5 or more Children | 0 (0.0%) | 0 (0.0%) |
| Total | 13 (0.9%) | 13 (10.5%) |
Race in Belle Mead
The most populous races in Belle Mead are Asian (3,700 | 63.1%), White / Caucasian (1,918 | 32.7%), and Hispanic or Latino (222 | 3.8%).
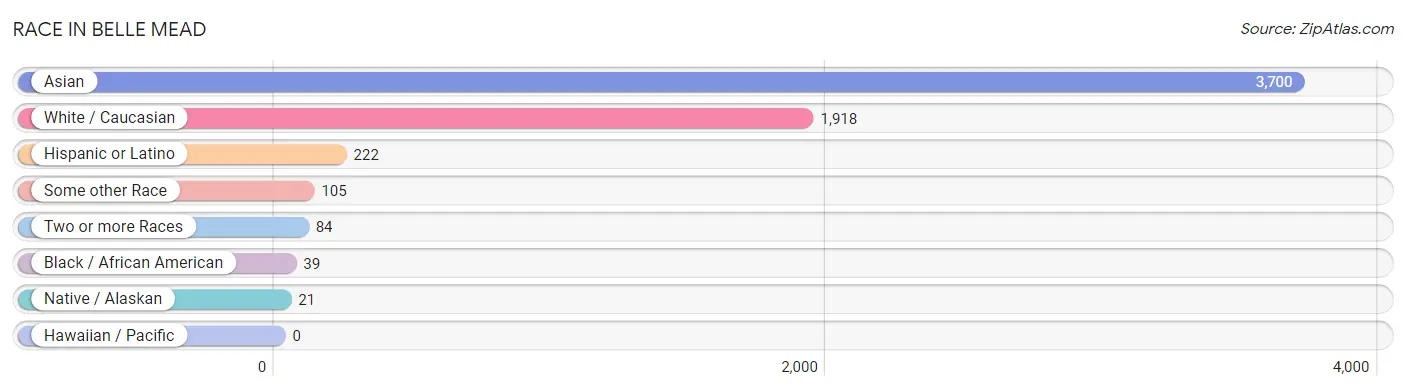
| Race | # Population | % Population |
| Asian | 3,700 | 63.1% |
| Black / African American | 39 | 0.7% |
| Hawaiian / Pacific | 0 | 0.0% |
| Hispanic or Latino | 222 | 3.8% |
| Native / Alaskan | 21 | 0.4% |
| White / Caucasian | 1,918 | 32.7% |
| Two or more Races | 84 | 1.4% |
| Some other Race | 105 | 1.8% |
| Total | 5,867 | 100.0% |
Ancestry in Belle Mead
The most populous ancestries reported in Belle Mead are Thai (2,751 | 46.9%), Indian (Asian) (757 | 12.9%), German (533 | 9.1%), Italian (434 | 7.4%), and Dutch (321 | 5.5%), together accounting for 81.7% of all Belle Mead residents.
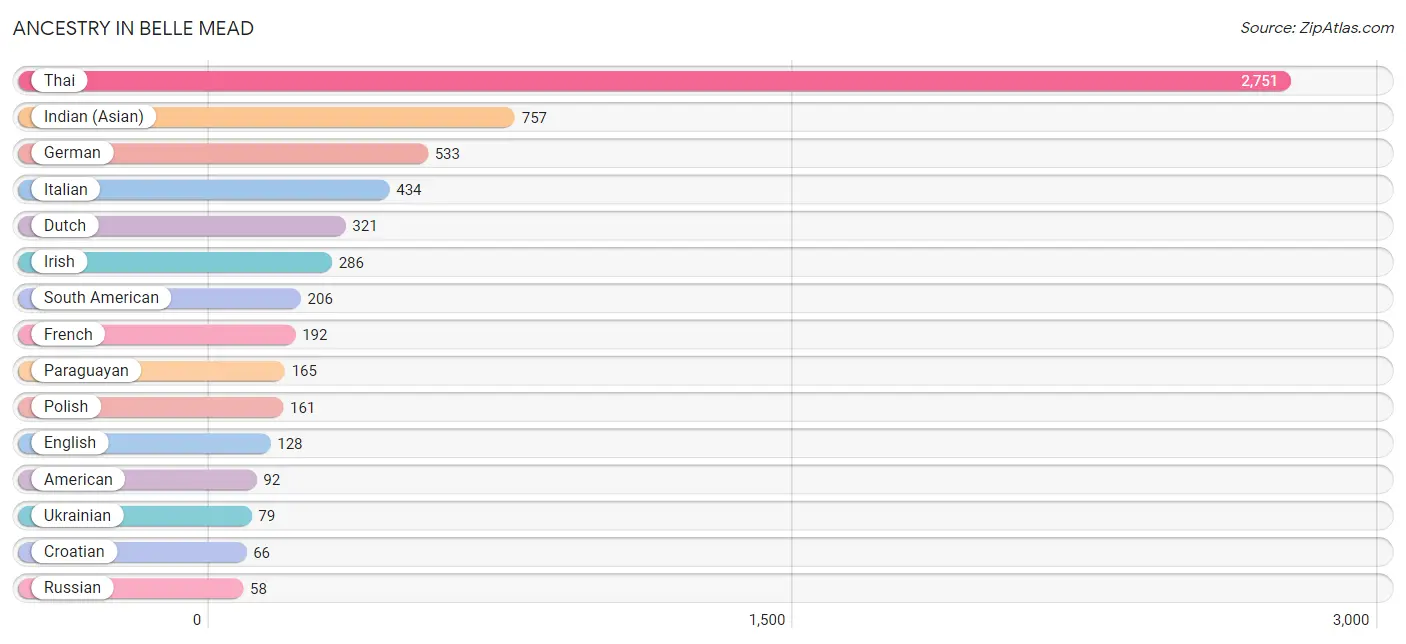
| Ancestry | # Population | % Population |
| American | 92 | 1.6% |
| Arab | 14 | 0.2% |
| Bhutanese | 25 | 0.4% |
| Brazilian | 35 | 0.6% |
| Burmese | 47 | 0.8% |
| Croatian | 66 | 1.1% |
| Czechoslovakian | 13 | 0.2% |
| Dutch | 321 | 5.5% |
| English | 128 | 2.2% |
| French | 192 | 3.3% |
| German | 533 | 9.1% |
| Ghanaian | 13 | 0.2% |
| Hungarian | 9 | 0.2% |
| Indian (Asian) | 757 | 12.9% |
| Irish | 286 | 4.9% |
| Italian | 434 | 7.4% |
| Jamaican | 22 | 0.4% |
| Lebanese | 14 | 0.2% |
| Norwegian | 14 | 0.2% |
| Paraguayan | 165 | 2.8% |
| Peruvian | 41 | 0.7% |
| Polish | 161 | 2.7% |
| Portuguese | 54 | 0.9% |
| Puerto Rican | 16 | 0.3% |
| Russian | 58 | 1.0% |
| Samoan | 22 | 0.4% |
| Scandinavian | 12 | 0.2% |
| Scottish | 49 | 0.8% |
| Slovak | 9 | 0.2% |
| South American | 206 | 3.5% |
| Sri Lankan | 9 | 0.2% |
| Subsaharan African | 13 | 0.2% |
| Swedish | 25 | 0.4% |
| Thai | 2,751 | 46.9% |
| Ukrainian | 79 | 1.3% | View All 35 Rows |
Immigrants in Belle Mead
The most numerous immigrant groups reported in Belle Mead came from Asia (2,309 | 39.4%), India (1,740 | 29.7%), South Central Asia (1,740 | 29.7%), Eastern Asia (517 | 8.8%), and China (485 | 8.3%), together accounting for 115.8% of all Belle Mead residents.
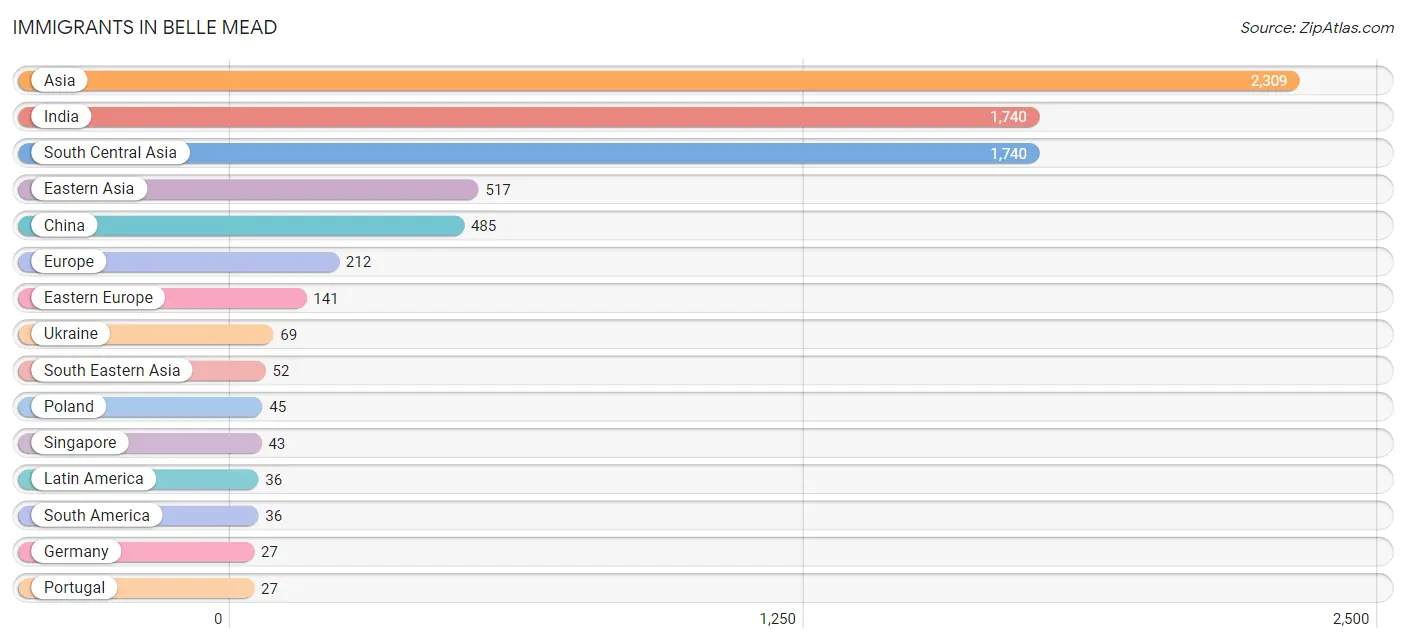
| Immigration Origin | # Population | % Population |
| Asia | 2,309 | 39.4% |
| Brazil | 15 | 0.3% |
| Canada | 21 | 0.4% |
| China | 485 | 8.3% |
| Eastern Asia | 517 | 8.8% |
| Eastern Europe | 141 | 2.4% |
| Europe | 212 | 3.6% |
| Germany | 27 | 0.5% |
| India | 1,740 | 29.7% |
| Japan | 10 | 0.2% |
| Korea | 22 | 0.4% |
| Latin America | 36 | 0.6% |
| Northern Europe | 17 | 0.3% |
| Peru | 21 | 0.4% |
| Poland | 45 | 0.8% |
| Portugal | 27 | 0.5% |
| Russia | 14 | 0.2% |
| Singapore | 43 | 0.7% |
| South America | 36 | 0.6% |
| South Central Asia | 1,740 | 29.7% |
| South Eastern Asia | 52 | 0.9% |
| Southern Europe | 27 | 0.5% |
| Taiwan | 21 | 0.4% |
| Ukraine | 69 | 1.2% |
| Vietnam | 9 | 0.2% |
| Western Europe | 27 | 0.5% | View All 26 Rows |
Sex and Age in Belle Mead
Sex and Age in Belle Mead
The most populous age groups in Belle Mead are 10 to 14 Years (361 | 11.9%) for men and 40 to 44 Years (428 | 15.0%) for women.
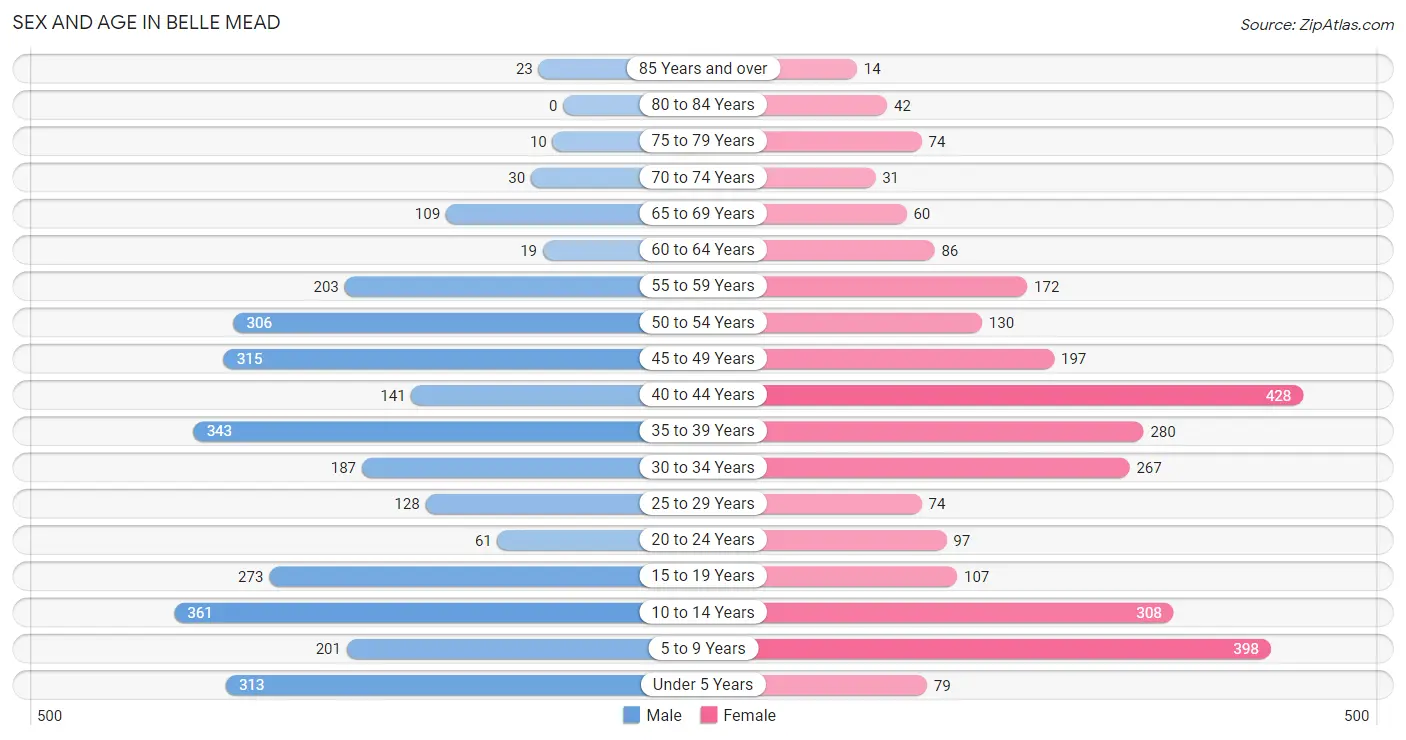
| Age Bracket | Male | Female |
| Under 5 Years | 313 (10.3%) | 79 (2.8%) |
| 5 to 9 Years | 201 (6.7%) | 398 (14.0%) |
| 10 to 14 Years | 361 (11.9%) | 308 (10.8%) |
| 15 to 19 Years | 273 (9.0%) | 107 (3.8%) |
| 20 to 24 Years | 61 (2.0%) | 97 (3.4%) |
| 25 to 29 Years | 128 (4.2%) | 74 (2.6%) |
| 30 to 34 Years | 187 (6.2%) | 267 (9.4%) |
| 35 to 39 Years | 343 (11.4%) | 280 (9.9%) |
| 40 to 44 Years | 141 (4.7%) | 428 (15.0%) |
| 45 to 49 Years | 315 (10.4%) | 197 (6.9%) |
| 50 to 54 Years | 306 (10.1%) | 130 (4.6%) |
| 55 to 59 Years | 203 (6.7%) | 172 (6.0%) |
| 60 to 64 Years | 19 (0.6%) | 86 (3.0%) |
| 65 to 69 Years | 109 (3.6%) | 60 (2.1%) |
| 70 to 74 Years | 30 (1.0%) | 31 (1.1%) |
| 75 to 79 Years | 10 (0.3%) | 74 (2.6%) |
| 80 to 84 Years | 0 (0.0%) | 42 (1.5%) |
| 85 Years and over | 23 (0.8%) | 14 (0.5%) |
| Total | 3,023 (100.0%) | 2,844 (100.0%) |
Families and Households in Belle Mead
Median Family Size in Belle Mead
The median family size in Belle Mead is 3.39 persons per family, with married-couple families (1,477 | 92.2%) accounting for the largest median family size of 3.44 persons per family. On the other hand, single male/father families (8 | 0.5%) represent the smallest median family size with 2.50 persons per family.
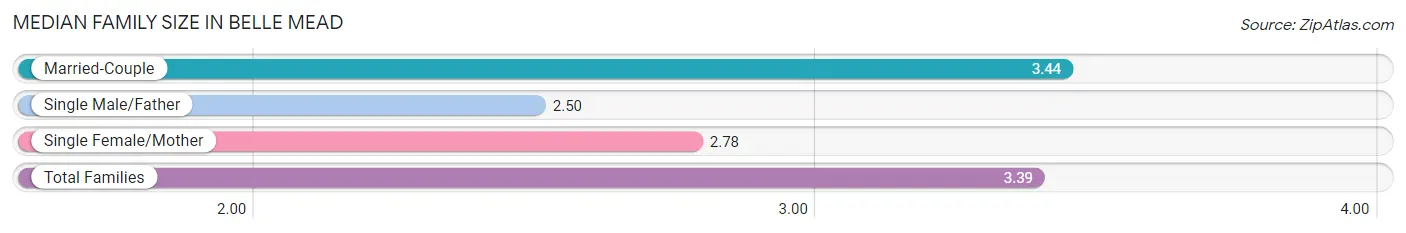
| Family Type | # Families | Family Size |
| Married-Couple | 1,477 (92.2%) | 3.44 |
| Single Male/Father | 8 (0.5%) | 2.50 |
| Single Female/Mother | 116 (7.2%) | 2.78 |
| Total Families | 1,601 (100.0%) | 3.39 |
Median Household Size in Belle Mead
The median household size in Belle Mead is 3.09 persons per household, with single male/father households (8 | 0.4%) accounting for the largest median household size of 4 persons per household. non-family households (296 | 15.6%) represent the smallest median household size with 1.24 persons per household.
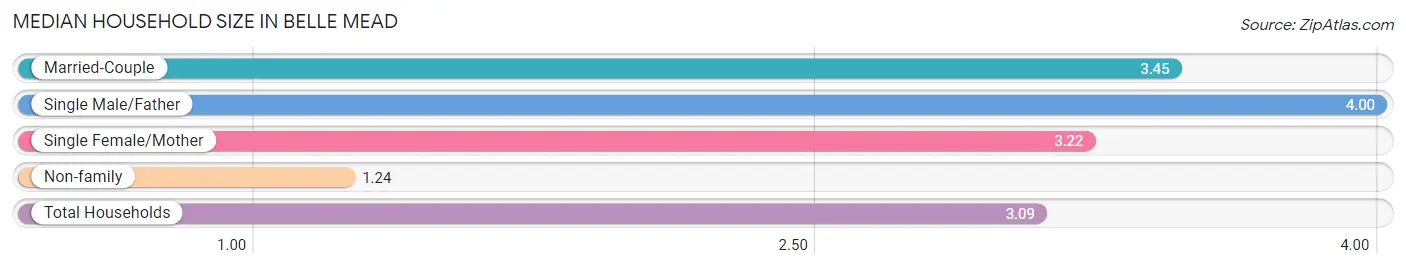
| Household Type | # Households | Household Size |
| Married-Couple | 1,477 (77.9%) | 3.45 |
| Single Male/Father | 8 (0.4%) | 4.00 |
| Single Female/Mother | 116 (6.1%) | 3.22 |
| Non-family | 296 (15.6%) | 1.24 |
| Total Households | 1,897 (100.0%) | 3.09 |
Household Size by Marriage Status in Belle Mead
Out of a total of 1,897 households in Belle Mead, 1,601 (84.4%) are family households, while 296 (15.6%) are nonfamily households. The most numerous type of family households are 4-person households, comprising 740, and the most common type of nonfamily households are 1-person households, comprising 243.
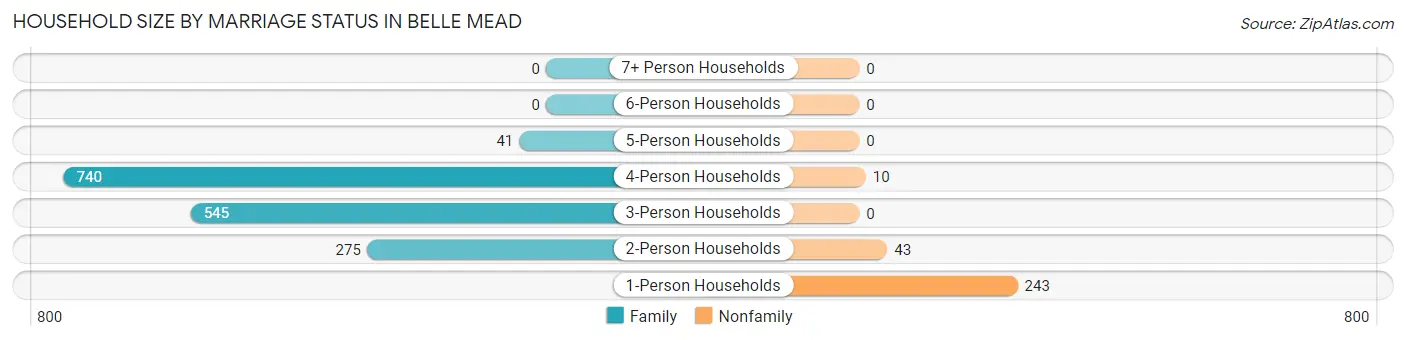
| Household Size | Family Households | Nonfamily Households |
| 1-Person Households | - | 243 (12.8%) |
| 2-Person Households | 275 (14.5%) | 43 (2.3%) |
| 3-Person Households | 545 (28.7%) | 0 (0.0%) |
| 4-Person Households | 740 (39.0%) | 10 (0.5%) |
| 5-Person Households | 41 (2.2%) | 0 (0.0%) |
| 6-Person Households | 0 (0.0%) | 0 (0.0%) |
| 7+ Person Households | 0 (0.0%) | 0 (0.0%) |
| Total | 1,601 (84.4%) | 296 (15.6%) |
Female Fertility in Belle Mead
Fertility by Age in Belle Mead
Average fertility rate in Belle Mead is 96.0 births per 1,000 women. Women in the age bracket of 35 to 50 years have the highest fertility rate with 154.0 births per 1,000 women. Women in the age bracket of 35 to 50 years acount for 100.0% of all women with births.
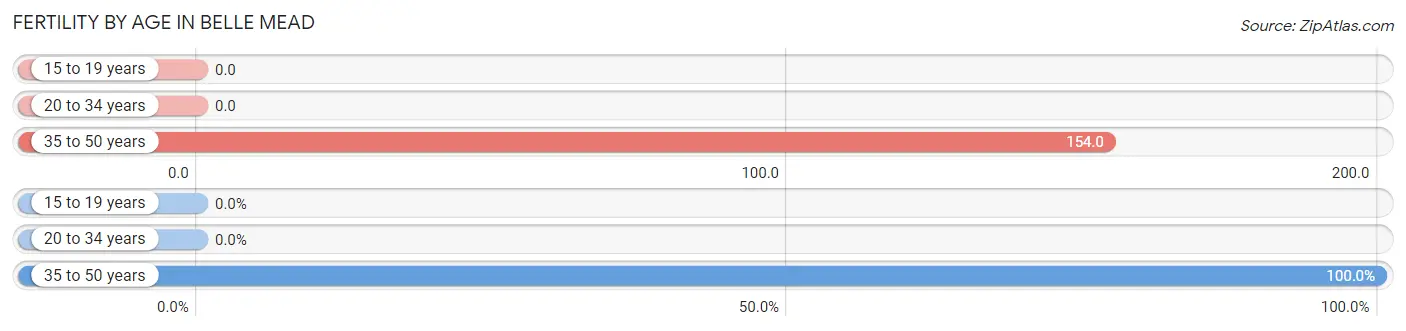
| Age Bracket | Women with Births | Births / 1,000 Women |
| 15 to 19 years | 0 (0.0%) | 0.0 |
| 20 to 34 years | 0 (0.0%) | 0.0 |
| 35 to 50 years | 139 (100.0%) | 154.0 |
| Total | 139 (100.0%) | 96.0 |
Fertility by Age by Marriage Status in Belle Mead
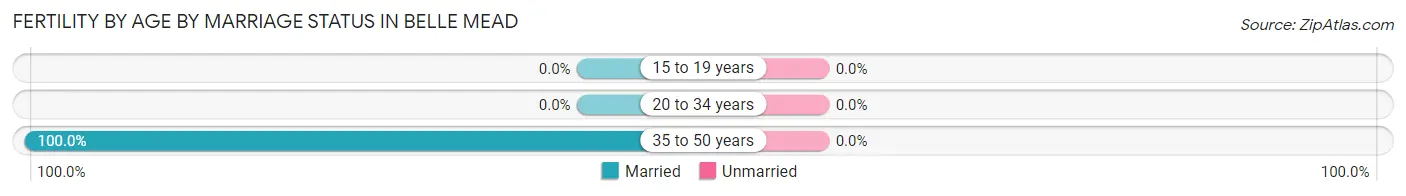
| Age Bracket | Married | Unmarried |
| 15 to 19 years | 0 (0.0%) | 0 (0.0%) |
| 20 to 34 years | 0 (0.0%) | 0 (0.0%) |
| 35 to 50 years | 139 (100.0%) | 0 (0.0%) |
| Total | 139 (100.0%) | 0 (0.0%) |
Fertility by Education in Belle Mead
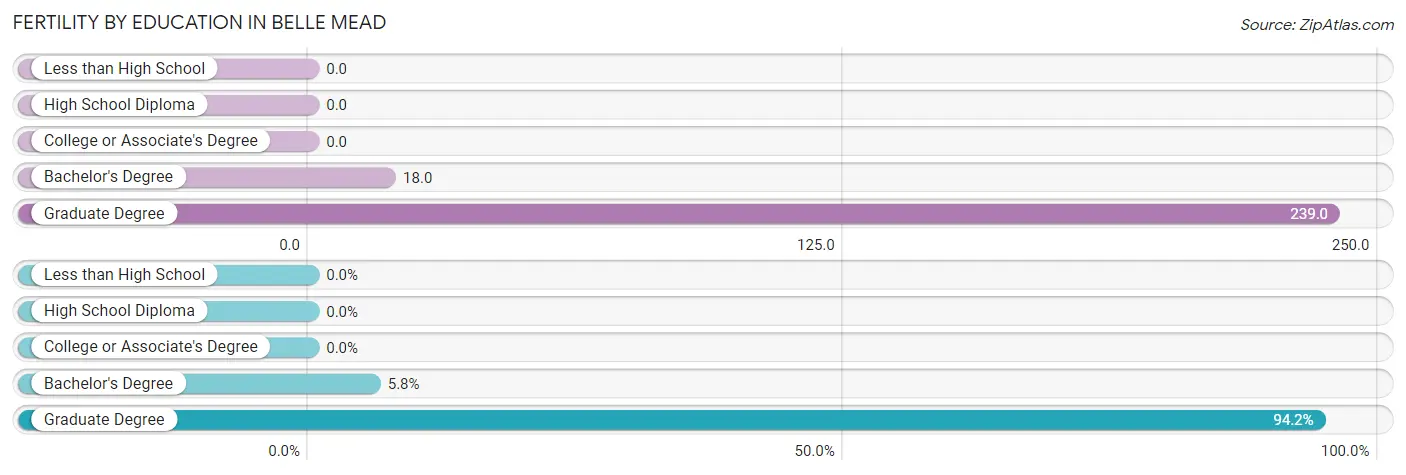
| Educational Attainment | Women with Births | Births / 1,000 Women |
| Less than High School | 0 (0.0%) | 0.0 |
| High School Diploma | 0 (0.0%) | 0.0 |
| College or Associate's Degree | 0 (0.0%) | 0.0 |
| Bachelor's Degree | 8 (5.8%) | 18.0 |
| Graduate Degree | 131 (94.2%) | 239.0 |
| Total | 139 (100.0%) | 96.0 |
Fertility by Education by Marriage Status in Belle Mead
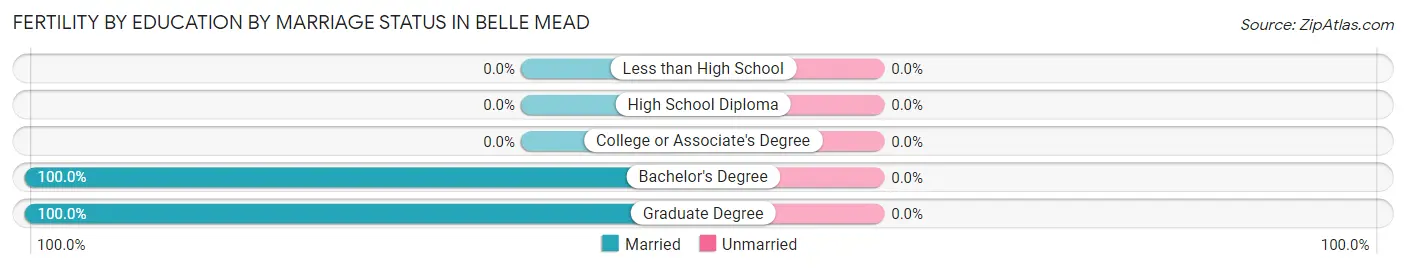
| Educational Attainment | Married | Unmarried |
| Less than High School | 0 (0.0%) | 0 (0.0%) |
| High School Diploma | 0 (0.0%) | 0 (0.0%) |
| College or Associate's Degree | 0 (0.0%) | 0 (0.0%) |
| Bachelor's Degree | 8 (100.0%) | 0 (0.0%) |
| Graduate Degree | 131 (100.0%) | 0 (0.0%) |
| Total | 139 (100.0%) | 0 (0.0%) |
Employment Characteristics in Belle Mead
Employment by Class of Employer in Belle Mead
Among the 3,036 employed individuals in Belle Mead, private company employees (2,301 | 75.8%), self-employed (incorporated) (331 | 10.9%), and not-for-profit organizations (177 | 5.8%) make up the most common classes of employment.
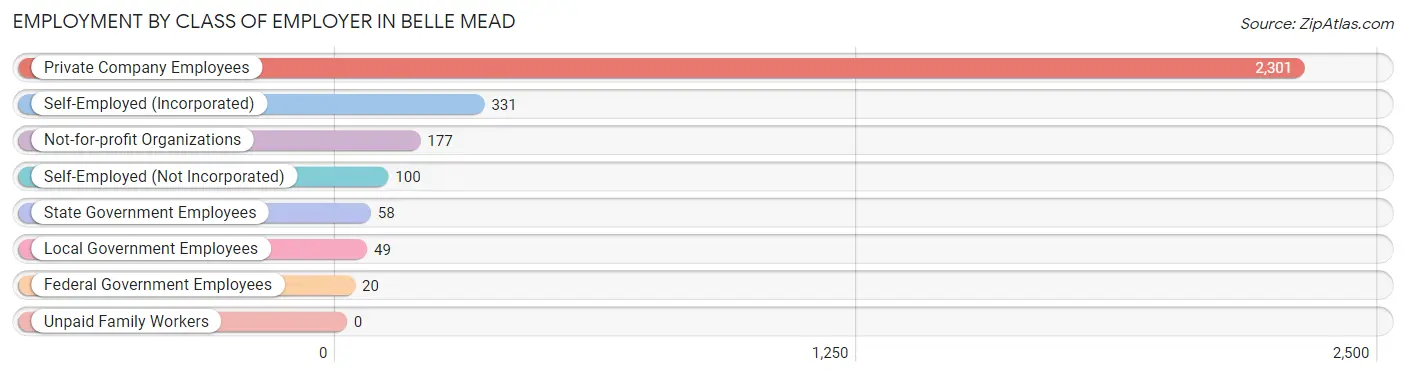
| Employer Class | # Employees | % Employees |
| Private Company Employees | 2,301 | 75.8% |
| Self-Employed (Incorporated) | 331 | 10.9% |
| Self-Employed (Not Incorporated) | 100 | 3.3% |
| Not-for-profit Organizations | 177 | 5.8% |
| Local Government Employees | 49 | 1.6% |
| State Government Employees | 58 | 1.9% |
| Federal Government Employees | 20 | 0.7% |
| Unpaid Family Workers | 0 | 0.0% |
| Total | 3,036 | 100.0% |
Employment Status by Age in Belle Mead
According to the labor force statistics for Belle Mead, out of the total population over 16 years of age (4,096), 77.3% or 3,166 individuals are in the labor force, with 3.0% or 95 of them unemployed. The age group with the highest labor force participation rate is 55 to 59 years, with 96.8% or 363 individuals in the labor force. Within the labor force, the 25 to 29 years age range has the highest percentage of unemployed individuals, with 31.3% or 56 of them being unemployed.
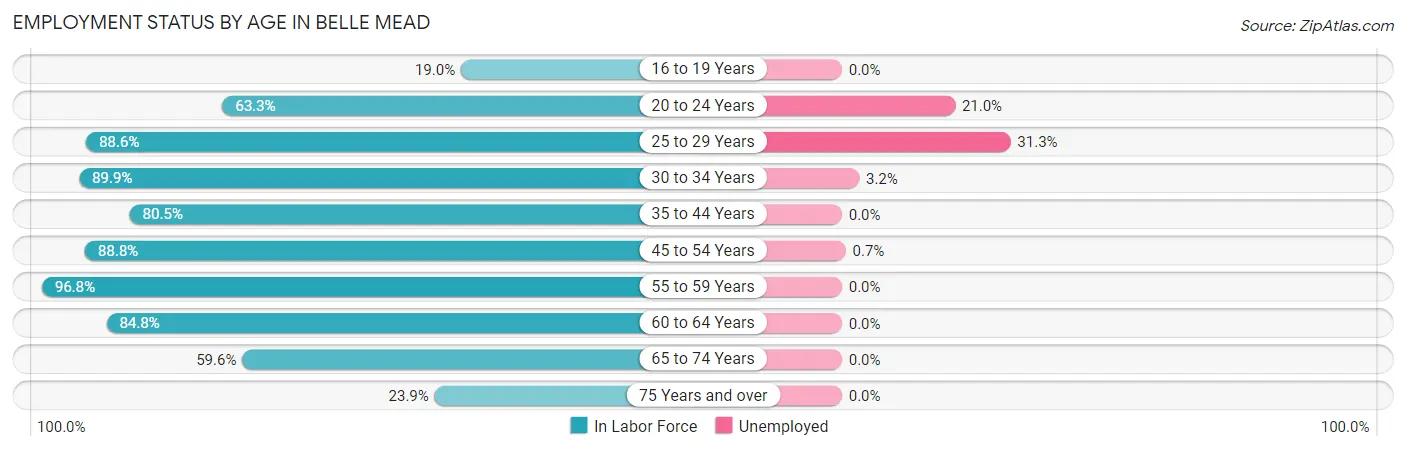
| Age Bracket | In Labor Force | Unemployed |
| 16 to 19 Years | 51 (19.0%) | 0 (0.0%) |
| 20 to 24 Years | 100 (63.3%) | 21 (21.0%) |
| 25 to 29 Years | 179 (88.6%) | 56 (31.3%) |
| 30 to 34 Years | 408 (89.9%) | 13 (3.2%) |
| 35 to 44 Years | 960 (80.5%) | 0 (0.0%) |
| 45 to 54 Years | 842 (88.8%) | 6 (0.7%) |
| 55 to 59 Years | 363 (96.8%) | 0 (0.0%) |
| 60 to 64 Years | 89 (84.8%) | 0 (0.0%) |
| 65 to 74 Years | 137 (59.6%) | 0 (0.0%) |
| 75 Years and over | 39 (23.9%) | 0 (0.0%) |
| Total | 3,166 (77.3%) | 95 (3.0%) |
Employment Status by Educational Attainment in Belle Mead
According to labor force statistics for Belle Mead, 86.7% of individuals (2,840) out of the total population between 25 and 64 years of age (3,276) are in the labor force, with 2.6% or 74 of them being unemployed. The group with the highest labor force participation rate are those with the educational attainment of college / associate degree, with 100.0% or 552 individuals in the labor force. Within the labor force, individuals with college / associate degree education have the highest percentage of unemployment, with 10.1% or 56 of them being unemployed.
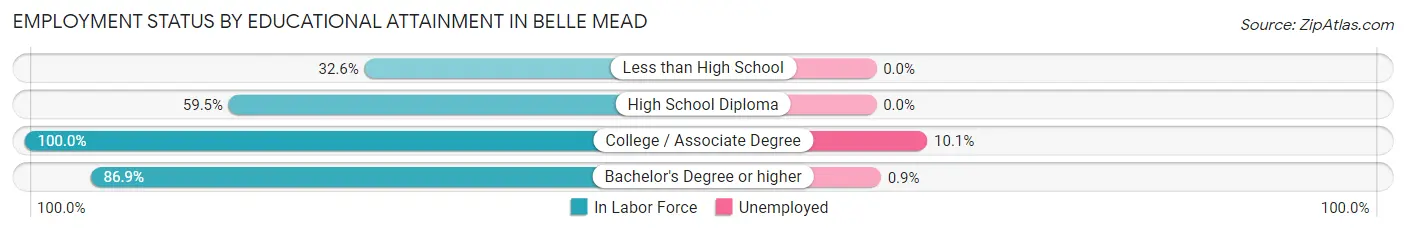
| Educational Attainment | In Labor Force | Unemployed |
| Less than High School | 28 (32.6%) | 0 (0.0%) |
| High School Diploma | 72 (59.5%) | 0 (0.0%) |
| College / Associate Degree | 552 (100.0%) | 56 (10.1%) |
| Bachelor's Degree or higher | 2,187 (86.9%) | 23 (0.9%) |
| Total | 2,840 (86.7%) | 85 (2.6%) |
Employment Occupations by Sex in Belle Mead
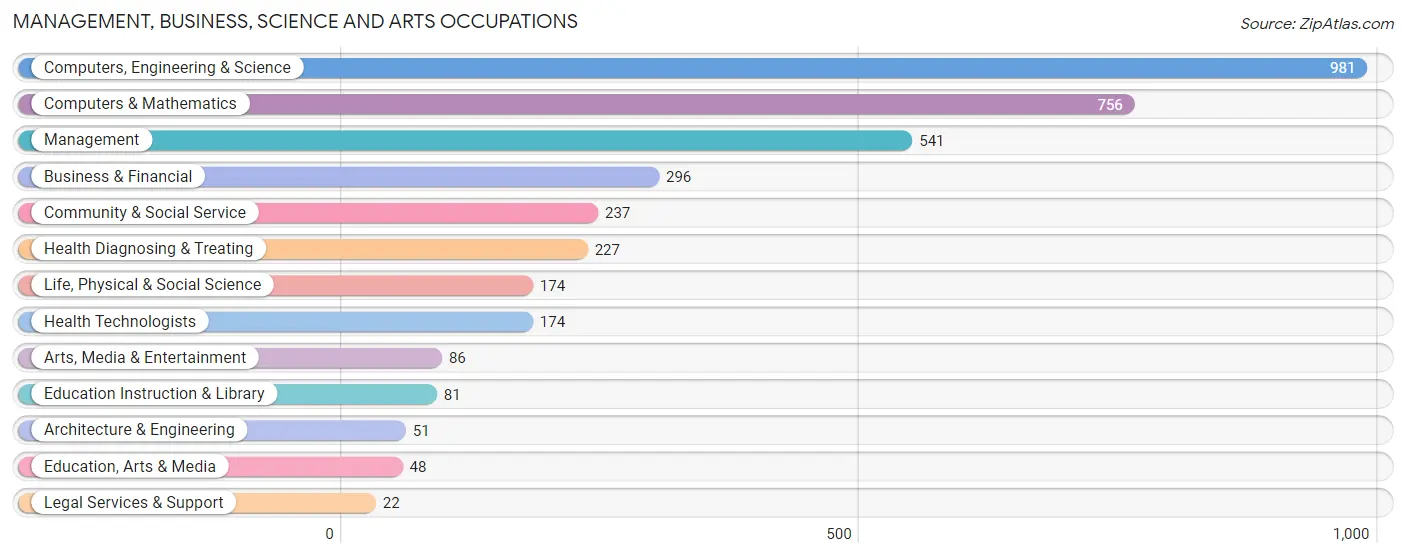
Management, Business, Science and Arts Occupations
The most common Management, Business, Science and Arts occupations in Belle Mead are Computers, Engineering & Science (981 | 31.9%), Computers & Mathematics (756 | 24.6%), Management (541 | 17.6%), Business & Financial (296 | 9.6%), and Community & Social Service (237 | 7.7%).
Management, Business, Science and Arts Occupations by Sex
Within the Management, Business, Science and Arts occupations in Belle Mead, the most male-oriented occupations are Legal Services & Support (100.0%), Architecture & Engineering (82.4%), and Business & Financial (67.9%), while the most female-oriented occupations are Education Instruction & Library (88.9%), Arts, Media & Entertainment (61.6%), and Community & Social Service (61.6%).
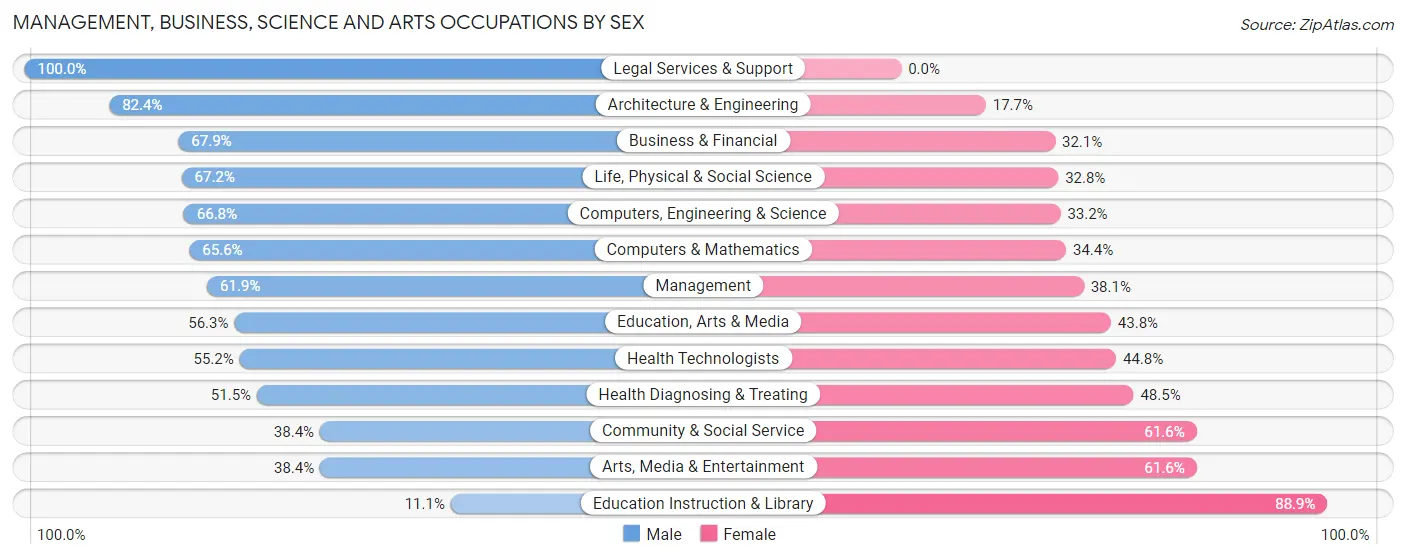
| Occupation | Male | Female |
| Management | 335 (61.9%) | 206 (38.1%) |
| Business & Financial | 201 (67.9%) | 95 (32.1%) |
| Computers, Engineering & Science | 655 (66.8%) | 326 (33.2%) |
| Computers & Mathematics | 496 (65.6%) | 260 (34.4%) |
| Architecture & Engineering | 42 (82.4%) | 9 (17.6%) |
| Life, Physical & Social Science | 117 (67.2%) | 57 (32.8%) |
| Community & Social Service | 91 (38.4%) | 146 (61.6%) |
| Education, Arts & Media | 27 (56.2%) | 21 (43.8%) |
| Legal Services & Support | 22 (100.0%) | 0 (0.0%) |
| Education Instruction & Library | 9 (11.1%) | 72 (88.9%) |
| Arts, Media & Entertainment | 33 (38.4%) | 53 (61.6%) |
| Health Diagnosing & Treating | 117 (51.5%) | 110 (48.5%) |
| Health Technologists | 96 (55.2%) | 78 (44.8%) |
| Total (Category) | 1,399 (61.3%) | 883 (38.7%) |
| Total (Overall) | 1,726 (56.2%) | 1,345 (43.8%) |
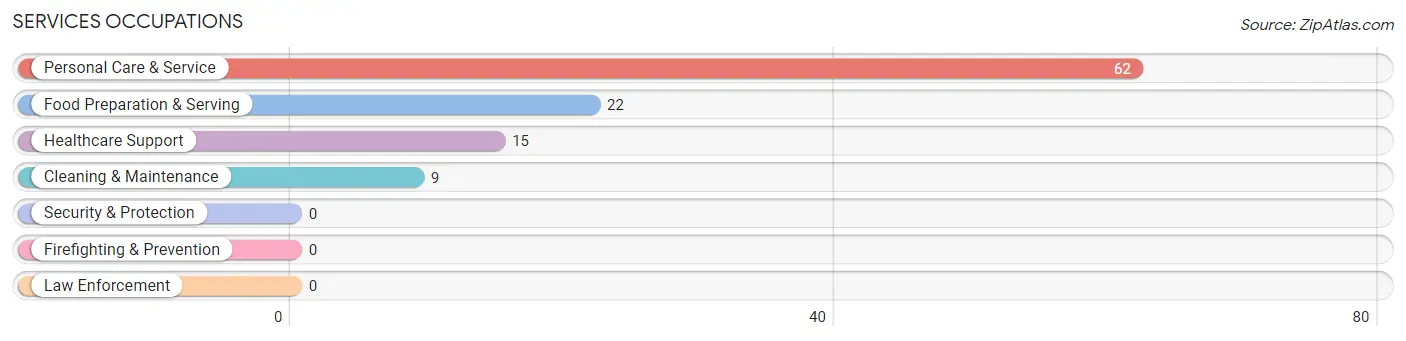
Services Occupations
The most common Services occupations in Belle Mead are Personal Care & Service (62 | 2.0%), Food Preparation & Serving (22 | 0.7%), Healthcare Support (15 | 0.5%), and Cleaning & Maintenance (9 | 0.3%).
Services Occupations by Sex
Within the Services occupations in Belle Mead, the most male-oriented occupations are Cleaning & Maintenance (100.0%), Food Preparation & Serving (45.5%), and Personal Care & Service (12.9%), while the most female-oriented occupations are Healthcare Support (100.0%), Personal Care & Service (87.1%), and Food Preparation & Serving (54.5%).
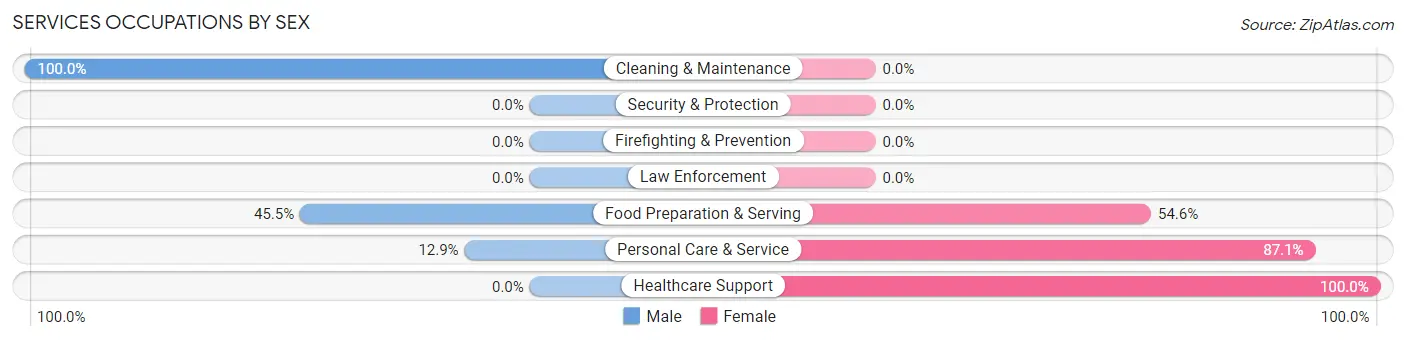
| Occupation | Male | Female |
| Healthcare Support | 0 (0.0%) | 15 (100.0%) |
| Security & Protection | 0 (0.0%) | 0 (0.0%) |
| Firefighting & Prevention | 0 (0.0%) | 0 (0.0%) |
| Law Enforcement | 0 (0.0%) | 0 (0.0%) |
| Food Preparation & Serving | 10 (45.5%) | 12 (54.5%) |
| Cleaning & Maintenance | 9 (100.0%) | 0 (0.0%) |
| Personal Care & Service | 8 (12.9%) | 54 (87.1%) |
| Total (Category) | 27 (25.0%) | 81 (75.0%) |
| Total (Overall) | 1,726 (56.2%) | 1,345 (43.8%) |
Sales and Office Occupations
The most common Sales and Office occupations in Belle Mead are Sales & Related (365 | 11.9%), and Office & Administration (165 | 5.4%).

Sales and Office Occupations by Sex
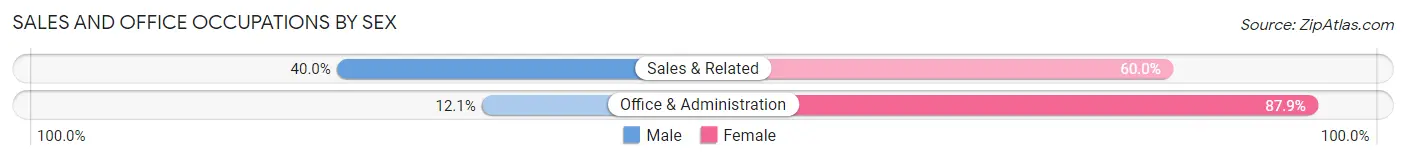
| Occupation | Male | Female |
| Sales & Related | 146 (40.0%) | 219 (60.0%) |
| Office & Administration | 20 (12.1%) | 145 (87.9%) |
| Total (Category) | 166 (31.3%) | 364 (68.7%) |
| Total (Overall) | 1,726 (56.2%) | 1,345 (43.8%) |
Natural Resources, Construction and Maintenance Occupations
The most common Natural Resources, Construction and Maintenance occupations in Belle Mead are , and Installation, Maintenance & Repair (102 | 3.3%).
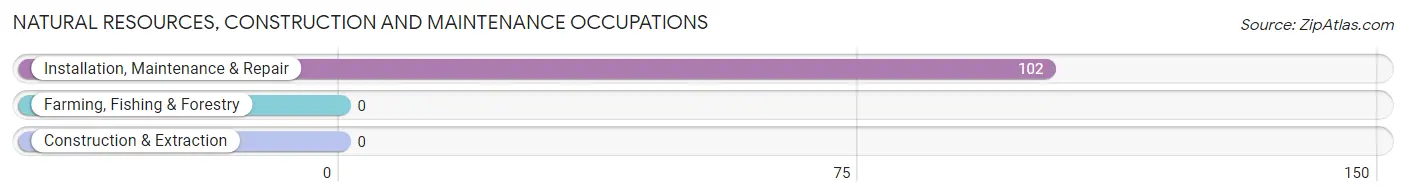
Natural Resources, Construction and Maintenance Occupations by Sex
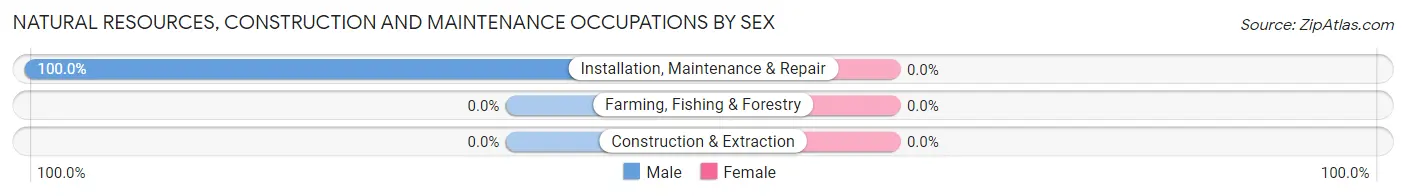
| Occupation | Male | Female |
| Farming, Fishing & Forestry | 0 (0.0%) | 0 (0.0%) |
| Construction & Extraction | 0 (0.0%) | 0 (0.0%) |
| Installation, Maintenance & Repair | 102 (100.0%) | 0 (0.0%) |
| Total (Category) | 102 (100.0%) | 0 (0.0%) |
| Total (Overall) | 1,726 (56.2%) | 1,345 (43.8%) |
Production, Transportation and Moving Occupations
The most common Production, Transportation and Moving occupations in Belle Mead are Production (18 | 0.6%), Material Moving (17 | 0.5%), and Transportation (14 | 0.5%).
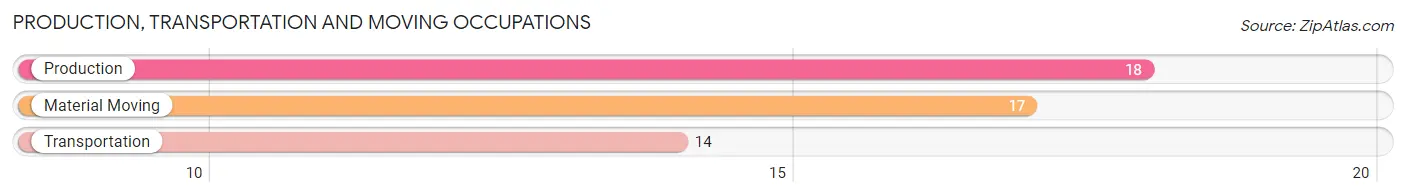
Production, Transportation and Moving Occupations by Sex
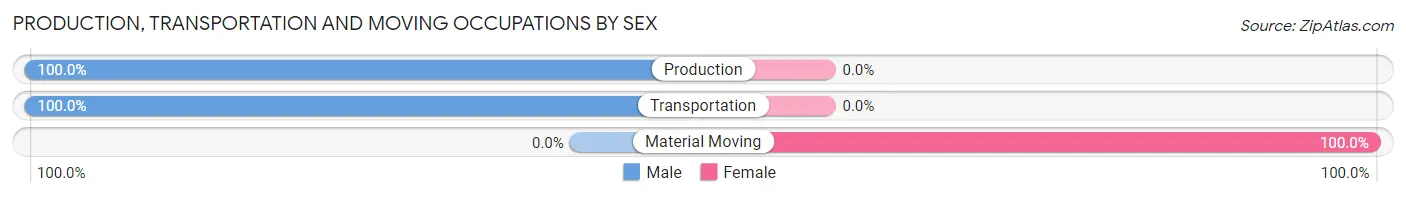
| Occupation | Male | Female |
| Production | 18 (100.0%) | 0 (0.0%) |
| Transportation | 14 (100.0%) | 0 (0.0%) |
| Material Moving | 0 (0.0%) | 17 (100.0%) |
| Total (Category) | 32 (65.3%) | 17 (34.7%) |
| Total (Overall) | 1,726 (56.2%) | 1,345 (43.8%) |
Employment Industries by Sex in Belle Mead
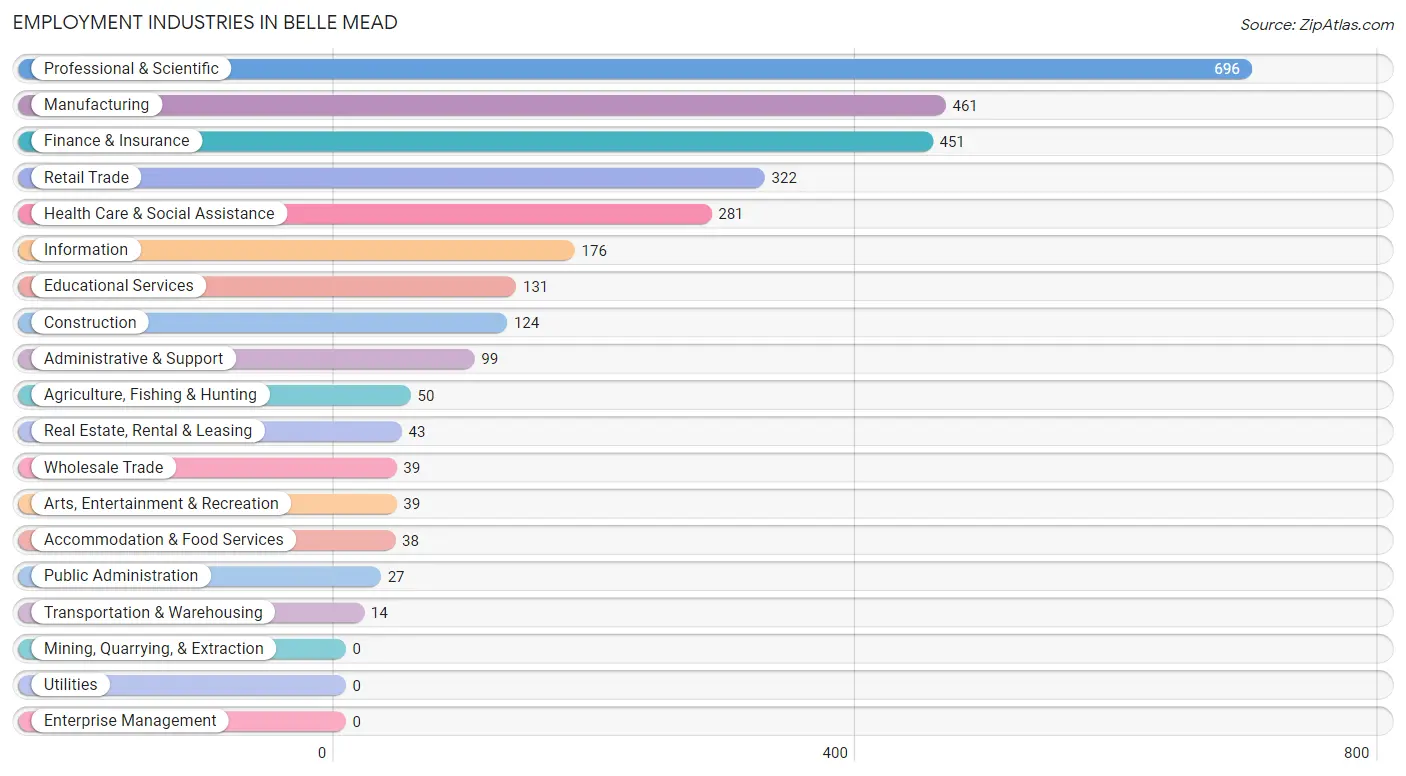
Employment Industries in Belle Mead
The major employment industries in Belle Mead include Professional & Scientific (696 | 22.7%), Manufacturing (461 | 15.0%), Finance & Insurance (451 | 14.7%), Retail Trade (322 | 10.5%), and Health Care & Social Assistance (281 | 9.1%).
Employment Industries by Sex in Belle Mead
The Belle Mead industries that see more men than women are Agriculture, Fishing & Hunting (100.0%), Construction (100.0%), and Wholesale Trade (100.0%), whereas the industries that tend to have a higher number of women are Real Estate, Rental & Leasing (100.0%), Educational Services (77.1%), and Health Care & Social Assistance (64.1%).
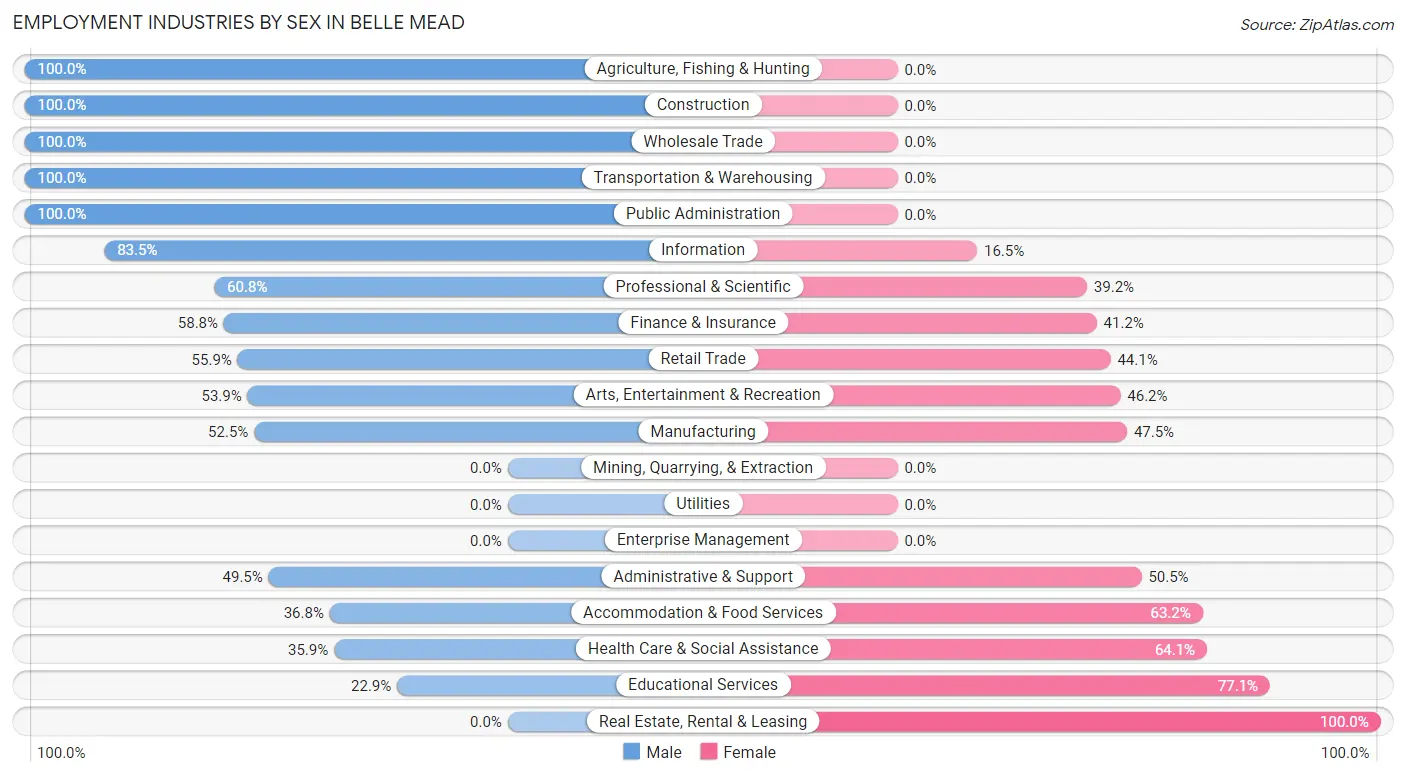
| Industry | Male | Female |
| Agriculture, Fishing & Hunting | 50 (100.0%) | 0 (0.0%) |
| Mining, Quarrying, & Extraction | 0 (0.0%) | 0 (0.0%) |
| Construction | 124 (100.0%) | 0 (0.0%) |
| Manufacturing | 242 (52.5%) | 219 (47.5%) |
| Wholesale Trade | 39 (100.0%) | 0 (0.0%) |
| Retail Trade | 180 (55.9%) | 142 (44.1%) |
| Transportation & Warehousing | 14 (100.0%) | 0 (0.0%) |
| Utilities | 0 (0.0%) | 0 (0.0%) |
| Information | 147 (83.5%) | 29 (16.5%) |
| Finance & Insurance | 265 (58.8%) | 186 (41.2%) |
| Real Estate, Rental & Leasing | 0 (0.0%) | 43 (100.0%) |
| Professional & Scientific | 423 (60.8%) | 273 (39.2%) |
| Enterprise Management | 0 (0.0%) | 0 (0.0%) |
| Administrative & Support | 49 (49.5%) | 50 (50.5%) |
| Educational Services | 30 (22.9%) | 101 (77.1%) |
| Health Care & Social Assistance | 101 (35.9%) | 180 (64.1%) |
| Arts, Entertainment & Recreation | 21 (53.8%) | 18 (46.2%) |
| Accommodation & Food Services | 14 (36.8%) | 24 (63.2%) |
| Public Administration | 27 (100.0%) | 0 (0.0%) |
| Total | 1,726 (56.2%) | 1,345 (43.8%) |
Education in Belle Mead
School Enrollment in Belle Mead
The most common levels of schooling among the 1,802 students in Belle Mead are middle school (517 | 28.7%), elementary school (458 | 25.4%), and high school (390 | 21.6%).
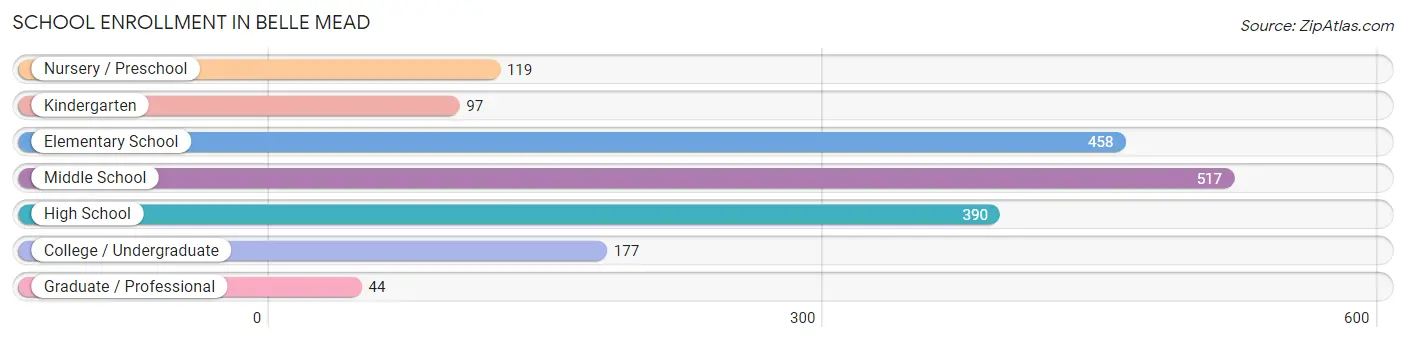
| School Level | # Students | % Students |
| Nursery / Preschool | 119 | 6.6% |
| Kindergarten | 97 | 5.4% |
| Elementary School | 458 | 25.4% |
| Middle School | 517 | 28.7% |
| High School | 390 | 21.6% |
| College / Undergraduate | 177 | 9.8% |
| Graduate / Professional | 44 | 2.4% |
| Total | 1,802 | 100.0% |
School Enrollment by Age by Funding Source in Belle Mead
Out of a total of 1,802 students who are enrolled in schools in Belle Mead, 247 (13.7%) attend a private institution, while the remaining 1,555 (86.3%) are enrolled in public schools. The age group of 3 to 4 year olds has the highest likelihood of being enrolled in private schools, with 69 (100.0% in the age bracket) enrolled. Conversely, the age group of 15 to 17 year olds has the lowest likelihood of being enrolled in a private school, with 252 (100.0% in the age bracket) attending a public institution.
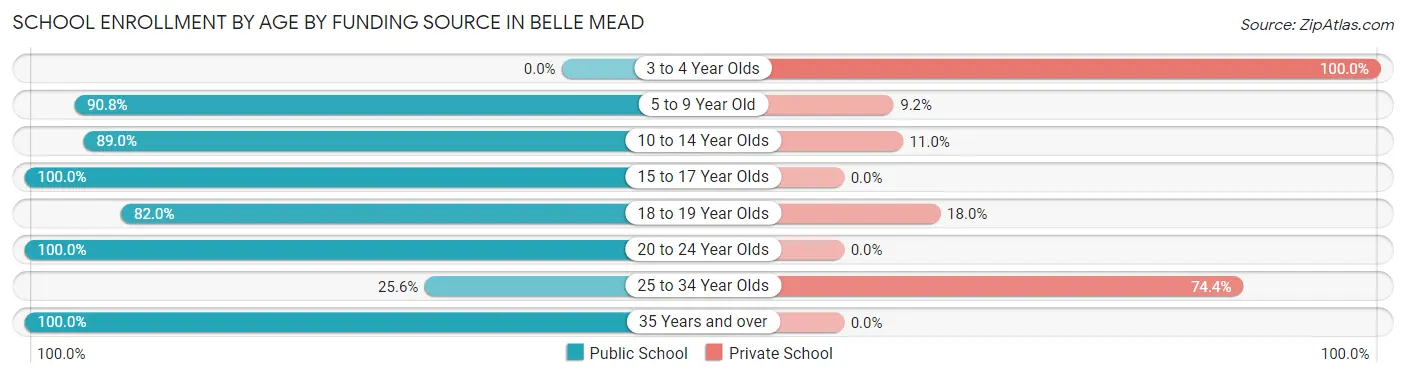
| Age Bracket | Public School | Private School |
| 3 to 4 Year Olds | 0 (0.0%) | 69 (100.0%) |
| 5 to 9 Year Old | 501 (90.8%) | 51 (9.2%) |
| 10 to 14 Year Olds | 575 (89.0%) | 71 (11.0%) |
| 15 to 17 Year Olds | 252 (100.0%) | 0 (0.0%) |
| 18 to 19 Year Olds | 105 (82.0%) | 23 (18.0%) |
| 20 to 24 Year Olds | 66 (100.0%) | 0 (0.0%) |
| 25 to 34 Year Olds | 11 (25.6%) | 32 (74.4%) |
| 35 Years and over | 46 (100.0%) | 0 (0.0%) |
| Total | 1,555 (86.3%) | 247 (13.7%) |
Educational Attainment by Field of Study in Belle Mead
Engineering (668 | 23.6%), computers & mathematics (480 | 16.9%), business (374 | 13.2%), science & technology (347 | 12.2%), and physical & health sciences (279 | 9.8%) are the most common fields of study among 2,835 individuals in Belle Mead who have obtained a bachelor's degree or higher.
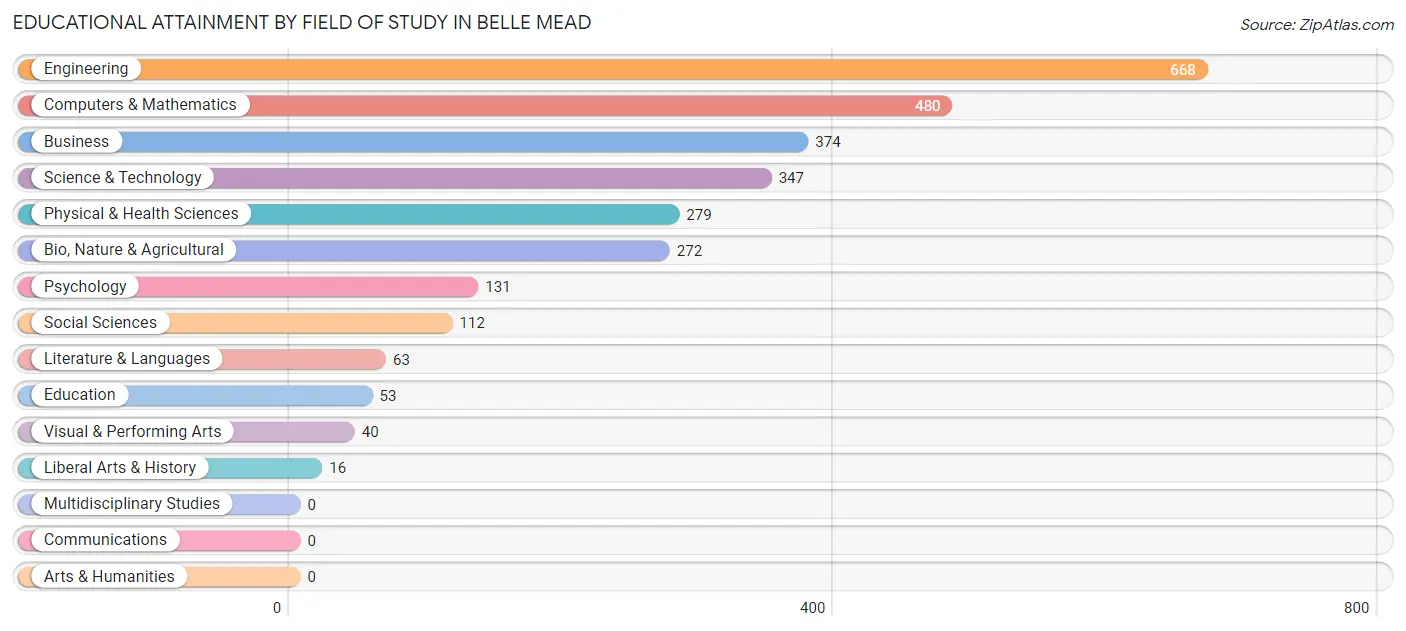
| Field of Study | # Graduates | % Graduates |
| Computers & Mathematics | 480 | 16.9% |
| Bio, Nature & Agricultural | 272 | 9.6% |
| Physical & Health Sciences | 279 | 9.8% |
| Psychology | 131 | 4.6% |
| Social Sciences | 112 | 4.0% |
| Engineering | 668 | 23.6% |
| Multidisciplinary Studies | 0 | 0.0% |
| Science & Technology | 347 | 12.2% |
| Business | 374 | 13.2% |
| Education | 53 | 1.9% |
| Literature & Languages | 63 | 2.2% |
| Liberal Arts & History | 16 | 0.6% |
| Visual & Performing Arts | 40 | 1.4% |
| Communications | 0 | 0.0% |
| Arts & Humanities | 0 | 0.0% |
| Total | 2,835 | 100.0% |
Transportation & Commute in Belle Mead
Vehicle Availability by Sex in Belle Mead
The most prevalent vehicle ownership categories in Belle Mead are males with 2 vehicles (1,121, accounting for 65.5%) and females with 2 vehicles (807, making up 84.7%).
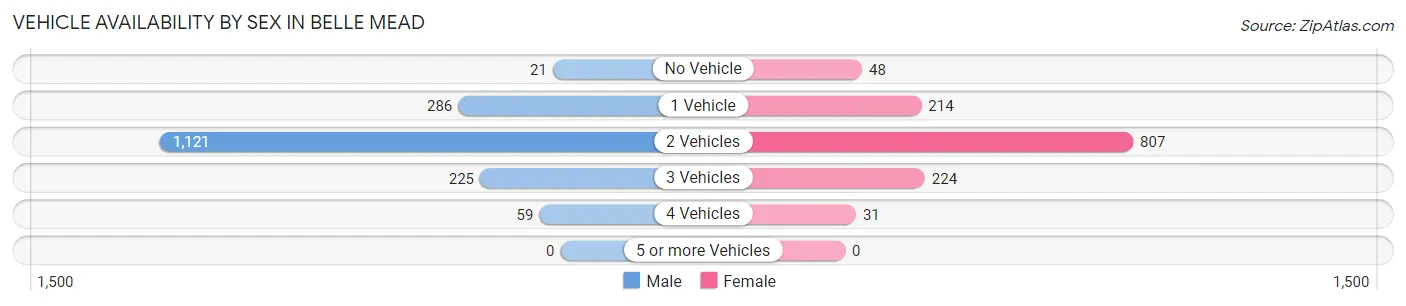
| Vehicles Available | Male | Female |
| No Vehicle | 21 (1.2%) | 48 (3.6%) |
| 1 Vehicle | 286 (16.7%) | 214 (16.2%) |
| 2 Vehicles | 1,121 (65.5%) | 807 (61.0%) |
| 3 Vehicles | 225 (13.1%) | 224 (16.9%) |
| 4 Vehicles | 59 (3.5%) | 31 (2.3%) |
| 5 or more Vehicles | 0 (0.0%) | 0 (0.0%) |
| Total | 1,712 (100.0%) | 1,324 (100.0%) |
Commute Time in Belle Mead
The most frequently occuring commute durations in Belle Mead are 45 to 59 minutes (324 commuters, 15.8%), 30 to 34 minutes (253 commuters, 12.3%), and 90 or more minutes (237 commuters, 11.5%).
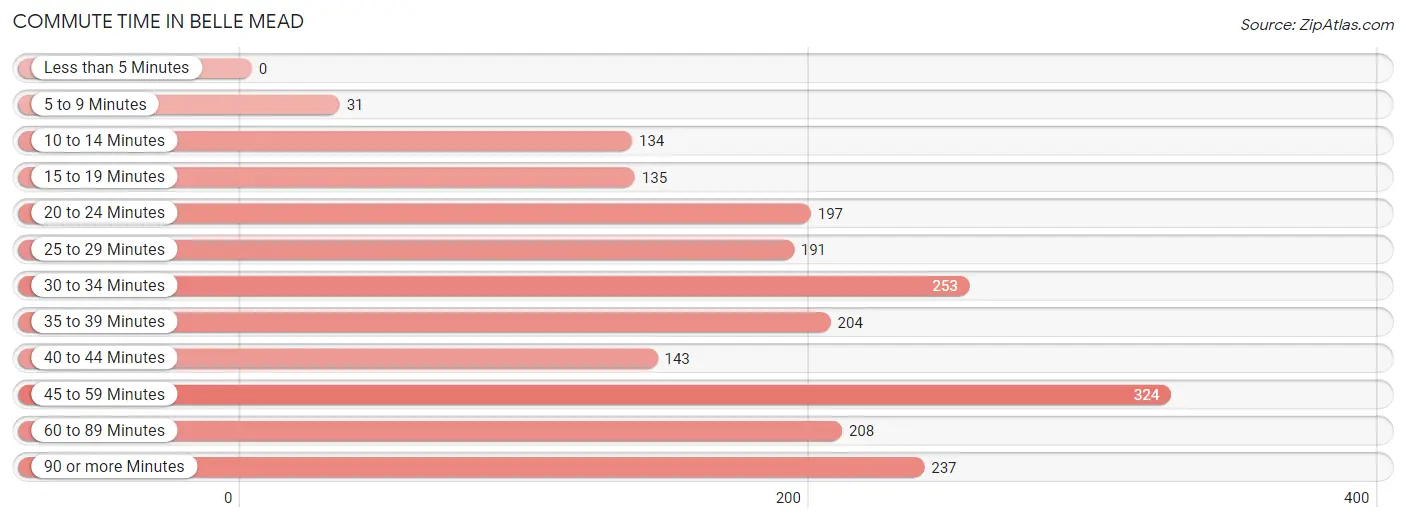
| Commute Time | # Commuters | % Commuters |
| Less than 5 Minutes | 0 | 0.0% |
| 5 to 9 Minutes | 31 | 1.5% |
| 10 to 14 Minutes | 134 | 6.5% |
| 15 to 19 Minutes | 135 | 6.6% |
| 20 to 24 Minutes | 197 | 9.6% |
| 25 to 29 Minutes | 191 | 9.3% |
| 30 to 34 Minutes | 253 | 12.3% |
| 35 to 39 Minutes | 204 | 9.9% |
| 40 to 44 Minutes | 143 | 7.0% |
| 45 to 59 Minutes | 324 | 15.8% |
| 60 to 89 Minutes | 208 | 10.1% |
| 90 or more Minutes | 237 | 11.5% |
Commute Time by Sex in Belle Mead
The most common commute times in Belle Mead are 45 to 59 minutes (205 commuters, 17.1%) for males and 30 to 34 minutes (153 commuters, 17.9%) for females.
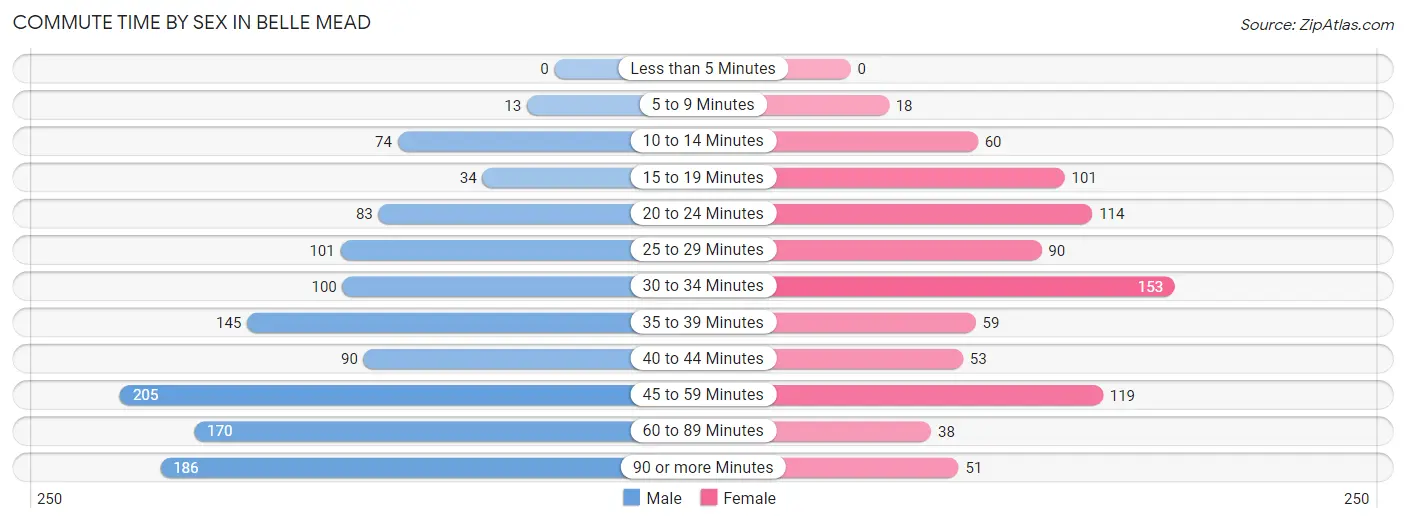
| Commute Time | Male | Female |
| Less than 5 Minutes | 0 (0.0%) | 0 (0.0%) |
| 5 to 9 Minutes | 13 (1.1%) | 18 (2.1%) |
| 10 to 14 Minutes | 74 (6.2%) | 60 (7.0%) |
| 15 to 19 Minutes | 34 (2.8%) | 101 (11.8%) |
| 20 to 24 Minutes | 83 (6.9%) | 114 (13.3%) |
| 25 to 29 Minutes | 101 (8.4%) | 90 (10.5%) |
| 30 to 34 Minutes | 100 (8.3%) | 153 (17.9%) |
| 35 to 39 Minutes | 145 (12.1%) | 59 (6.9%) |
| 40 to 44 Minutes | 90 (7.5%) | 53 (6.2%) |
| 45 to 59 Minutes | 205 (17.1%) | 119 (13.9%) |
| 60 to 89 Minutes | 170 (14.1%) | 38 (4.4%) |
| 90 or more Minutes | 186 (15.5%) | 51 (6.0%) |
Time of Departure to Work by Sex in Belle Mead
The most frequent times of departure to work in Belle Mead are 6:30 AM to 6:59 AM (351, 29.2%) for males and 8:00 AM to 8:29 AM (183, 21.4%) for females.
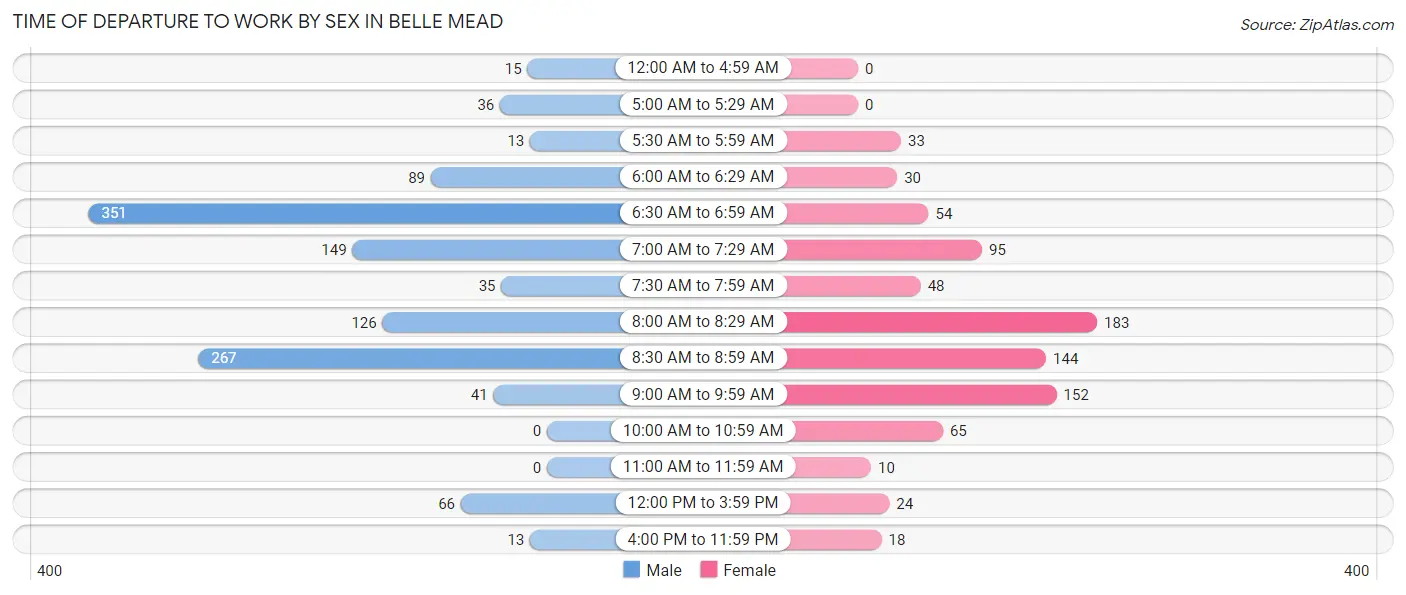
| Time of Departure | Male | Female |
| 12:00 AM to 4:59 AM | 15 (1.3%) | 0 (0.0%) |
| 5:00 AM to 5:29 AM | 36 (3.0%) | 0 (0.0%) |
| 5:30 AM to 5:59 AM | 13 (1.1%) | 33 (3.9%) |
| 6:00 AM to 6:29 AM | 89 (7.4%) | 30 (3.5%) |
| 6:30 AM to 6:59 AM | 351 (29.2%) | 54 (6.3%) |
| 7:00 AM to 7:29 AM | 149 (12.4%) | 95 (11.1%) |
| 7:30 AM to 7:59 AM | 35 (2.9%) | 48 (5.6%) |
| 8:00 AM to 8:29 AM | 126 (10.5%) | 183 (21.4%) |
| 8:30 AM to 8:59 AM | 267 (22.2%) | 144 (16.8%) |
| 9:00 AM to 9:59 AM | 41 (3.4%) | 152 (17.8%) |
| 10:00 AM to 10:59 AM | 0 (0.0%) | 65 (7.6%) |
| 11:00 AM to 11:59 AM | 0 (0.0%) | 10 (1.2%) |
| 12:00 PM to 3:59 PM | 66 (5.5%) | 24 (2.8%) |
| 4:00 PM to 11:59 PM | 13 (1.1%) | 18 (2.1%) |
| Total | 1,201 (100.0%) | 856 (100.0%) |
Housing Occupancy in Belle Mead
Occupancy by Ownership in Belle Mead
Of the total 1,897 dwellings in Belle Mead, owner-occupied units account for 1,205 (63.5%), while renter-occupied units make up 692 (36.5%).
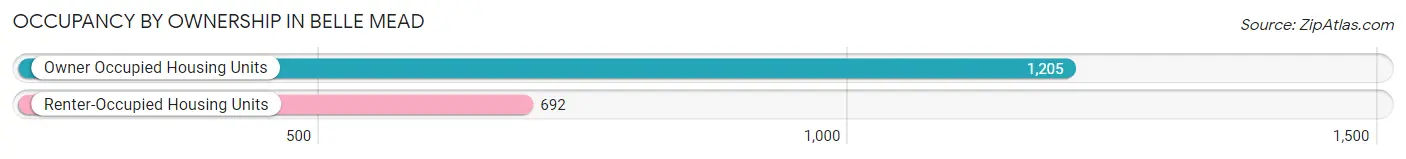
| Occupancy | # Housing Units | % Housing Units |
| Owner Occupied Housing Units | 1,205 | 63.5% |
| Renter-Occupied Housing Units | 692 | 36.5% |
| Total Occupied Housing Units | 1,897 | 100.0% |
Occupancy by Household Size in Belle Mead
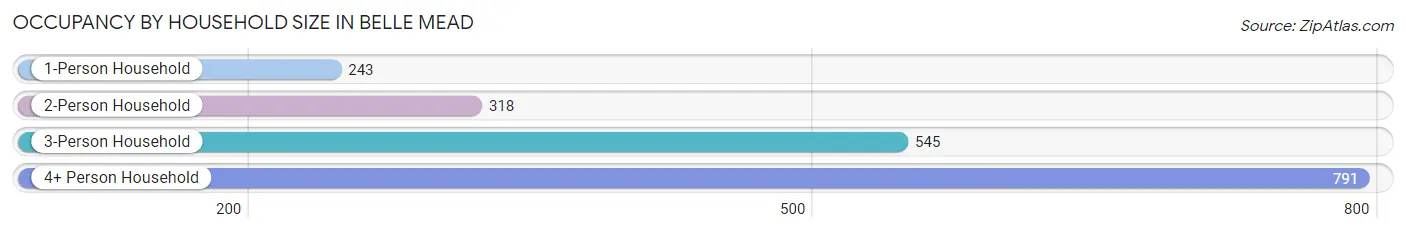
| Household Size | # Housing Units | % Housing Units |
| 1-Person Household | 243 | 12.8% |
| 2-Person Household | 318 | 16.8% |
| 3-Person Household | 545 | 28.7% |
| 4+ Person Household | 791 | 41.7% |
| Total Housing Units | 1,897 | 100.0% |
Occupancy by Ownership by Household Size in Belle Mead
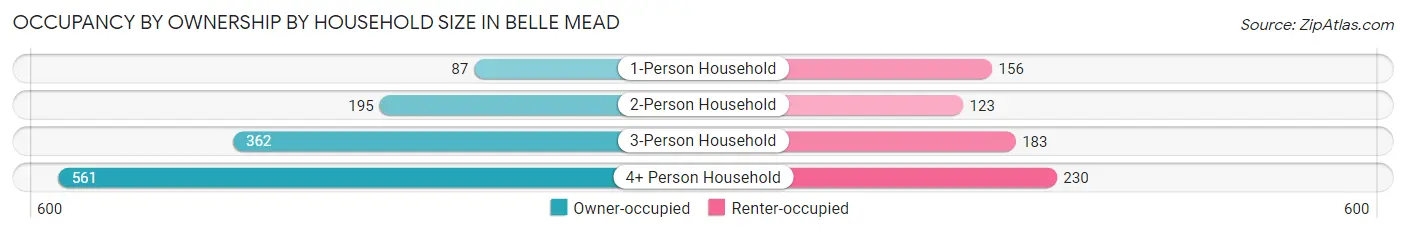
| Household Size | Owner-occupied | Renter-occupied |
| 1-Person Household | 87 (35.8%) | 156 (64.2%) |
| 2-Person Household | 195 (61.3%) | 123 (38.7%) |
| 3-Person Household | 362 (66.4%) | 183 (33.6%) |
| 4+ Person Household | 561 (70.9%) | 230 (29.1%) |
| Total Housing Units | 1,205 (63.5%) | 692 (36.5%) |
Occupancy by Educational Attainment in Belle Mead
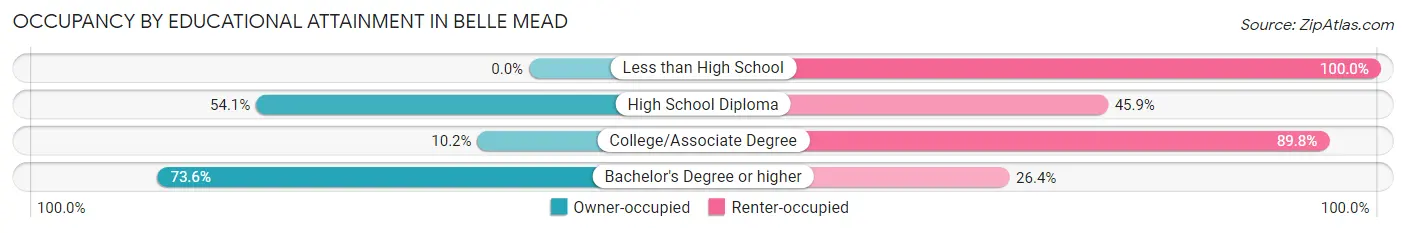
| Household Size | Owner-occupied | Renter-occupied |
| Less than High School | 0 (0.0%) | 17 (100.0%) |
| High School Diploma | 33 (54.1%) | 28 (45.9%) |
| College/Associate Degree | 27 (10.2%) | 237 (89.8%) |
| Bachelor's Degree or higher | 1,145 (73.6%) | 410 (26.4%) |
Occupancy by Age of Householder in Belle Mead
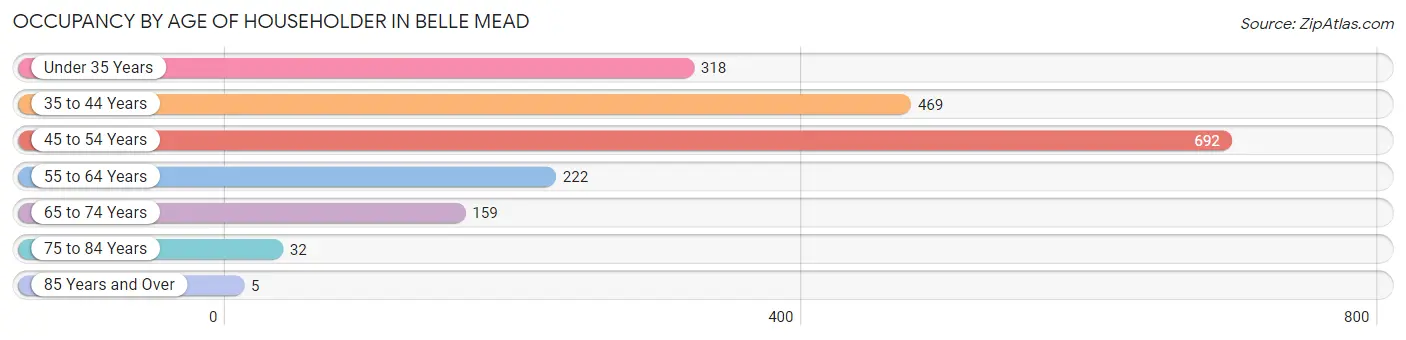
| Age Bracket | # Households | % Households |
| Under 35 Years | 318 | 16.8% |
| 35 to 44 Years | 469 | 24.7% |
| 45 to 54 Years | 692 | 36.5% |
| 55 to 64 Years | 222 | 11.7% |
| 65 to 74 Years | 159 | 8.4% |
| 75 to 84 Years | 32 | 1.7% |
| 85 Years and Over | 5 | 0.3% |
| Total | 1,897 | 100.0% |
Housing Finances in Belle Mead
Median Income by Occupancy in Belle Mead
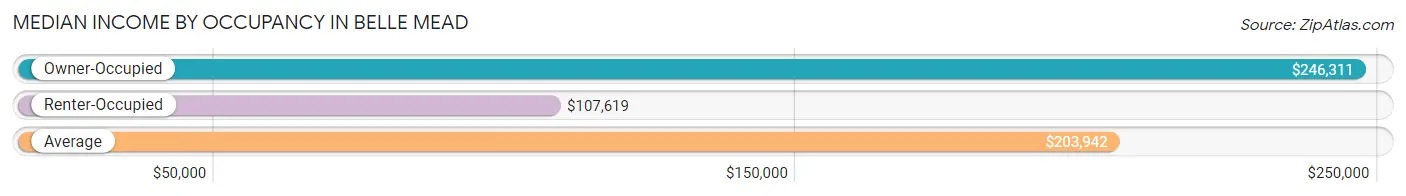
| Occupancy Type | # Households | Median Income |
| Owner-Occupied | 1,205 (63.5%) | $246,311 |
| Renter-Occupied | 692 (36.5%) | $107,619 |
| Average | 1,897 (100.0%) | $203,942 |
Occupancy by Householder Income Bracket in Belle Mead
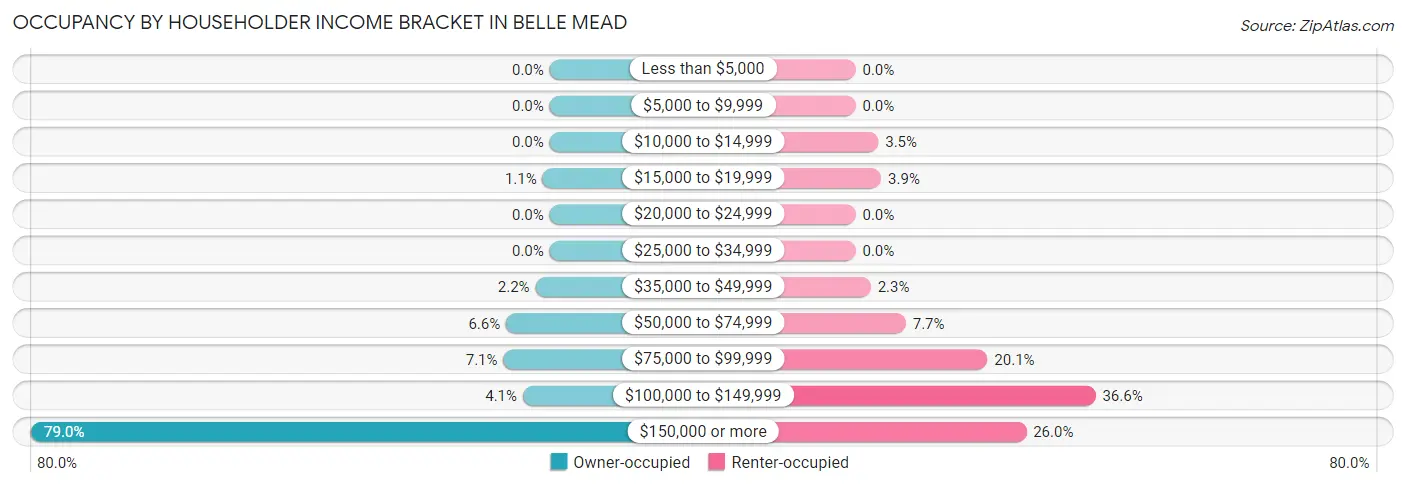
| Income Bracket | Owner-occupied | Renter-occupied |
| Less than $5,000 | 0 (0.0%) | 0 (0.0%) |
| $5,000 to $9,999 | 0 (0.0%) | 0 (0.0%) |
| $10,000 to $14,999 | 0 (0.0%) | 24 (3.5%) |
| $15,000 to $19,999 | 13 (1.1%) | 27 (3.9%) |
| $20,000 to $24,999 | 0 (0.0%) | 0 (0.0%) |
| $25,000 to $34,999 | 0 (0.0%) | 0 (0.0%) |
| $35,000 to $49,999 | 26 (2.2%) | 16 (2.3%) |
| $50,000 to $74,999 | 80 (6.6%) | 53 (7.7%) |
| $75,000 to $99,999 | 85 (7.0%) | 139 (20.1%) |
| $100,000 to $149,999 | 49 (4.1%) | 253 (36.6%) |
| $150,000 or more | 952 (79.0%) | 180 (26.0%) |
| Total | 1,205 (100.0%) | 692 (100.0%) |
Monthly Housing Cost Tiers in Belle Mead
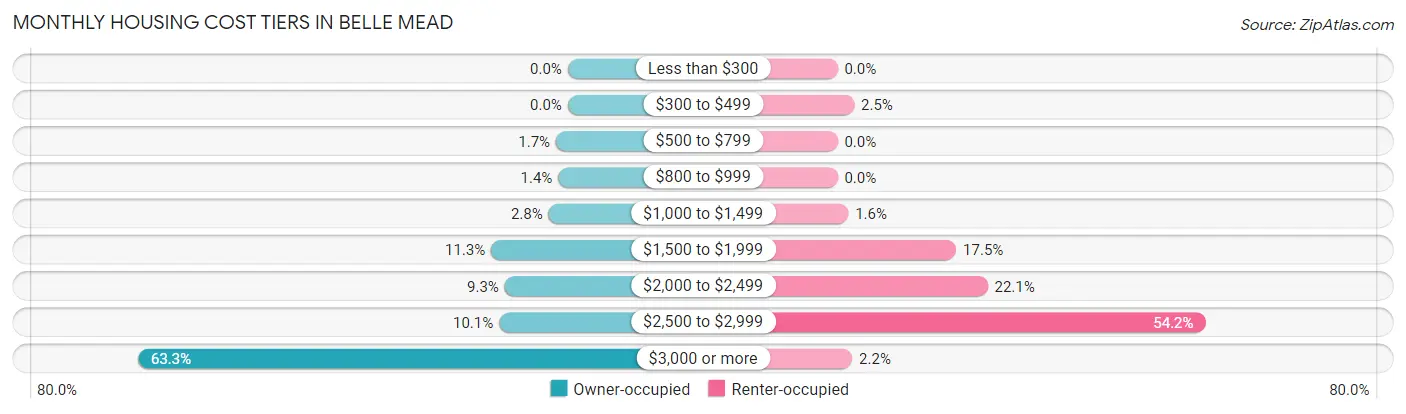
| Monthly Cost | Owner-occupied | Renter-occupied |
| Less than $300 | 0 (0.0%) | 0 (0.0%) |
| $300 to $499 | 0 (0.0%) | 17 (2.5%) |
| $500 to $799 | 21 (1.7%) | 0 (0.0%) |
| $800 to $999 | 17 (1.4%) | 0 (0.0%) |
| $1,000 to $1,499 | 34 (2.8%) | 11 (1.6%) |
| $1,500 to $1,999 | 136 (11.3%) | 121 (17.5%) |
| $2,000 to $2,499 | 112 (9.3%) | 153 (22.1%) |
| $2,500 to $2,999 | 122 (10.1%) | 375 (54.2%) |
| $3,000 or more | 763 (63.3%) | 15 (2.2%) |
| Total | 1,205 (100.0%) | 692 (100.0%) |
Physical Housing Characteristics in Belle Mead
Housing Structures in Belle Mead
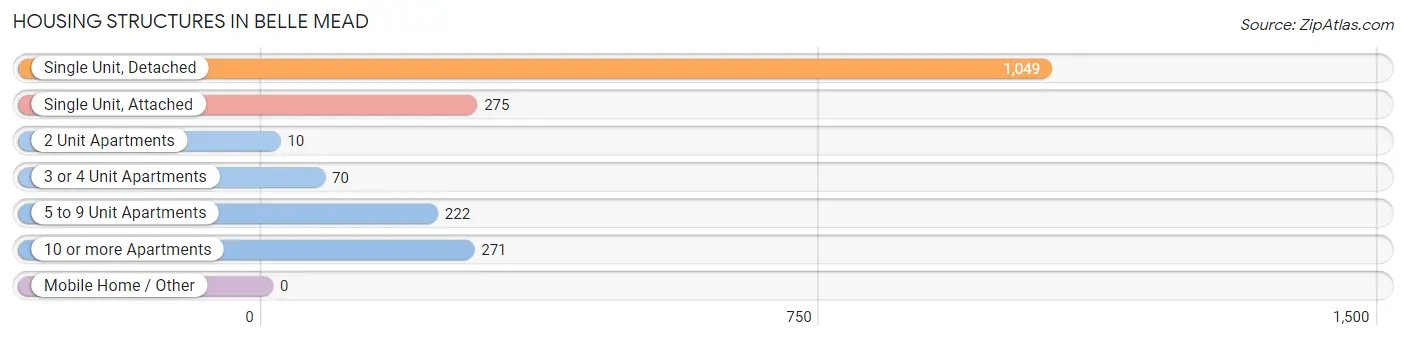
| Structure Type | # Housing Units | % Housing Units |
| Single Unit, Detached | 1,049 | 55.3% |
| Single Unit, Attached | 275 | 14.5% |
| 2 Unit Apartments | 10 | 0.5% |
| 3 or 4 Unit Apartments | 70 | 3.7% |
| 5 to 9 Unit Apartments | 222 | 11.7% |
| 10 or more Apartments | 271 | 14.3% |
| Mobile Home / Other | 0 | 0.0% |
| Total | 1,897 | 100.0% |
Housing Structures by Occupancy in Belle Mead
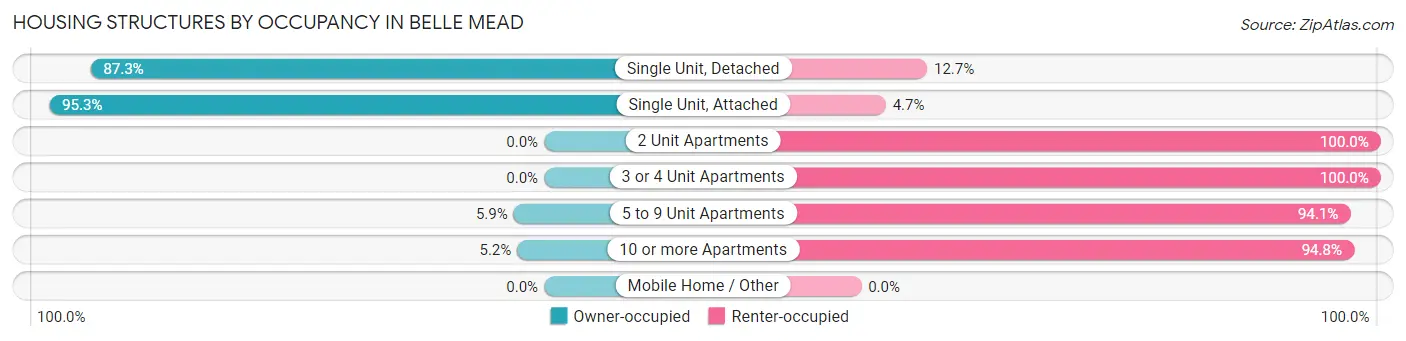
| Structure Type | Owner-occupied | Renter-occupied |
| Single Unit, Detached | 916 (87.3%) | 133 (12.7%) |
| Single Unit, Attached | 262 (95.3%) | 13 (4.7%) |
| 2 Unit Apartments | 0 (0.0%) | 10 (100.0%) |
| 3 or 4 Unit Apartments | 0 (0.0%) | 70 (100.0%) |
| 5 to 9 Unit Apartments | 13 (5.9%) | 209 (94.1%) |
| 10 or more Apartments | 14 (5.2%) | 257 (94.8%) |
| Mobile Home / Other | 0 (0.0%) | 0 (0.0%) |
| Total | 1,205 (63.5%) | 692 (36.5%) |
Housing Structures by Number of Rooms in Belle Mead
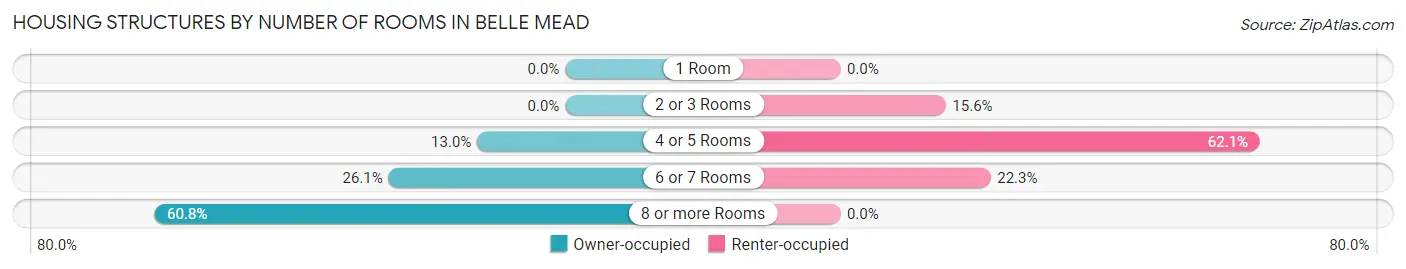
| Number of Rooms | Owner-occupied | Renter-occupied |
| 1 Room | 0 (0.0%) | 0 (0.0%) |
| 2 or 3 Rooms | 0 (0.0%) | 108 (15.6%) |
| 4 or 5 Rooms | 157 (13.0%) | 430 (62.1%) |
| 6 or 7 Rooms | 315 (26.1%) | 154 (22.3%) |
| 8 or more Rooms | 733 (60.8%) | 0 (0.0%) |
| Total | 1,205 (100.0%) | 692 (100.0%) |
Housing Structure by Heating Type in Belle Mead
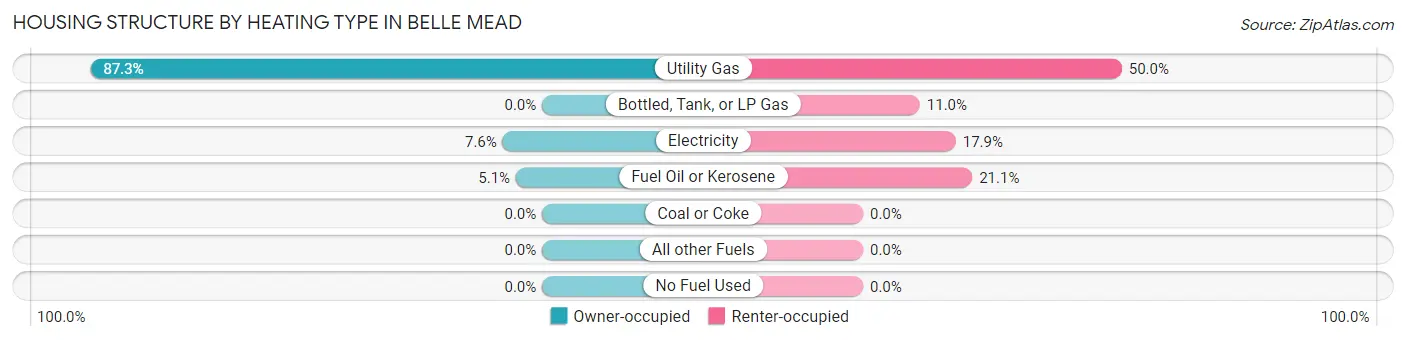
| Heating Type | Owner-occupied | Renter-occupied |
| Utility Gas | 1,052 (87.3%) | 346 (50.0%) |
| Bottled, Tank, or LP Gas | 0 (0.0%) | 76 (11.0%) |
| Electricity | 92 (7.6%) | 124 (17.9%) |
| Fuel Oil or Kerosene | 61 (5.1%) | 146 (21.1%) |
| Coal or Coke | 0 (0.0%) | 0 (0.0%) |
| All other Fuels | 0 (0.0%) | 0 (0.0%) |
| No Fuel Used | 0 (0.0%) | 0 (0.0%) |
| Total | 1,205 (100.0%) | 692 (100.0%) |
Household Vehicle Usage in Belle Mead
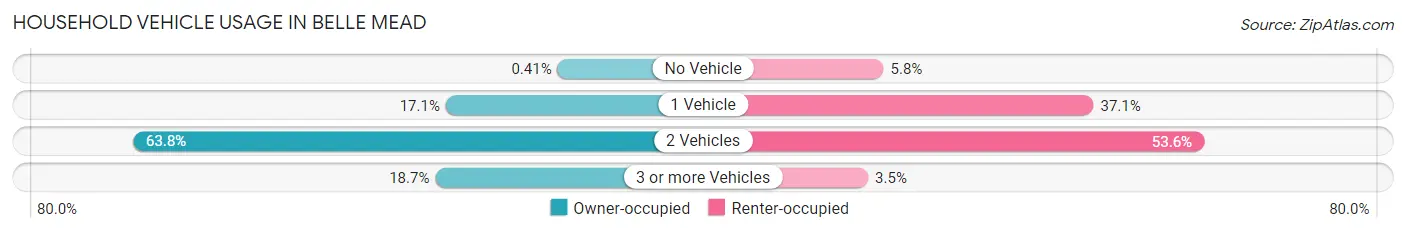
| Vehicles per Household | Owner-occupied | Renter-occupied |
| No Vehicle | 5 (0.4%) | 40 (5.8%) |
| 1 Vehicle | 206 (17.1%) | 257 (37.1%) |
| 2 Vehicles | 769 (63.8%) | 371 (53.6%) |
| 3 or more Vehicles | 225 (18.7%) | 24 (3.5%) |
| Total | 1,205 (100.0%) | 692 (100.0%) |
Real Estate & Mortgages in Belle Mead
Real Estate and Mortgage Overview in Belle Mead
| Characteristic | Without Mortgage | With Mortgage |
| Housing Units | 311 | 894 |
| Median Property Value | $639,500 | $684,500 |
| Median Household Income | $185,625 | $792 |
| Monthly Housing Costs | $1,501 | $752 |
| Real Estate Taxes | $10,001 | $0 |
Property Value by Mortgage Status in Belle Mead
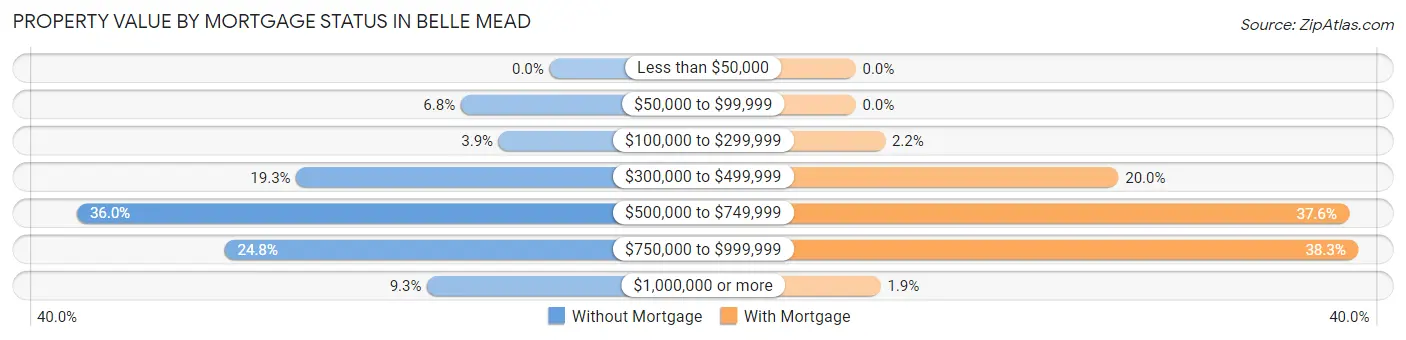
| Property Value | Without Mortgage | With Mortgage |
| Less than $50,000 | 0 (0.0%) | 0 (0.0%) |
| $50,000 to $99,999 | 21 (6.8%) | 0 (0.0%) |
| $100,000 to $299,999 | 12 (3.9%) | 20 (2.2%) |
| $300,000 to $499,999 | 60 (19.3%) | 179 (20.0%) |
| $500,000 to $749,999 | 112 (36.0%) | 336 (37.6%) |
| $750,000 to $999,999 | 77 (24.8%) | 342 (38.3%) |
| $1,000,000 or more | 29 (9.3%) | 17 (1.9%) |
| Total | 311 (100.0%) | 894 (100.0%) |
Household Income by Mortgage Status in Belle Mead
| Household Income | Without Mortgage | With Mortgage |
| Less than $10,000 | 0 (0.0%) | 25 (2.8%) |
| $10,000 to $24,999 | 13 (4.2%) | 0 (0.0%) |
| $25,000 to $34,999 | 0 (0.0%) | 0 (0.0%) |
| $35,000 to $49,999 | 26 (8.4%) | 0 (0.0%) |
| $50,000 to $74,999 | 51 (16.4%) | 0 (0.0%) |
| $75,000 to $99,999 | 54 (17.4%) | 29 (3.2%) |
| $100,000 to $149,999 | 7 (2.2%) | 31 (3.5%) |
| $150,000 or more | 160 (51.4%) | 42 (4.7%) |
| Total | 311 (100.0%) | 894 (100.0%) |
Property Value to Household Income Ratio in Belle Mead
| Value-to-Income Ratio | Without Mortgage | With Mortgage |
| Less than 2.0x | 58 (18.6%) | 250,001 (27,964.3%) |
| 2.0x to 2.9x | 83 (26.7%) | 206 (23.0%) |
| 3.0x to 3.9x | 41 (13.2%) | 240 (26.9%) |
| 4.0x or more | 129 (41.5%) | 286 (32.0%) |
| Total | 311 (100.0%) | 894 (100.0%) |
Real Estate Taxes by Mortgage Status in Belle Mead
| Property Taxes | Without Mortgage | With Mortgage |
| Less than $800 | 0 (0.0%) | 0 (0.0%) |
| $800 to $1,499 | 0 (0.0%) | 0 (0.0%) |
| $800 to $1,499 | 311 (100.0%) | 0 (0.0%) |
| Total | 311 (100.0%) | 894 (100.0%) |
Health & Disability in Belle Mead
Health Insurance Coverage by Age in Belle Mead
| Age Bracket | With Coverage | Without Coverage |
| Under 6 Years | 536 (100.0%) | 0 (0.0%) |
| 6 to 18 Years | 1,441 (99.6%) | 6 (0.4%) |
| 19 to 25 Years | 295 (100.0%) | 0 (0.0%) |
| 26 to 34 Years | 576 (100.0%) | 0 (0.0%) |
| 35 to 44 Years | 1,192 (100.0%) | 0 (0.0%) |
| 45 to 54 Years | 934 (98.5%) | 14 (1.5%) |
| 55 to 64 Years | 480 (100.0%) | 0 (0.0%) |
| 65 to 74 Years | 230 (100.0%) | 0 (0.0%) |
| 75 Years and older | 163 (100.0%) | 0 (0.0%) |
| Total | 5,847 (99.7%) | 20 (0.3%) |
Health Insurance Coverage by Citizenship Status in Belle Mead
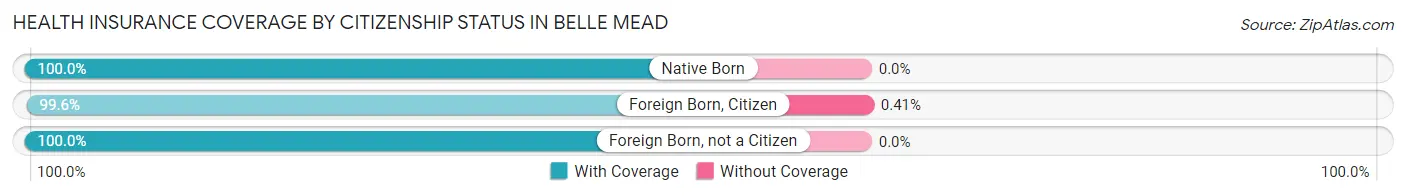
| Citizenship Status | With Coverage | Without Coverage |
| Native Born | 536 (100.0%) | 0 (0.0%) |
| Foreign Born, Citizen | 1,441 (99.6%) | 6 (0.4%) |
| Foreign Born, not a Citizen | 295 (100.0%) | 0 (0.0%) |
Health Insurance Coverage by Household Income in Belle Mead
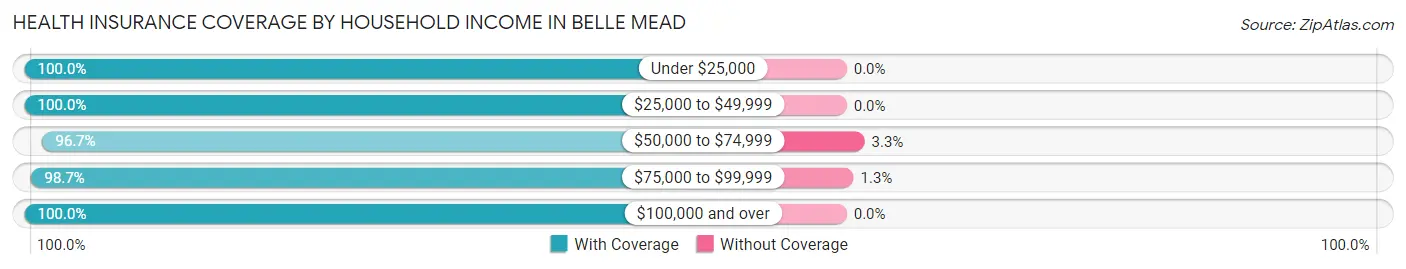
| Household Income | With Coverage | Without Coverage |
| Under $25,000 | 138 (100.0%) | 0 (0.0%) |
| $25,000 to $49,999 | 57 (100.0%) | 0 (0.0%) |
| $50,000 to $74,999 | 406 (96.7%) | 14 (3.3%) |
| $75,000 to $99,999 | 464 (98.7%) | 6 (1.3%) |
| $100,000 and over | 4,782 (100.0%) | 0 (0.0%) |
Public vs Private Health Insurance Coverage by Age in Belle Mead
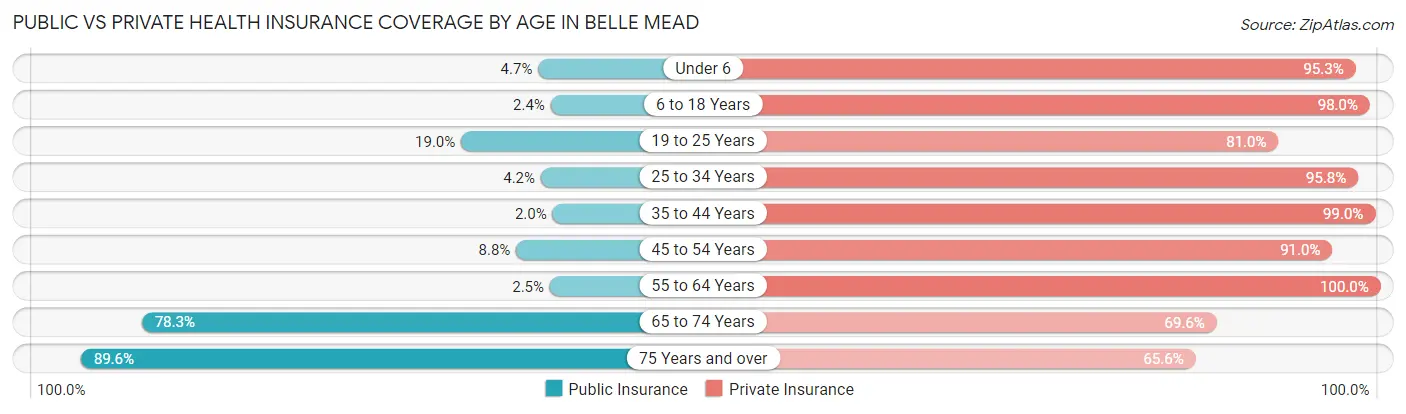
| Age Bracket | Public Insurance | Private Insurance |
| Under 6 | 25 (4.7%) | 511 (95.3%) |
| 6 to 18 Years | 34 (2.4%) | 1,418 (98.0%) |
| 19 to 25 Years | 56 (19.0%) | 239 (81.0%) |
| 25 to 34 Years | 24 (4.2%) | 552 (95.8%) |
| 35 to 44 Years | 24 (2.0%) | 1,180 (99.0%) |
| 45 to 54 Years | 83 (8.8%) | 863 (91.0%) |
| 55 to 64 Years | 12 (2.5%) | 480 (100.0%) |
| 65 to 74 Years | 180 (78.3%) | 160 (69.6%) |
| 75 Years and over | 146 (89.6%) | 107 (65.6%) |
| Total | 584 (10.0%) | 5,510 (93.9%) |
Disability Status by Sex by Age in Belle Mead
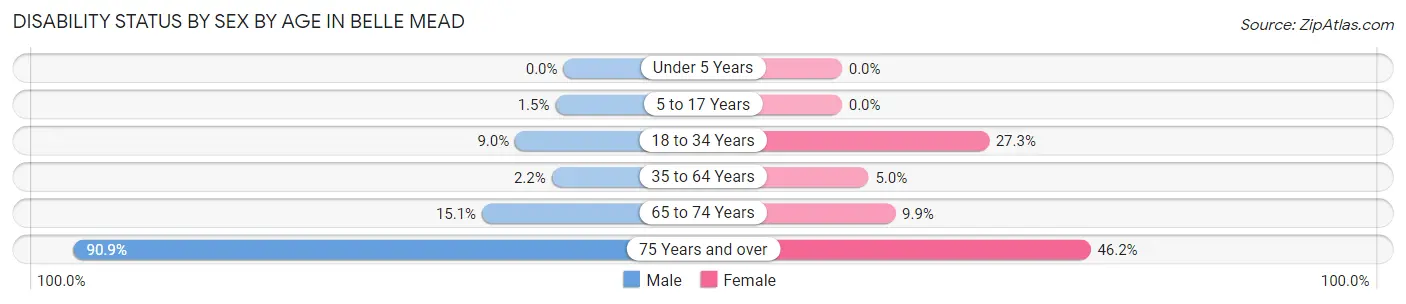
| Age Bracket | Male | Female |
| Under 5 Years | 0 (0.0%) | 0 (0.0%) |
| 5 to 17 Years | 11 (1.5%) | 0 (0.0%) |
| 18 to 34 Years | 43 (9.0%) | 126 (27.3%) |
| 35 to 64 Years | 29 (2.2%) | 64 (5.0%) |
| 65 to 74 Years | 21 (15.1%) | 9 (9.9%) |
| 75 Years and over | 30 (90.9%) | 60 (46.2%) |
Disability Class by Sex by Age in Belle Mead
Disability Class: Hearing Difficulty
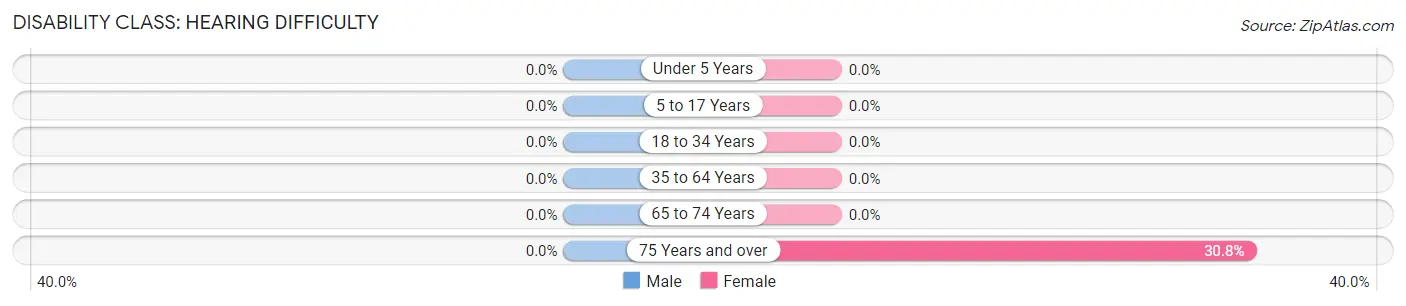
| Age Bracket | Male | Female |
| Under 5 Years | 0 (0.0%) | 0 (0.0%) |
| 5 to 17 Years | 0 (0.0%) | 0 (0.0%) |
| 18 to 34 Years | 0 (0.0%) | 0 (0.0%) |
| 35 to 64 Years | 0 (0.0%) | 0 (0.0%) |
| 65 to 74 Years | 0 (0.0%) | 0 (0.0%) |
| 75 Years and over | 0 (0.0%) | 40 (30.8%) |
Disability Class: Vision Difficulty
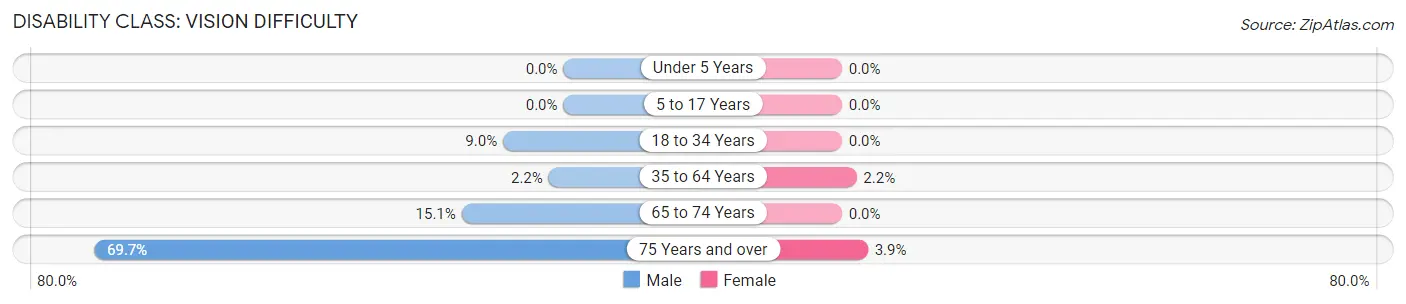
| Age Bracket | Male | Female |
| Under 5 Years | 0 (0.0%) | 0 (0.0%) |
| 5 to 17 Years | 0 (0.0%) | 0 (0.0%) |
| 18 to 34 Years | 43 (9.0%) | 0 (0.0%) |
| 35 to 64 Years | 29 (2.2%) | 28 (2.2%) |
| 65 to 74 Years | 21 (15.1%) | 0 (0.0%) |
| 75 Years and over | 23 (69.7%) | 5 (3.8%) |
Disability Class: Cognitive Difficulty
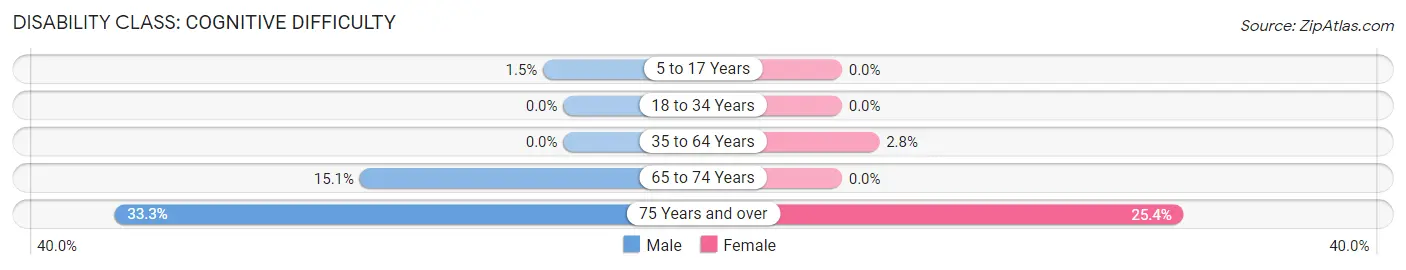
| Age Bracket | Male | Female |
| 5 to 17 Years | 11 (1.5%) | 0 (0.0%) |
| 18 to 34 Years | 0 (0.0%) | 0 (0.0%) |
| 35 to 64 Years | 0 (0.0%) | 36 (2.8%) |
| 65 to 74 Years | 21 (15.1%) | 0 (0.0%) |
| 75 Years and over | 11 (33.3%) | 33 (25.4%) |
Disability Class: Ambulatory Difficulty
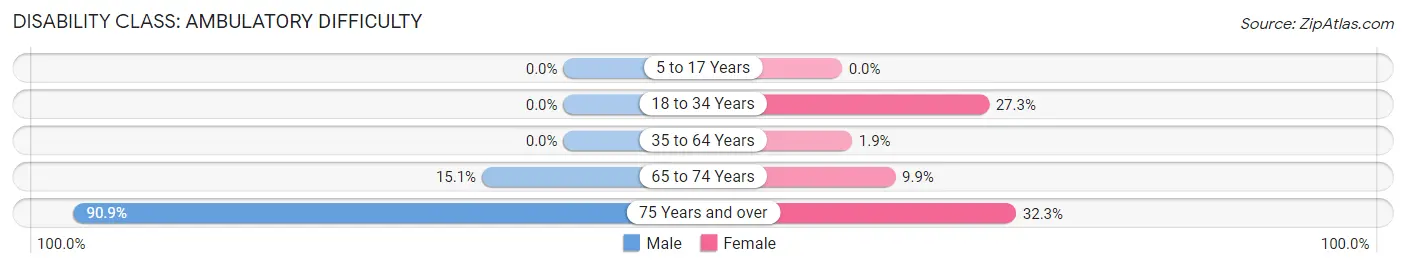
| Age Bracket | Male | Female |
| 5 to 17 Years | 0 (0.0%) | 0 (0.0%) |
| 18 to 34 Years | 0 (0.0%) | 126 (27.3%) |
| 35 to 64 Years | 0 (0.0%) | 24 (1.9%) |
| 65 to 74 Years | 21 (15.1%) | 9 (9.9%) |
| 75 Years and over | 30 (90.9%) | 42 (32.3%) |
Disability Class: Self-Care Difficulty
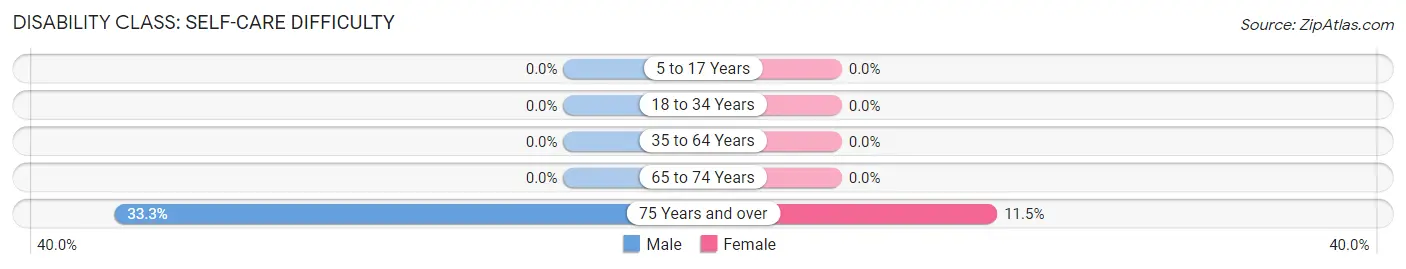
| Age Bracket | Male | Female |
| 5 to 17 Years | 0 (0.0%) | 0 (0.0%) |
| 18 to 34 Years | 0 (0.0%) | 0 (0.0%) |
| 35 to 64 Years | 0 (0.0%) | 0 (0.0%) |
| 65 to 74 Years | 0 (0.0%) | 0 (0.0%) |
| 75 Years and over | 11 (33.3%) | 15 (11.5%) |
Technology Access in Belle Mead
Computing Device Access in Belle Mead
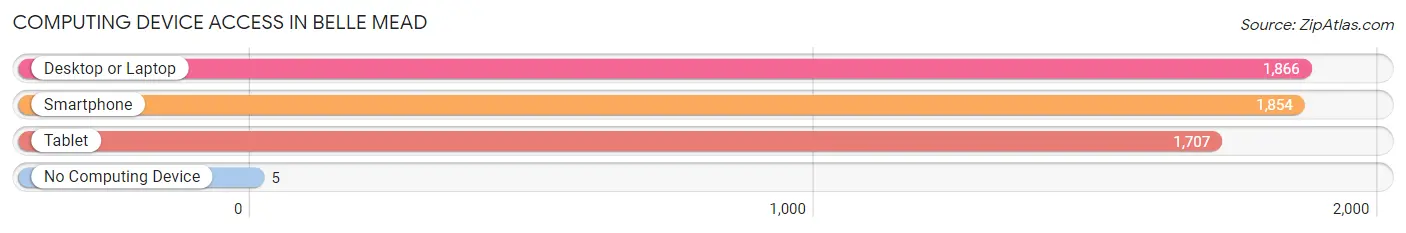
| Device Type | # Households | % Households |
| Desktop or Laptop | 1,866 | 98.4% |
| Smartphone | 1,854 | 97.7% |
| Tablet | 1,707 | 90.0% |
| No Computing Device | 5 | 0.3% |
| Total | 1,897 | 100.0% |
Internet Access in Belle Mead
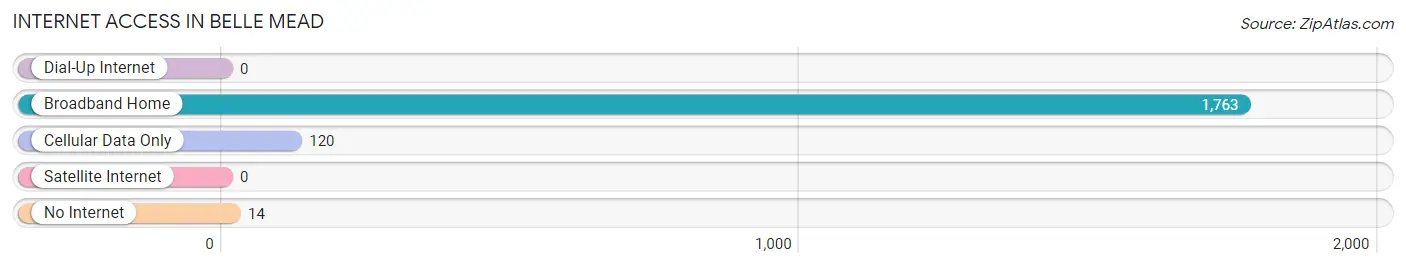
| Internet Type | # Households | % Households |
| Dial-Up Internet | 0 | 0.0% |
| Broadband Home | 1,763 | 92.9% |
| Cellular Data Only | 120 | 6.3% |
| Satellite Internet | 0 | 0.0% |
| No Internet | 14 | 0.7% |
| Total | 1,897 | 100.0% |
Belle Mead Summary
Belle Mead is an unincorporated community located in Montgomery Township, Somerset County, New Jersey. It is located within the Raritan Valley region of Central New Jersey. The area is known for its rural character and is home to many farms and horse farms.
History
Belle Mead was first settled in the late 1700s by Dutch and German immigrants. The area was originally known as "Mead's Corner" and was named after the Mead family who owned a large farm in the area. The name was later changed to Belle Mead in the late 1800s.
The area was primarily agricultural until the early 1900s when the railroad was built through the area. This allowed for the development of the area and the growth of the community. The area was also home to a number of mills and factories, including a paper mill, a grist mill, and a saw mill.
Geography
Belle Mead is located in Montgomery Township, Somerset County, New Jersey. It is located within the Raritan Valley region of Central New Jersey. The area is known for its rural character and is home to many farms and horse farms.
The area is located in the Sourland Mountains, a range of low hills that run through Central New Jersey. The area is also home to the Sourland Preserve, a protected area of over 4,000 acres of forest and wetlands.
Economy
Belle Mead is primarily a residential community, with most of its residents commuting to nearby cities for work. The area is home to a number of small businesses, including a few restaurants, a grocery store, and a few other retail stores.
The area is also home to a number of farms and horse farms. These farms provide a variety of products, including fruits, vegetables, eggs, and dairy products.
Demographics
As of the 2010 census, the population of Belle Mead was 2,845. The population is primarily white (90.3%) and the median age is 43.7 years. The median household income is $107,917 and the median home value is $521,000.
Belle Mead is a relatively affluent community, with a higher than average median income and home value. The area is also home to a number of well-educated residents, with over 50% of the population having a bachelor's degree or higher.
Common Questions
What is Per Capita Income in Belle Mead?
Per Capita income in Belle Mead is $67,106.
What is the Median Family Income in Belle Mead?
Median Family Income in Belle Mead is $213,125.
What is the Median Household income in Belle Mead?
Median Household Income in Belle Mead is $203,942.
What is Income or Wage Gap in Belle Mead?
Income or Wage Gap in Belle Mead is 49.9%.
Women in Belle Mead earn 50.1 cents for every dollar earned by a man.
What is Inequality or Gini Index in Belle Mead?
Inequality or Gini Index in Belle Mead is 0.35.
What is the Total Population of Belle Mead?
Total Population of Belle Mead is 5,867.
What is the Total Male Population of Belle Mead?
Total Male Population of Belle Mead is 3,023.
What is the Total Female Population of Belle Mead?
Total Female Population of Belle Mead is 2,844.
What is the Ratio of Males per 100 Females in Belle Mead?
There are 106.29 Males per 100 Females in Belle Mead.
What is the Ratio of Females per 100 Males in Belle Mead?
There are 94.08 Females per 100 Males in Belle Mead.
What is the Median Population Age in Belle Mead?
Median Population Age in Belle Mead is 35.9 Years.
What is the Average Family Size in Belle Mead
Average Family Size in Belle Mead is 3.4 People.
What is the Average Household Size in Belle Mead
Average Household Size in Belle Mead is 3.1 People.
How Large is the Labor Force in Belle Mead?
There are 3,166 People in the Labor Forcein in Belle Mead.
What is the Percentage of People in the Labor Force in Belle Mead?
77.3% of People are in the Labor Force in Belle Mead.
What is the Unemployment Rate in Belle Mead?
Unemployment Rate in Belle Mead is 3.0%.