Blawenburg, NJ Map & Demographics
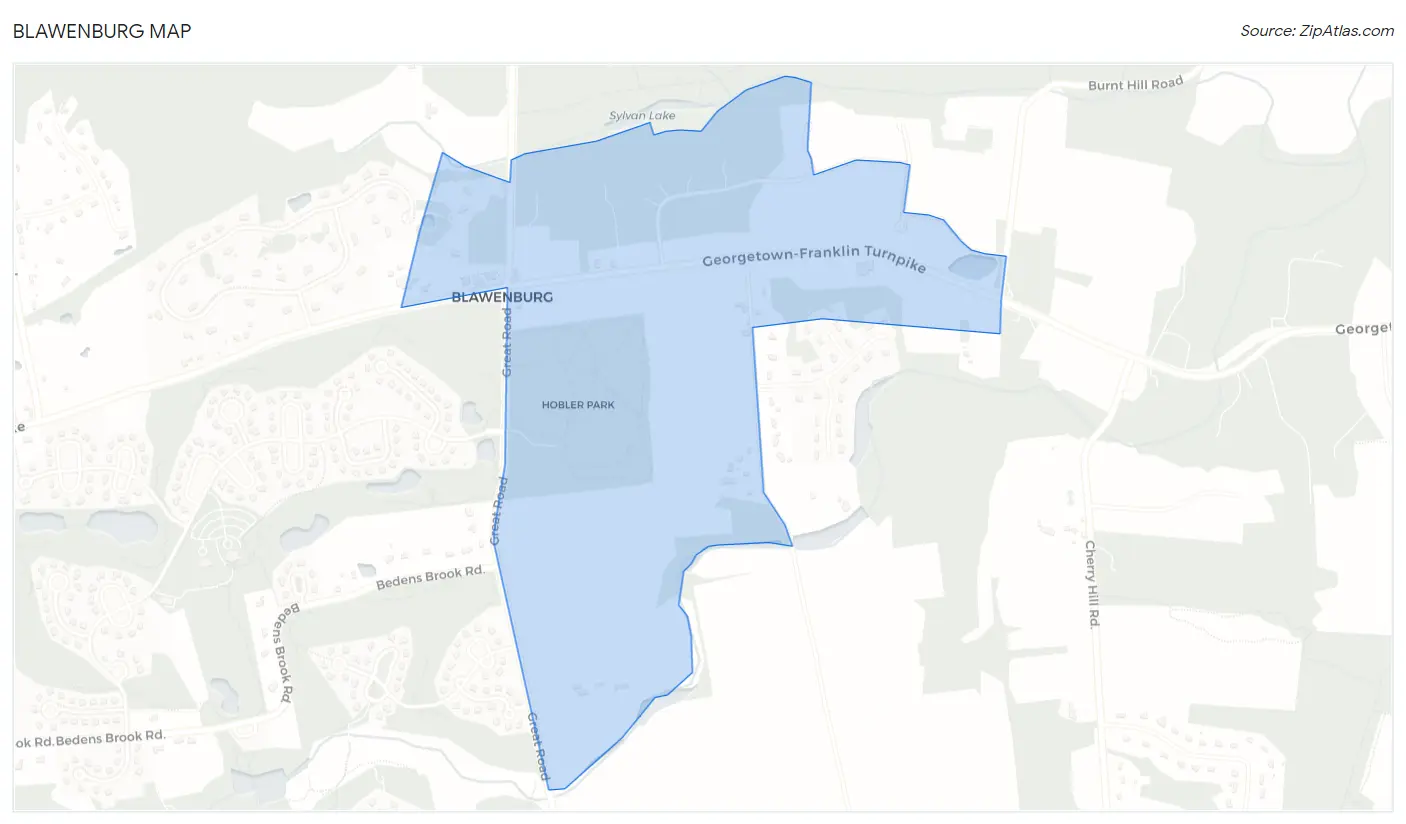
Blawenburg Map
Blawenburg Overview
$158,670
PER CAPITA INCOME
$250,001
AVG FAMILY INCOME
$250,001
AVG HOUSEHOLD INCOME
0.28
INEQUALITY / GINI INDEX
112
TOTAL POPULATION
50
MALE POPULATION
62
FEMALE POPULATION
80.65
MALES / 100 FEMALES
124.00
FEMALES / 100 MALES
54.4
MEDIAN AGE
2.4
AVG FAMILY SIZE
2.3
AVG HOUSEHOLD SIZE
112
LABOR FORCE [ PEOPLE ]
100.0%
PERCENT IN LABOR FORCE
11.6%
UNEMPLOYMENT RATE
Blawenburg Area Codes
Income in Blawenburg
Income Overview in Blawenburg
Per Capita Income in Blawenburg is $158,670, while median incomes of families and households are $250,001 and $250,001 respectively.
| Characteristic | Number | Measure |
| Per Capita Income | 112 | $158,670 |
| Median Family Income | 39 | $250,001 |
| Mean Family Income | 39 | $409,621 |
| Median Household Income | 49 | $250,001 |
| Mean Household Income | 49 | $356,524 |
| Income Deficit | 39 | $0 |
| Wage / Income Gap (%) | 112 | 0.00% |
| Wage / Income Gap ($) | 112 | 100.00¢ per $1 |
| Gini / Inequality Index | 112 | 0.28 |
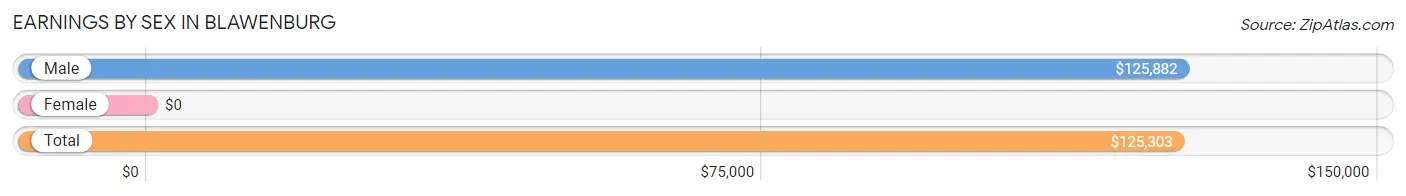
Earnings by Sex in Blawenburg
| Sex | Number | Average Earnings |
| Male | 50 (44.6%) | $125,882 |
| Female | 62 (55.4%) | $0 |
| Total | 112 (100.0%) | $125,303 |
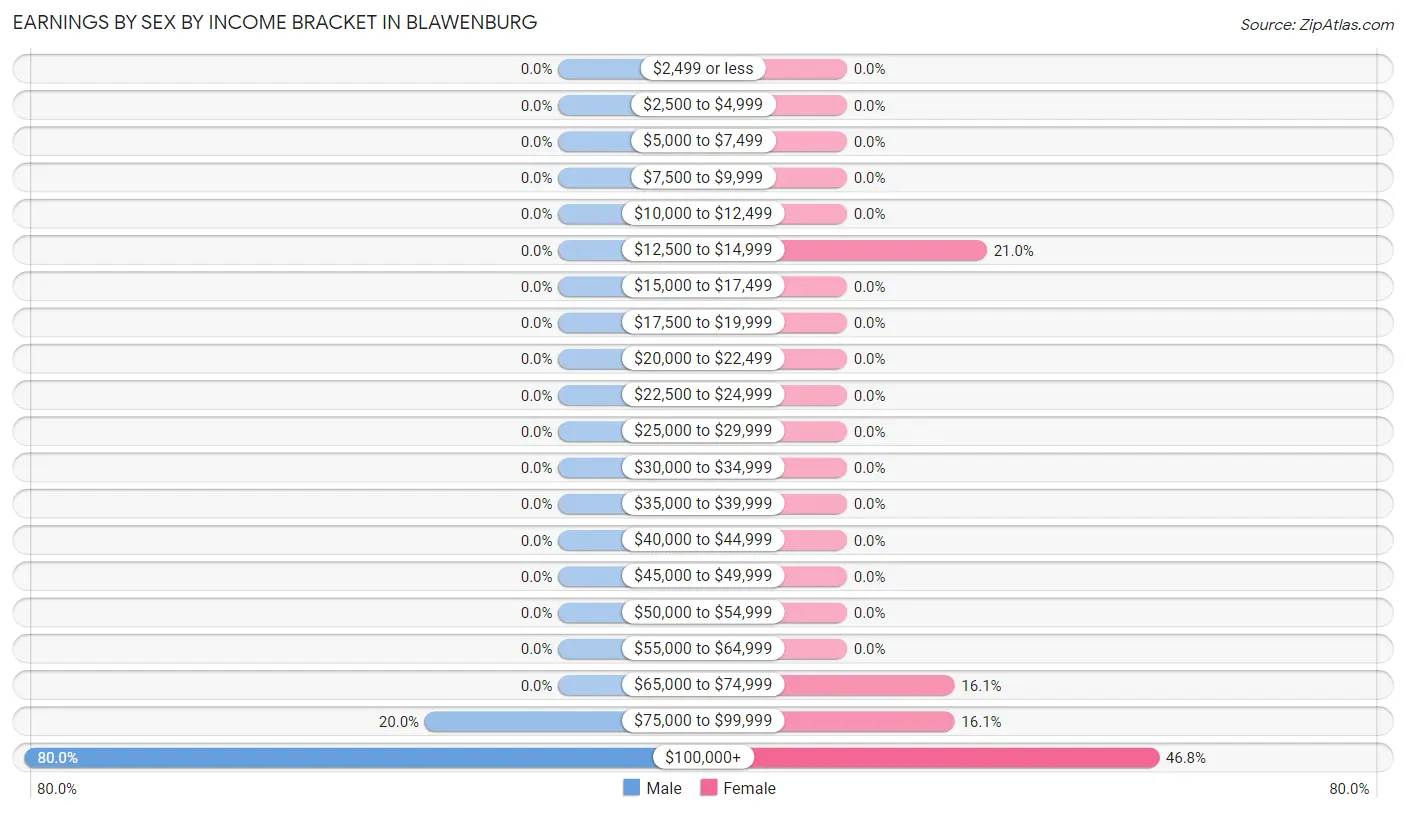
Earnings by Sex by Income Bracket in Blawenburg
The most common earnings brackets in Blawenburg are $100,000+ for men (40 | 80.0%) and $100,000+ for women (29 | 46.8%).
| Income | Male | Female |
| $2,499 or less | 0 (0.0%) | 0 (0.0%) |
| $2,500 to $4,999 | 0 (0.0%) | 0 (0.0%) |
| $5,000 to $7,499 | 0 (0.0%) | 0 (0.0%) |
| $7,500 to $9,999 | 0 (0.0%) | 0 (0.0%) |
| $10,000 to $12,499 | 0 (0.0%) | 0 (0.0%) |
| $12,500 to $14,999 | 0 (0.0%) | 13 (21.0%) |
| $15,000 to $17,499 | 0 (0.0%) | 0 (0.0%) |
| $17,500 to $19,999 | 0 (0.0%) | 0 (0.0%) |
| $20,000 to $22,499 | 0 (0.0%) | 0 (0.0%) |
| $22,500 to $24,999 | 0 (0.0%) | 0 (0.0%) |
| $25,000 to $29,999 | 0 (0.0%) | 0 (0.0%) |
| $30,000 to $34,999 | 0 (0.0%) | 0 (0.0%) |
| $35,000 to $39,999 | 0 (0.0%) | 0 (0.0%) |
| $40,000 to $44,999 | 0 (0.0%) | 0 (0.0%) |
| $45,000 to $49,999 | 0 (0.0%) | 0 (0.0%) |
| $50,000 to $54,999 | 0 (0.0%) | 0 (0.0%) |
| $55,000 to $64,999 | 0 (0.0%) | 0 (0.0%) |
| $65,000 to $74,999 | 0 (0.0%) | 10 (16.1%) |
| $75,000 to $99,999 | 10 (20.0%) | 10 (16.1%) |
| $100,000+ | 40 (80.0%) | 29 (46.8%) |
| Total | 50 (100.0%) | 62 (100.0%) |
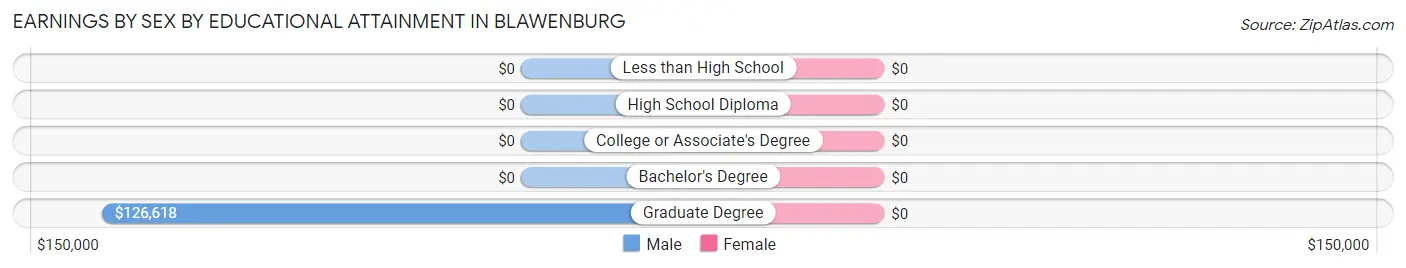
Earnings by Sex by Educational Attainment in Blawenburg
| Educational Attainment | Male Income | Female Income |
| Less than High School | - | - |
| High School Diploma | - | - |
| College or Associate's Degree | - | - |
| Bachelor's Degree | - | - |
| Graduate Degree | $126,618 | $0 |
| Total | $125,882 | $0 |
Family Income in Blawenburg
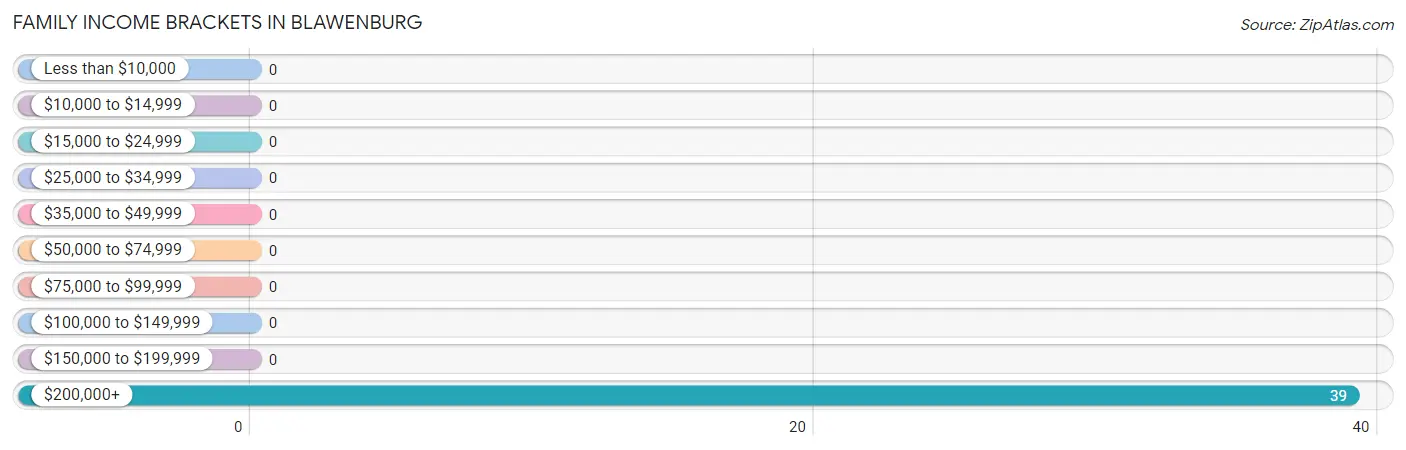
Family Income Brackets in Blawenburg
According to the Blawenburg family income data, there are 39 families falling into the $200,000+ income range, which is the most common income bracket and makes up 100.0% of all families.
| Income Bracket | # Families | % Families |
| Less than $10,000 | 0 | 0.0% |
| $10,000 to $14,999 | 0 | 0.0% |
| $15,000 to $24,999 | 0 | 0.0% |
| $25,000 to $34,999 | 0 | 0.0% |
| $35,000 to $49,999 | 0 | 0.0% |
| $50,000 to $74,999 | 0 | 0.0% |
| $75,000 to $99,999 | 0 | 0.0% |
| $100,000 to $149,999 | 0 | 0.0% |
| $150,000 to $199,999 | 0 | 0.0% |
| $200,000+ | 39 | 100.0% |
Family Income by Famaliy Size in Blawenburg
| Income Bracket | # Families | Median Income |
| 2-Person Families | 30 (76.9%) | $0 |
| 3-Person Families | 9 (23.1%) | $0 |
| 4-Person Families | 0 (0.0%) | $0 |
| 5-Person Families | 0 (0.0%) | $0 |
| 6-Person Families | 0 (0.0%) | $0 |
| 7+ Person Families | 0 (0.0%) | $0 |
| Total | 39 (100.0%) | $250,001 |
Family Income by Number of Earners in Blawenburg
| Number of Earners | # Families | Median Income |
| No Earners | 0 (0.0%) | $0 |
| 1 Earner | 0 (0.0%) | $0 |
| 2 Earners | 30 (76.9%) | $0 |
| 3+ Earners | 9 (23.1%) | $0 |
| Total | 39 (100.0%) | $250,001 |
Household Income in Blawenburg
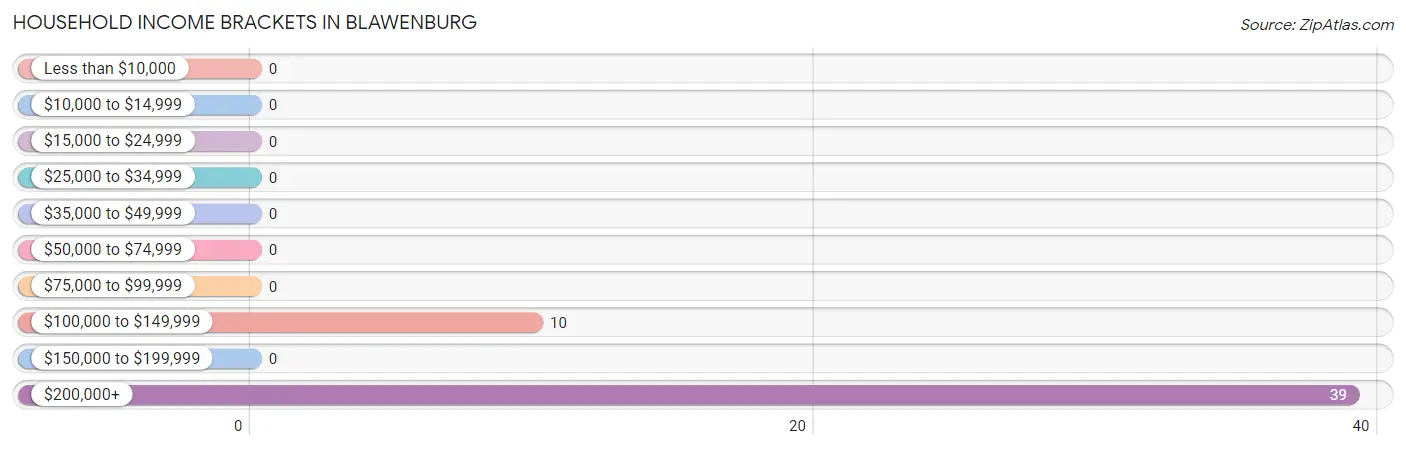
Household Income Brackets in Blawenburg
With 39 households falling in the category, the $200,000+ income range is the most frequent in Blawenburg, accounting for 79.6% of all households.
| Income Bracket | # Households | % Households |
| Less than $10,000 | 0 | 0.0% |
| $10,000 to $14,999 | 0 | 0.0% |
| $15,000 to $24,999 | 0 | 0.0% |
| $25,000 to $34,999 | 0 | 0.0% |
| $35,000 to $49,999 | 0 | 0.0% |
| $50,000 to $74,999 | 0 | 0.0% |
| $75,000 to $99,999 | 0 | 0.0% |
| $100,000 to $149,999 | 10 | 20.4% |
| $150,000 to $199,999 | 0 | 0.0% |
| $200,000+ | 39 | 79.6% |
Household Income by Householder Age in Blawenburg
| Income Bracket | # Households | Median Income |
| 15 to 24 Years | 0 (0.0%) | $0 |
| 25 to 44 Years | 10 (20.4%) | $0 |
| 45 to 64 Years | 26 (53.1%) | $0 |
| 65+ Years | 13 (26.5%) | $0 |
| Total | 49 (100.0%) | $250,001 |
Poverty in Blawenburg
Income Below Poverty by Sex and Age in Blawenburg
| Age Bracket | Male | Female |
| Under 5 Years | 0 (0.0%) | 0 (0.0%) |
| 5 Years | 0 (0.0%) | 0 (0.0%) |
| 6 to 11 Years | 0 (0.0%) | 0 (0.0%) |
| 12 to 14 Years | 0 (0.0%) | 0 (0.0%) |
| 15 Years | 0 (0.0%) | 0 (0.0%) |
| 16 and 17 Years | 0 (0.0%) | 0 (0.0%) |
| 18 to 24 Years | 0 (0.0%) | 0 (0.0%) |
| 25 to 34 Years | 0 (0.0%) | 0 (0.0%) |
| 35 to 44 Years | 0 (0.0%) | 0 (0.0%) |
| 45 to 54 Years | 0 (0.0%) | 0 (0.0%) |
| 55 to 64 Years | 0 (0.0%) | 0 (0.0%) |
| 65 to 74 Years | 0 (0.0%) | 0 (0.0%) |
| 75 Years and over | 0 (0.0%) | 0 (0.0%) |
| Total | 0 (0.0%) | 0 (0.0%) |
Income Above Poverty by Sex and Age in Blawenburg
According to the poverty statistics in Blawenburg, males aged 25 to 34 years and females aged 25 to 34 years are the age groups that are most secure financially, with 100.0% of males and 100.0% of females in these age groups living above the poverty line.
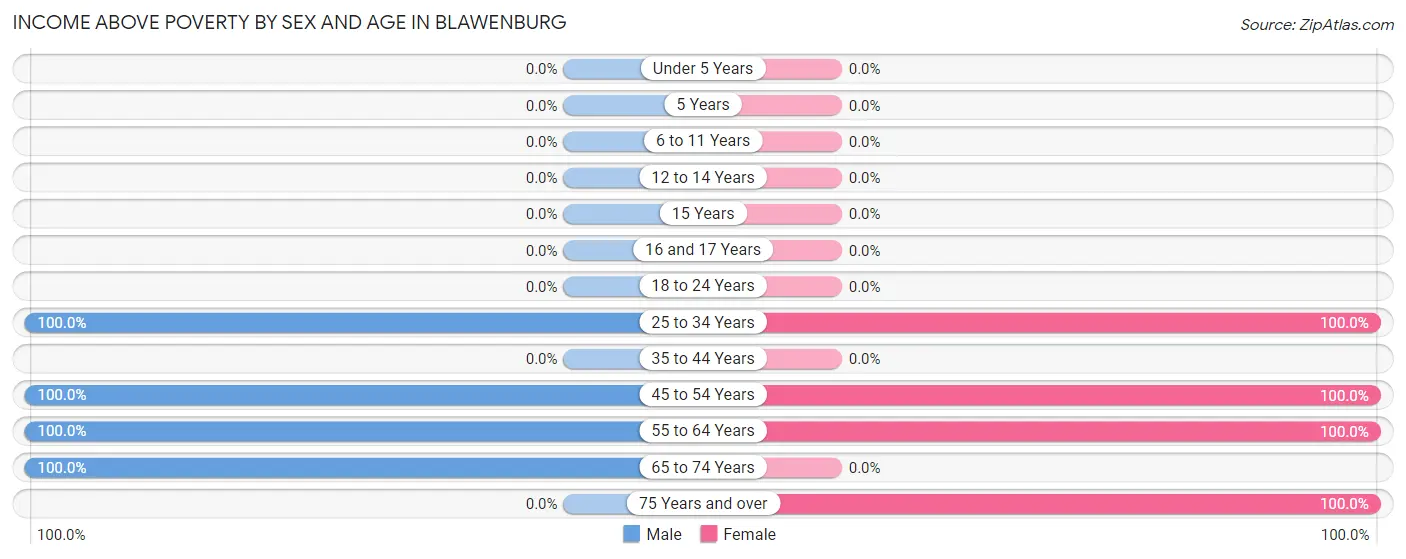
| Age Bracket | Male | Female |
| Under 5 Years | 0 (0.0%) | 0 (0.0%) |
| 5 Years | 0 (0.0%) | 0 (0.0%) |
| 6 to 11 Years | 0 (0.0%) | 0 (0.0%) |
| 12 to 14 Years | 0 (0.0%) | 0 (0.0%) |
| 15 Years | 0 (0.0%) | 0 (0.0%) |
| 16 and 17 Years | 0 (0.0%) | 0 (0.0%) |
| 18 to 24 Years | 0 (0.0%) | 0 (0.0%) |
| 25 to 34 Years | 10 (100.0%) | 23 (100.0%) |
| 35 to 44 Years | 0 (0.0%) | 0 (0.0%) |
| 45 to 54 Years | 17 (100.0%) | 16 (100.0%) |
| 55 to 64 Years | 9 (100.0%) | 10 (100.0%) |
| 65 to 74 Years | 14 (100.0%) | 0 (0.0%) |
| 75 Years and over | 0 (0.0%) | 13 (100.0%) |
| Total | 50 (100.0%) | 62 (100.0%) |
Income Below Poverty Among Married-Couple Families in Blawenburg
| Children | Above Poverty | Below Poverty |
| No Children | 39 (100.0%) | 0 (0.0%) |
| 1 or 2 Children | 0 (0.0%) | 0 (0.0%) |
| 3 or 4 Children | 0 (0.0%) | 0 (0.0%) |
| 5 or more Children | 0 (0.0%) | 0 (0.0%) |
| Total | 39 (100.0%) | 0 (0.0%) |
Income Below Poverty Among Single-Parent Households in Blawenburg
| Children | Single Father | Single Mother |
| No Children | 0 (0.0%) | 0 (0.0%) |
| 1 or 2 Children | 0 (0.0%) | 0 (0.0%) |
| 3 or 4 Children | 0 (0.0%) | 0 (0.0%) |
| 5 or more Children | 0 (0.0%) | 0 (0.0%) |
| Total | 0 (0.0%) | 0 (0.0%) |
Income Below Poverty Among Married-Couple vs Single-Parent Households in Blawenburg
| Children | Married-Couple Families | Single-Parent Households |
| No Children | 0 (0.0%) | 0 (0.0%) |
| 1 or 2 Children | 0 (0.0%) | 0 (0.0%) |
| 3 or 4 Children | 0 (0.0%) | 0 (0.0%) |
| 5 or more Children | 0 (0.0%) | 0 (0.0%) |
| Total | 0 (0.0%) | 0 (0.0%) |
Race in Blawenburg
The most populous races in Blawenburg are White / Caucasian (79 | 70.5%), and Asian (33 | 29.5%).
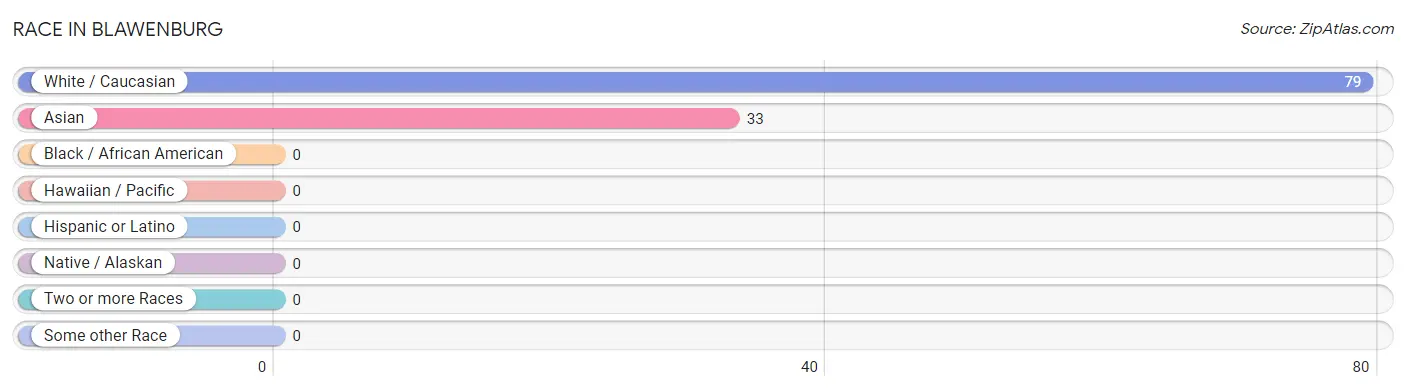
| Race | # Population | % Population |
| Asian | 33 | 29.5% |
| Black / African American | 0 | 0.0% |
| Hawaiian / Pacific | 0 | 0.0% |
| Hispanic or Latino | 0 | 0.0% |
| Native / Alaskan | 0 | 0.0% |
| White / Caucasian | 79 | 70.5% |
| Two or more Races | 0 | 0.0% |
| Some other Race | 0 | 0.0% |
| Total | 112 | 100.0% |
Ancestry in Blawenburg
The most populous ancestries reported in Blawenburg are Thai (33 | 29.5%), Italian (19 | 17.0%), Polish (14 | 12.5%), European (13 | 11.6%), and Croatian (10 | 8.9%), together accounting for 79.5% of all Blawenburg residents.
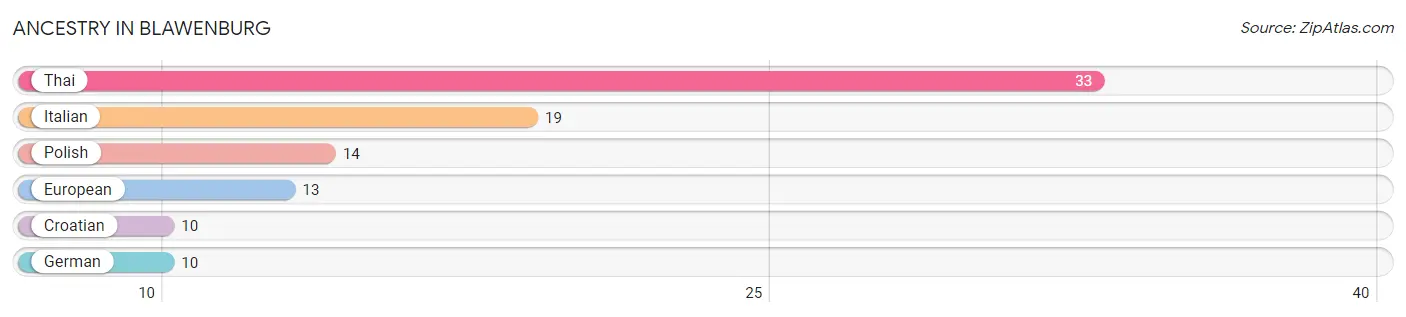
| Ancestry | # Population | % Population |
| Croatian | 10 | 8.9% |
| European | 13 | 11.6% |
| German | 10 | 8.9% |
| Italian | 19 | 17.0% |
| Polish | 14 | 12.5% |
| Thai | 33 | 29.5% | View All 6 Rows |
Immigrants in Blawenburg

| Immigration Origin | # Population | % Population | View All 0 Rows |
Sex and Age in Blawenburg
Sex and Age in Blawenburg
The most populous age groups in Blawenburg are 50 to 54 Years (17 | 34.0%) for men and 50 to 54 Years (16 | 25.8%) for women.
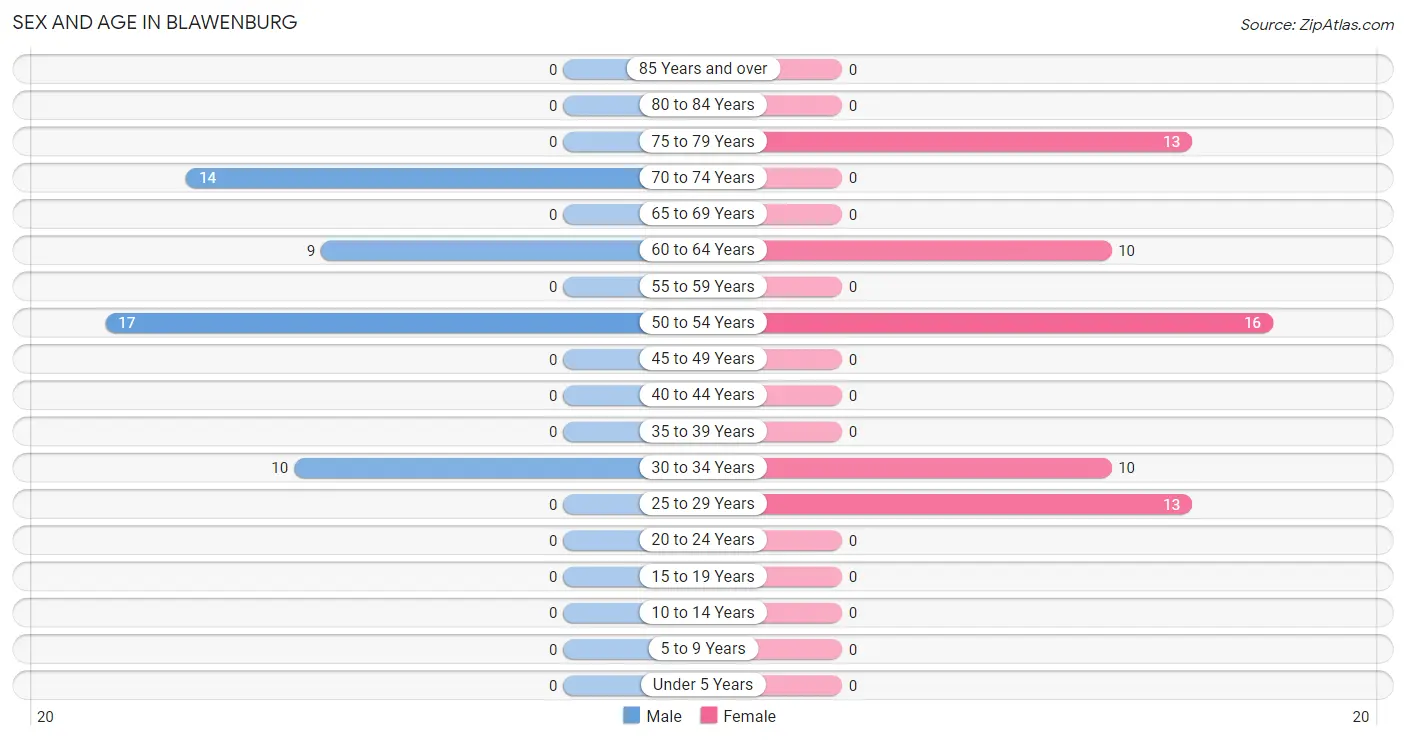
| Age Bracket | Male | Female |
| Under 5 Years | 0 (0.0%) | 0 (0.0%) |
| 5 to 9 Years | 0 (0.0%) | 0 (0.0%) |
| 10 to 14 Years | 0 (0.0%) | 0 (0.0%) |
| 15 to 19 Years | 0 (0.0%) | 0 (0.0%) |
| 20 to 24 Years | 0 (0.0%) | 0 (0.0%) |
| 25 to 29 Years | 0 (0.0%) | 13 (21.0%) |
| 30 to 34 Years | 10 (20.0%) | 10 (16.1%) |
| 35 to 39 Years | 0 (0.0%) | 0 (0.0%) |
| 40 to 44 Years | 0 (0.0%) | 0 (0.0%) |
| 45 to 49 Years | 0 (0.0%) | 0 (0.0%) |
| 50 to 54 Years | 17 (34.0%) | 16 (25.8%) |
| 55 to 59 Years | 0 (0.0%) | 0 (0.0%) |
| 60 to 64 Years | 9 (18.0%) | 10 (16.1%) |
| 65 to 69 Years | 0 (0.0%) | 0 (0.0%) |
| 70 to 74 Years | 14 (28.0%) | 0 (0.0%) |
| 75 to 79 Years | 0 (0.0%) | 13 (21.0%) |
| 80 to 84 Years | 0 (0.0%) | 0 (0.0%) |
| 85 Years and over | 0 (0.0%) | 0 (0.0%) |
| Total | 50 (100.0%) | 62 (100.0%) |
Families and Households in Blawenburg
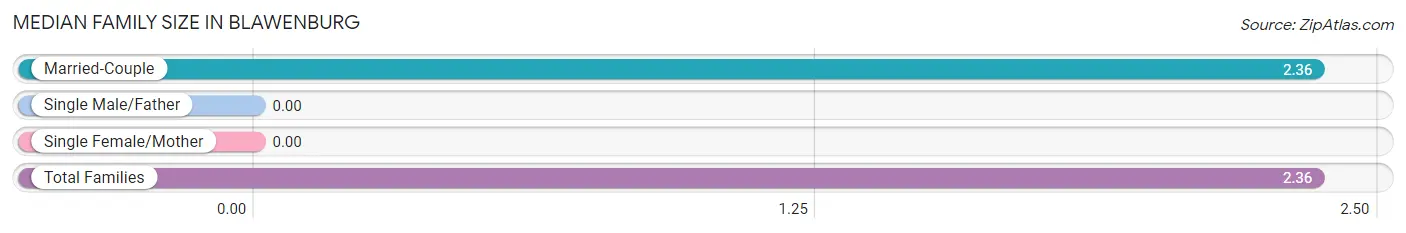
Median Family Size in Blawenburg
| Family Type | # Families | Family Size |
| Married-Couple | 39 (100.0%) | 2.36 |
| Single Male/Father | 0 (0.0%) | - |
| Single Female/Mother | 0 (0.0%) | - |
| Total Families | 39 (100.0%) | 2.36 |
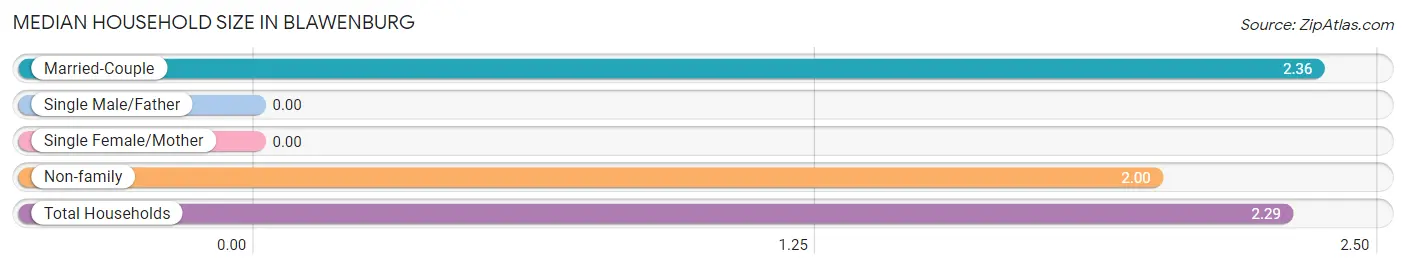
Median Household Size in Blawenburg
| Household Type | # Households | Household Size |
| Married-Couple | 39 (79.6%) | 2.36 |
| Single Male/Father | 0 (0.0%) | - |
| Single Female/Mother | 0 (0.0%) | - |
| Non-family | 10 (20.4%) | 2.00 |
| Total Households | 49 (100.0%) | 2.29 |
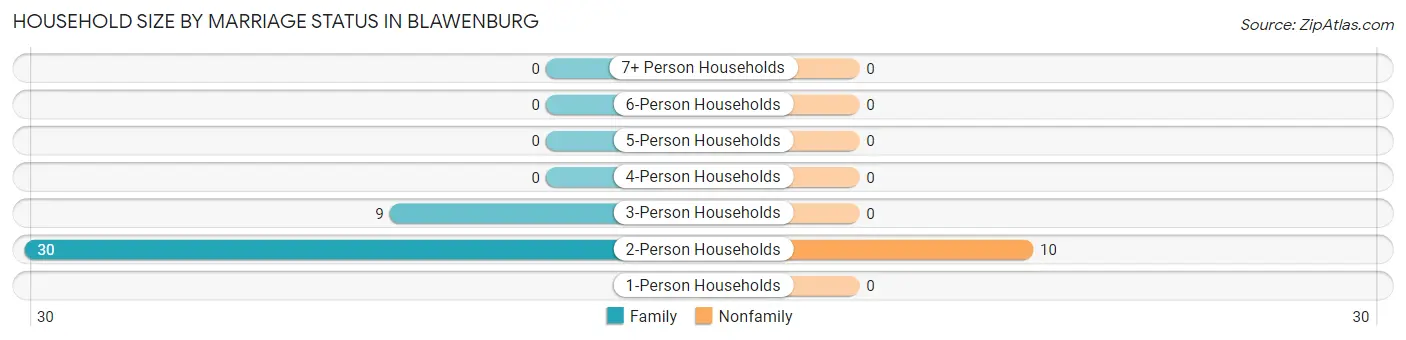
Household Size by Marriage Status in Blawenburg
Out of a total of 49 households in Blawenburg, 39 (79.6%) are family households, while 10 (20.4%) are nonfamily households. The most numerous type of family households are 2-person households, comprising 30, and the most common type of nonfamily households are 2-person households, comprising 10.
| Household Size | Family Households | Nonfamily Households |
| 1-Person Households | - | 0 (0.0%) |
| 2-Person Households | 30 (61.2%) | 10 (20.4%) |
| 3-Person Households | 9 (18.4%) | 0 (0.0%) |
| 4-Person Households | 0 (0.0%) | 0 (0.0%) |
| 5-Person Households | 0 (0.0%) | 0 (0.0%) |
| 6-Person Households | 0 (0.0%) | 0 (0.0%) |
| 7+ Person Households | 0 (0.0%) | 0 (0.0%) |
| Total | 39 (79.6%) | 10 (20.4%) |
Female Fertility in Blawenburg
Fertility by Age in Blawenburg
| Age Bracket | Women with Births | Births / 1,000 Women |
| 15 to 19 years | 0 (0.0%) | 0.0 |
| 20 to 34 years | 0 (0.0%) | 0.0 |
| 35 to 50 years | 0 (0.0%) | 0.0 |
| Total | 0 (0.0%) | 0.0 |
Fertility by Age by Marriage Status in Blawenburg
| Age Bracket | Married | Unmarried |
| 15 to 19 years | 0 (0.0%) | 0 (0.0%) |
| 20 to 34 years | 0 (0.0%) | 0 (0.0%) |
| 35 to 50 years | 0 (0.0%) | 0 (0.0%) |
| Total | 0 (0.0%) | 0 (0.0%) |
Fertility by Education in Blawenburg
| Educational Attainment | Women with Births | Births / 1,000 Women |
| Less than High School | 0 (0.0%) | 0.0 |
| High School Diploma | 0 (0.0%) | 0.0 |
| College or Associate's Degree | 0 (0.0%) | 0.0 |
| Bachelor's Degree | 0 (0.0%) | 0.0 |
| Graduate Degree | 0 (0.0%) | 0.0 |
| Total | 0 (0.0%) | 0.0 |
Fertility by Education by Marriage Status in Blawenburg
| Educational Attainment | Married | Unmarried |
| Less than High School | 0 (0.0%) | 0 (0.0%) |
| High School Diploma | 0 (0.0%) | 0 (0.0%) |
| College or Associate's Degree | 0 (0.0%) | 0 (0.0%) |
| Bachelor's Degree | 0 (0.0%) | 0 (0.0%) |
| Graduate Degree | 0 (0.0%) | 0 (0.0%) |
| Total | 0 (0.0%) | 0 (0.0%) |
Employment Characteristics in Blawenburg
Employment by Class of Employer in Blawenburg
Among the 99 employed individuals in Blawenburg, private company employees (46 | 46.5%), self-employed (incorporated) (19 | 19.2%), and not-for-profit organizations (14 | 14.1%) make up the most common classes of employment.
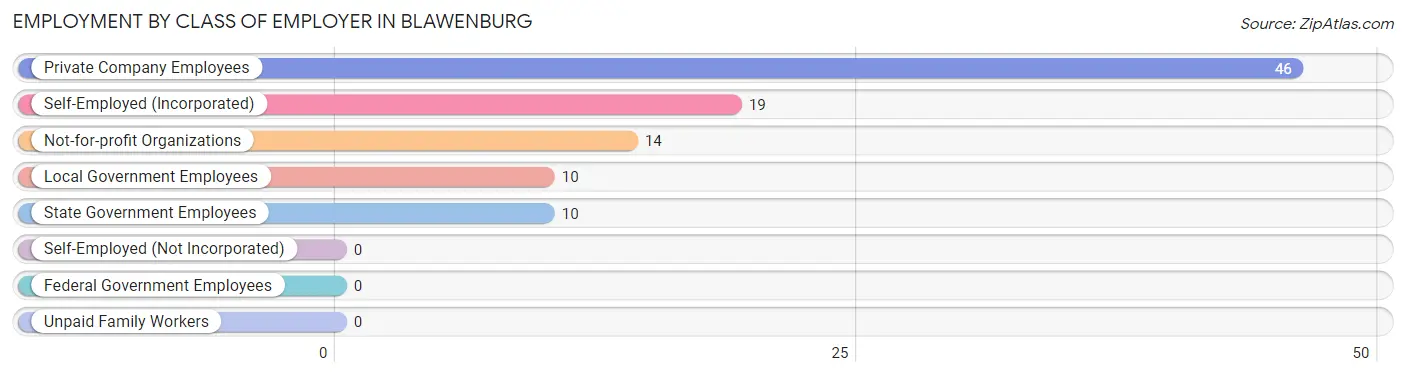
| Employer Class | # Employees | % Employees |
| Private Company Employees | 46 | 46.5% |
| Self-Employed (Incorporated) | 19 | 19.2% |
| Self-Employed (Not Incorporated) | 0 | 0.0% |
| Not-for-profit Organizations | 14 | 14.1% |
| Local Government Employees | 10 | 10.1% |
| State Government Employees | 10 | 10.1% |
| Federal Government Employees | 0 | 0.0% |
| Unpaid Family Workers | 0 | 0.0% |
| Total | 99 | 100.0% |
Employment Status by Age in Blawenburg
According to the labor force statistics for Blawenburg, out of the total population over 16 years of age (112), 100.0% or 112 individuals are in the labor force, with 11.6% or 13 of them unemployed. The age group with the highest labor force participation rate is 25 to 29 years, with 100.0% or 13 individuals in the labor force. Within the labor force, the 25 to 29 years age range has the highest percentage of unemployed individuals, with 100.0% or 13 of them being unemployed.
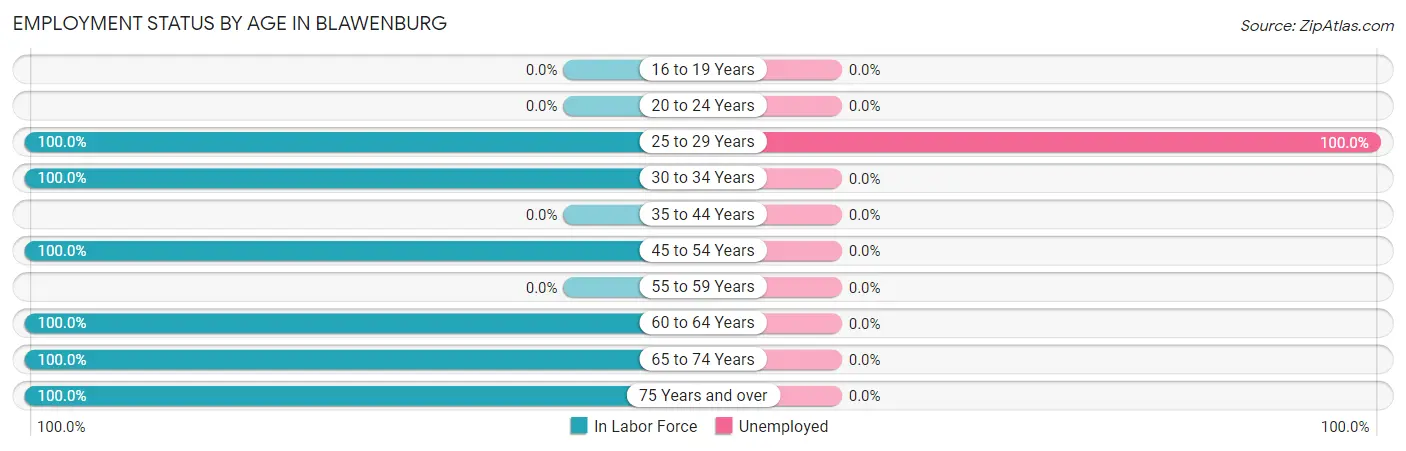
| Age Bracket | In Labor Force | Unemployed |
| 16 to 19 Years | 0 (0.0%) | 0 (0.0%) |
| 20 to 24 Years | 0 (0.0%) | 0 (0.0%) |
| 25 to 29 Years | 13 (100.0%) | 13 (100.0%) |
| 30 to 34 Years | 20 (100.0%) | 0 (0.0%) |
| 35 to 44 Years | 0 (0.0%) | 0 (0.0%) |
| 45 to 54 Years | 33 (100.0%) | 0 (0.0%) |
| 55 to 59 Years | 0 (0.0%) | 0 (0.0%) |
| 60 to 64 Years | 19 (100.0%) | 0 (0.0%) |
| 65 to 74 Years | 14 (100.0%) | 0 (0.0%) |
| 75 Years and over | 13 (100.0%) | 0 (0.0%) |
| Total | 112 (100.0%) | 13 (11.6%) |
Employment Status by Educational Attainment in Blawenburg
According to labor force statistics for Blawenburg, 100.0% of individuals (85) out of the total population between 25 and 64 years of age (85) are in the labor force, with 15.3% or 13 of them being unemployed. The group with the highest labor force participation rate are those with the educational attainment of college / associate degree, with 100.0% or 13 individuals in the labor force. Within the labor force, individuals with college / associate degree education have the highest percentage of unemployment, with 100.0% or 13 of them being unemployed.
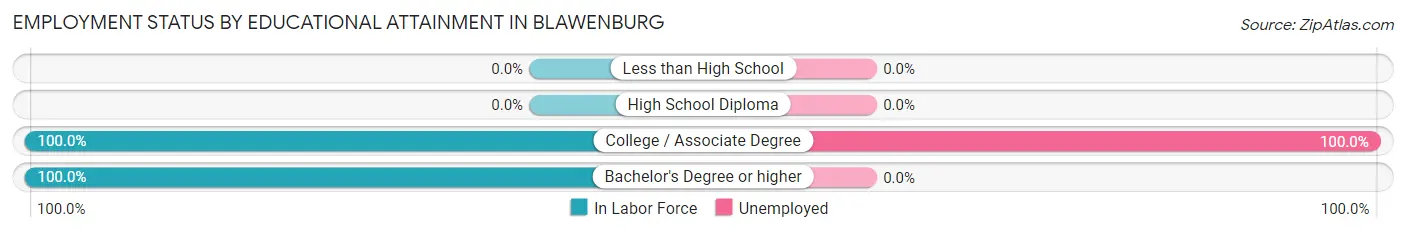
| Educational Attainment | In Labor Force | Unemployed |
| Less than High School | 0 (0.0%) | 0 (0.0%) |
| High School Diploma | 0 (0.0%) | 0 (0.0%) |
| College / Associate Degree | 13 (100.0%) | 13 (100.0%) |
| Bachelor's Degree or higher | 72 (100.0%) | 0 (0.0%) |
| Total | 85 (100.0%) | 13 (15.3%) |
Employment Occupations by Sex in Blawenburg
Management, Business, Science and Arts Occupations
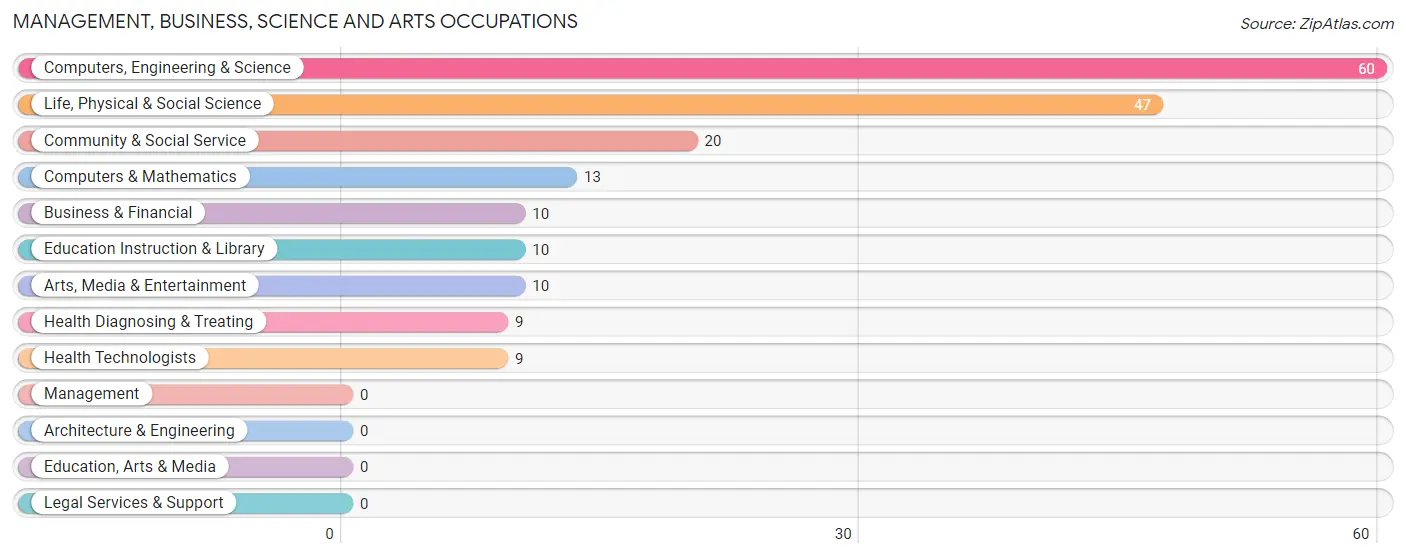
The most common Management, Business, Science and Arts occupations in Blawenburg are Computers, Engineering & Science (60 | 60.6%), Life, Physical & Social Science (47 | 47.5%), Community & Social Service (20 | 20.2%), Computers & Mathematics (13 | 13.1%), and Business & Financial (10 | 10.1%).
Management, Business, Science and Arts Occupations by Sex
Within the Management, Business, Science and Arts occupations in Blawenburg, the most male-oriented occupations are Business & Financial (100.0%), Health Diagnosing & Treating (100.0%), and Health Technologists (100.0%), while the most female-oriented occupations are Computers & Mathematics (100.0%), Community & Social Service (100.0%), and Education Instruction & Library (100.0%).
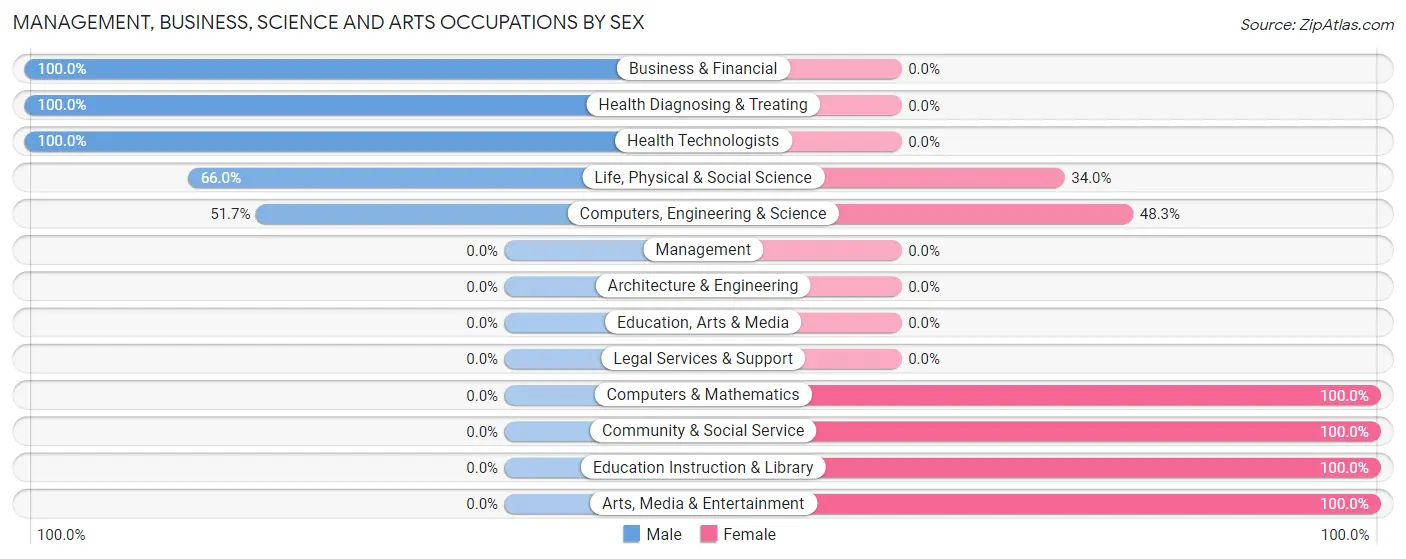
| Occupation | Male | Female |
| Management | 0 (0.0%) | 0 (0.0%) |
| Business & Financial | 10 (100.0%) | 0 (0.0%) |
| Computers, Engineering & Science | 31 (51.7%) | 29 (48.3%) |
| Computers & Mathematics | 0 (0.0%) | 13 (100.0%) |
| Architecture & Engineering | 0 (0.0%) | 0 (0.0%) |
| Life, Physical & Social Science | 31 (66.0%) | 16 (34.0%) |
| Community & Social Service | 0 (0.0%) | 20 (100.0%) |
| Education, Arts & Media | 0 (0.0%) | 0 (0.0%) |
| Legal Services & Support | 0 (0.0%) | 0 (0.0%) |
| Education Instruction & Library | 0 (0.0%) | 10 (100.0%) |
| Arts, Media & Entertainment | 0 (0.0%) | 10 (100.0%) |
| Health Diagnosing & Treating | 9 (100.0%) | 0 (0.0%) |
| Health Technologists | 9 (100.0%) | 0 (0.0%) |
| Total (Category) | 50 (50.5%) | 49 (49.5%) |
| Total (Overall) | 50 (50.5%) | 49 (49.5%) |
Services Occupations
Services Occupations by Sex
| Occupation | Male | Female |
| Healthcare Support | 0 (0.0%) | 0 (0.0%) |
| Security & Protection | 0 (0.0%) | 0 (0.0%) |
| Firefighting & Prevention | 0 (0.0%) | 0 (0.0%) |
| Law Enforcement | 0 (0.0%) | 0 (0.0%) |
| Food Preparation & Serving | 0 (0.0%) | 0 (0.0%) |
| Cleaning & Maintenance | 0 (0.0%) | 0 (0.0%) |
| Personal Care & Service | 0 (0.0%) | 0 (0.0%) |
| Total (Category) | 0 (0.0%) | 0 (0.0%) |
| Total (Overall) | 50 (50.5%) | 49 (49.5%) |
Sales and Office Occupations

Sales and Office Occupations by Sex
| Occupation | Male | Female |
| Sales & Related | 0 (0.0%) | 0 (0.0%) |
| Office & Administration | 0 (0.0%) | 0 (0.0%) |
| Total (Category) | 0 (0.0%) | 0 (0.0%) |
| Total (Overall) | 50 (50.5%) | 49 (49.5%) |
Natural Resources, Construction and Maintenance Occupations
Natural Resources, Construction and Maintenance Occupations by Sex
| Occupation | Male | Female |
| Farming, Fishing & Forestry | 0 (0.0%) | 0 (0.0%) |
| Construction & Extraction | 0 (0.0%) | 0 (0.0%) |
| Installation, Maintenance & Repair | 0 (0.0%) | 0 (0.0%) |
| Total (Category) | 0 (0.0%) | 0 (0.0%) |
| Total (Overall) | 50 (50.5%) | 49 (49.5%) |
Production, Transportation and Moving Occupations
Production, Transportation and Moving Occupations by Sex
| Occupation | Male | Female |
| Production | 0 (0.0%) | 0 (0.0%) |
| Transportation | 0 (0.0%) | 0 (0.0%) |
| Material Moving | 0 (0.0%) | 0 (0.0%) |
| Total (Category) | 0 (0.0%) | 0 (0.0%) |
| Total (Overall) | 50 (50.5%) | 49 (49.5%) |
Employment Industries by Sex in Blawenburg
Employment Industries in Blawenburg
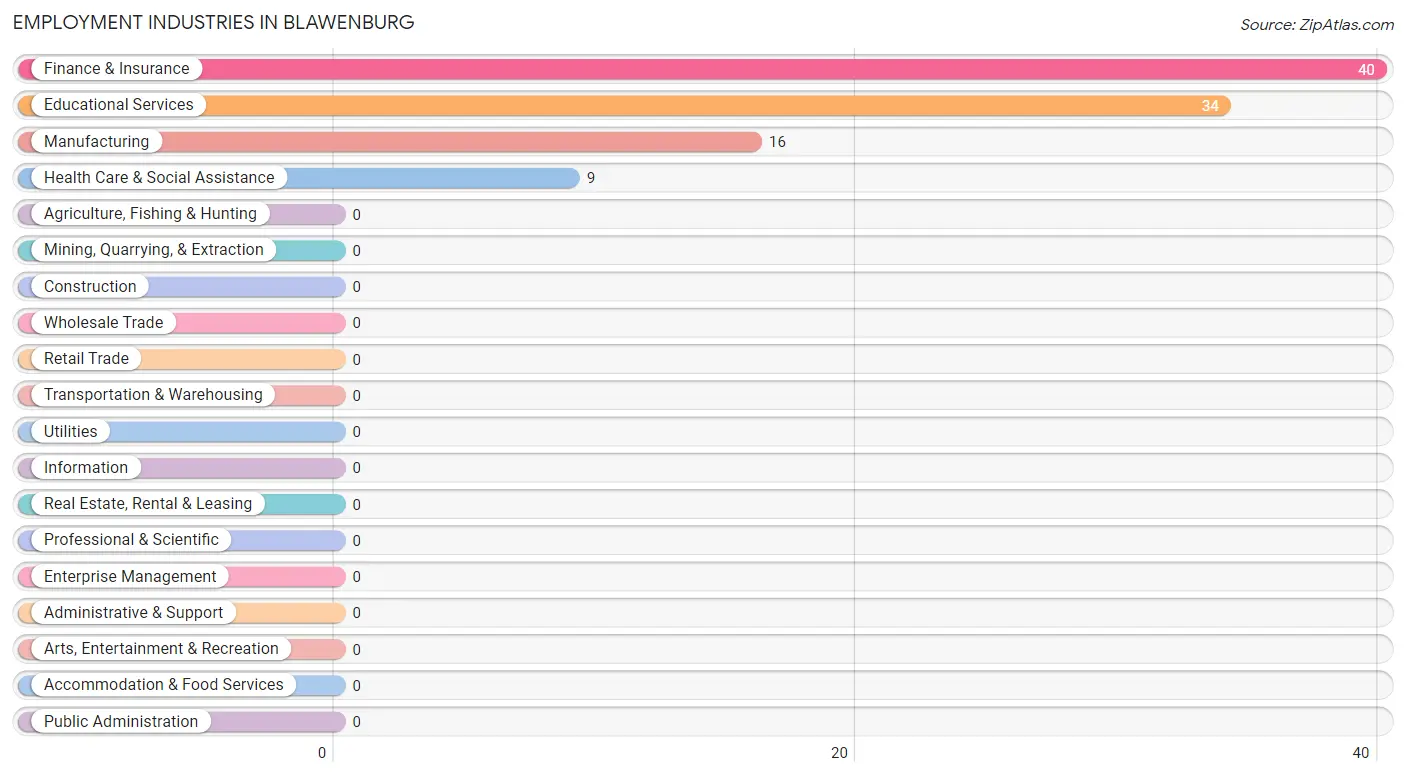
The major employment industries in Blawenburg include Finance & Insurance (40 | 40.4%), Educational Services (34 | 34.3%), Manufacturing (16 | 16.2%), and Health Care & Social Assistance (9 | 9.1%).
Employment Industries by Sex in Blawenburg
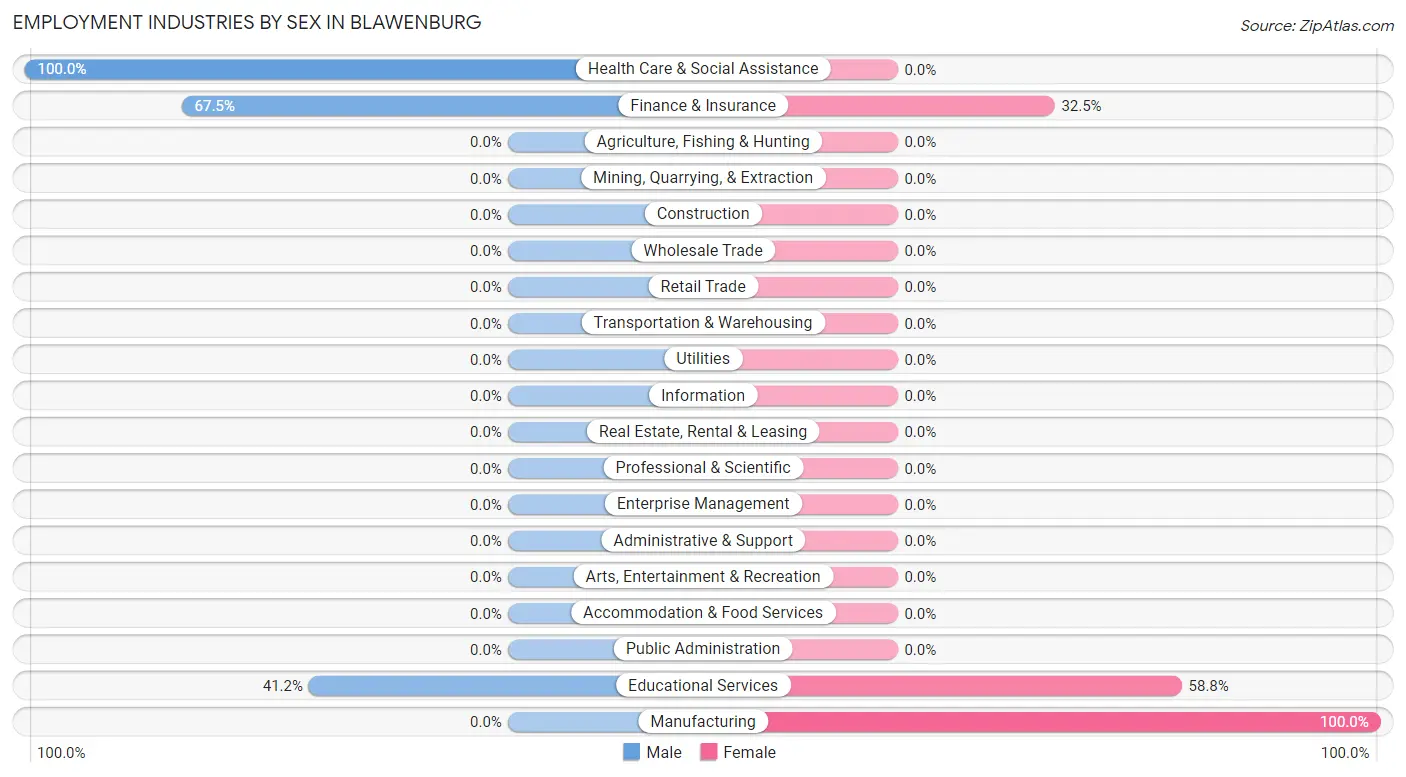
The Blawenburg industries that see more men than women are Health Care & Social Assistance (100.0%), Finance & Insurance (67.5%), and Educational Services (41.2%), whereas the industries that tend to have a higher number of women are Manufacturing (100.0%), Educational Services (58.8%), and Finance & Insurance (32.5%).
| Industry | Male | Female |
| Agriculture, Fishing & Hunting | 0 (0.0%) | 0 (0.0%) |
| Mining, Quarrying, & Extraction | 0 (0.0%) | 0 (0.0%) |
| Construction | 0 (0.0%) | 0 (0.0%) |
| Manufacturing | 0 (0.0%) | 16 (100.0%) |
| Wholesale Trade | 0 (0.0%) | 0 (0.0%) |
| Retail Trade | 0 (0.0%) | 0 (0.0%) |
| Transportation & Warehousing | 0 (0.0%) | 0 (0.0%) |
| Utilities | 0 (0.0%) | 0 (0.0%) |
| Information | 0 (0.0%) | 0 (0.0%) |
| Finance & Insurance | 27 (67.5%) | 13 (32.5%) |
| Real Estate, Rental & Leasing | 0 (0.0%) | 0 (0.0%) |
| Professional & Scientific | 0 (0.0%) | 0 (0.0%) |
| Enterprise Management | 0 (0.0%) | 0 (0.0%) |
| Administrative & Support | 0 (0.0%) | 0 (0.0%) |
| Educational Services | 14 (41.2%) | 20 (58.8%) |
| Health Care & Social Assistance | 9 (100.0%) | 0 (0.0%) |
| Arts, Entertainment & Recreation | 0 (0.0%) | 0 (0.0%) |
| Accommodation & Food Services | 0 (0.0%) | 0 (0.0%) |
| Public Administration | 0 (0.0%) | 0 (0.0%) |
| Total | 50 (50.5%) | 49 (49.5%) |
Education in Blawenburg
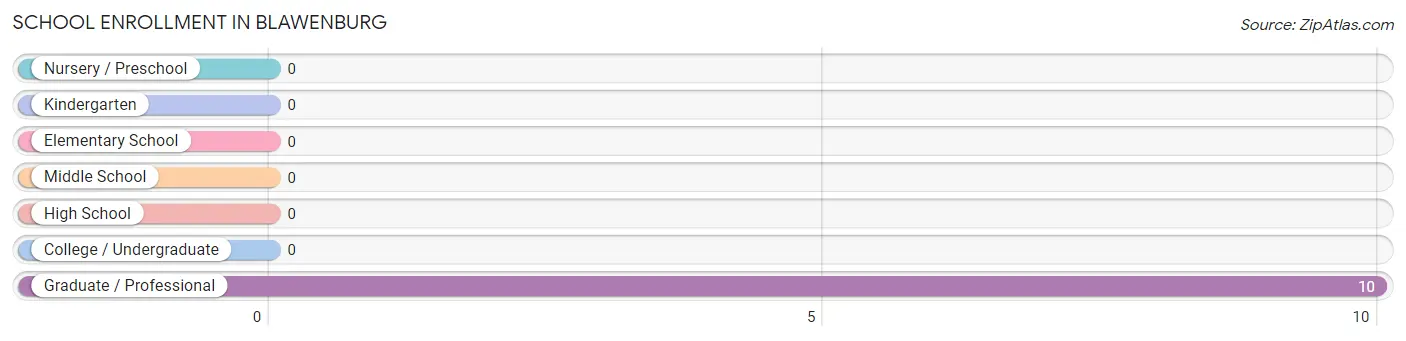
School Enrollment in Blawenburg
| School Level | # Students | % Students |
| Nursery / Preschool | 0 | 0.0% |
| Kindergarten | 0 | 0.0% |
| Elementary School | 0 | 0.0% |
| Middle School | 0 | 0.0% |
| High School | 0 | 0.0% |
| College / Undergraduate | 0 | 0.0% |
| Graduate / Professional | 10 | 100.0% |
| Total | 10 | 100.0% |
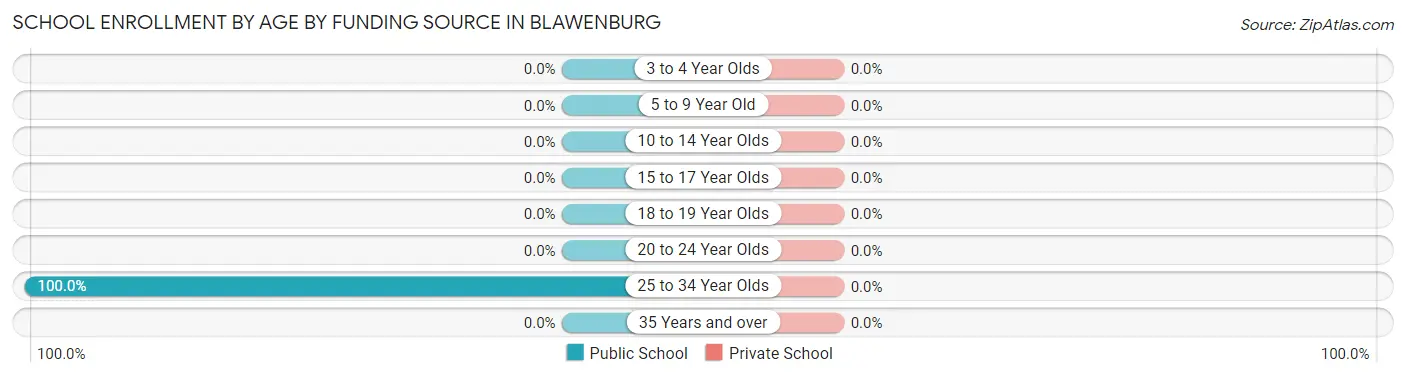
School Enrollment by Age by Funding Source in Blawenburg
| Age Bracket | Public School | Private School |
| 3 to 4 Year Olds | 0 (0.0%) | 0 (0.0%) |
| 5 to 9 Year Old | 0 (0.0%) | 0 (0.0%) |
| 10 to 14 Year Olds | 0 (0.0%) | 0 (0.0%) |
| 15 to 17 Year Olds | 0 (0.0%) | 0 (0.0%) |
| 18 to 19 Year Olds | 0 (0.0%) | 0 (0.0%) |
| 20 to 24 Year Olds | 0 (0.0%) | 0 (0.0%) |
| 25 to 34 Year Olds | 10 (100.0%) | 0 (0.0%) |
| 35 Years and over | 0 (0.0%) | 0 (0.0%) |
| Total | 10 (100.0%) | 0 (0.0%) |
Educational Attainment by Field of Study in Blawenburg
Social sciences (33 | 33.3%), engineering (14 | 14.1%), computers & mathematics (13 | 13.1%), business (10 | 10.1%), and education (10 | 10.1%) are the most common fields of study among 99 individuals in Blawenburg who have obtained a bachelor's degree or higher.
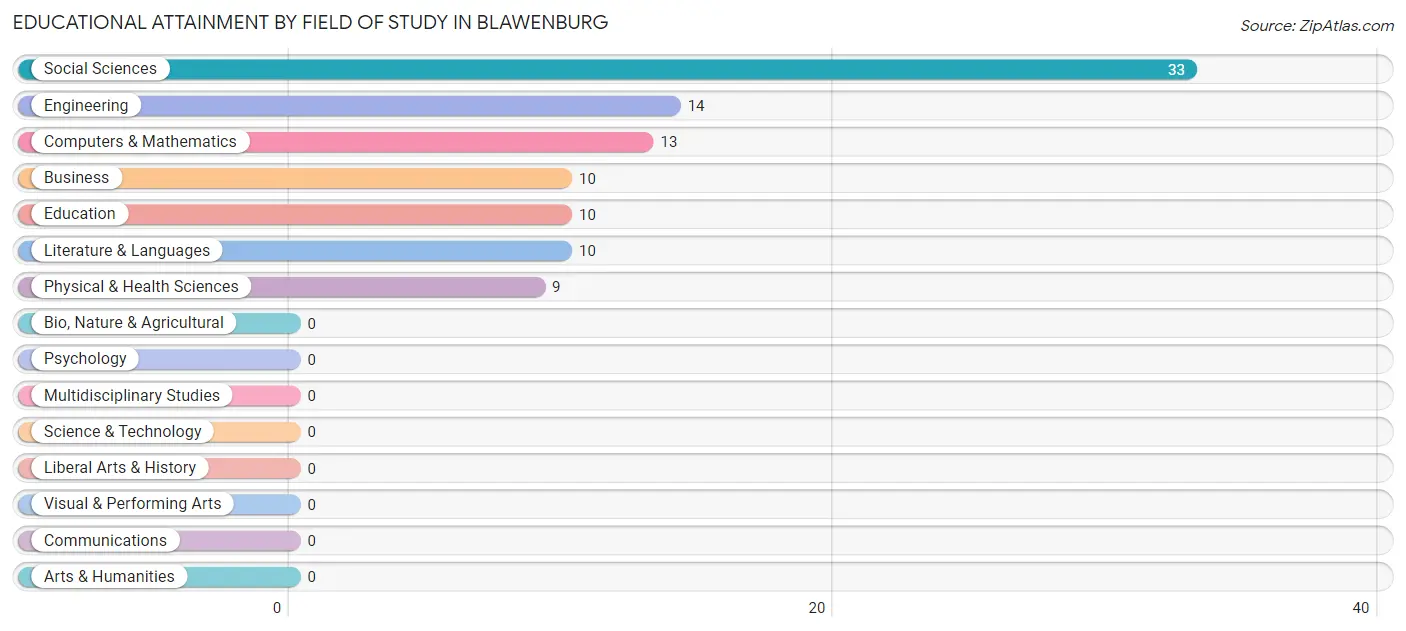
| Field of Study | # Graduates | % Graduates |
| Computers & Mathematics | 13 | 13.1% |
| Bio, Nature & Agricultural | 0 | 0.0% |
| Physical & Health Sciences | 9 | 9.1% |
| Psychology | 0 | 0.0% |
| Social Sciences | 33 | 33.3% |
| Engineering | 14 | 14.1% |
| Multidisciplinary Studies | 0 | 0.0% |
| Science & Technology | 0 | 0.0% |
| Business | 10 | 10.1% |
| Education | 10 | 10.1% |
| Literature & Languages | 10 | 10.1% |
| Liberal Arts & History | 0 | 0.0% |
| Visual & Performing Arts | 0 | 0.0% |
| Communications | 0 | 0.0% |
| Arts & Humanities | 0 | 0.0% |
| Total | 99 | 100.0% |
Transportation & Commute in Blawenburg
Vehicle Availability by Sex in Blawenburg
The most prevalent vehicle ownership categories in Blawenburg are males with 2 vehicles (41, accounting for 82.0%) and females with 2 vehicles (39, making up 83.7%).
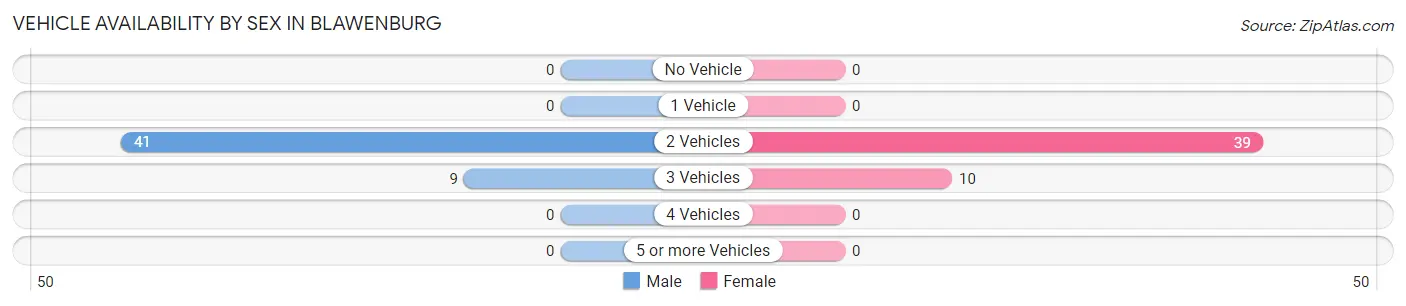
| Vehicles Available | Male | Female |
| No Vehicle | 0 (0.0%) | 0 (0.0%) |
| 1 Vehicle | 0 (0.0%) | 0 (0.0%) |
| 2 Vehicles | 41 (82.0%) | 39 (79.6%) |
| 3 Vehicles | 9 (18.0%) | 10 (20.4%) |
| 4 Vehicles | 0 (0.0%) | 0 (0.0%) |
| 5 or more Vehicles | 0 (0.0%) | 0 (0.0%) |
| Total | 50 (100.0%) | 49 (100.0%) |
Commute Time in Blawenburg
The most frequently occuring commute durations in Blawenburg are 45 to 59 minutes (27 commuters, 37.5%), 30 to 34 minutes (16 commuters, 22.2%), and 5 to 9 minutes (10 commuters, 13.9%).
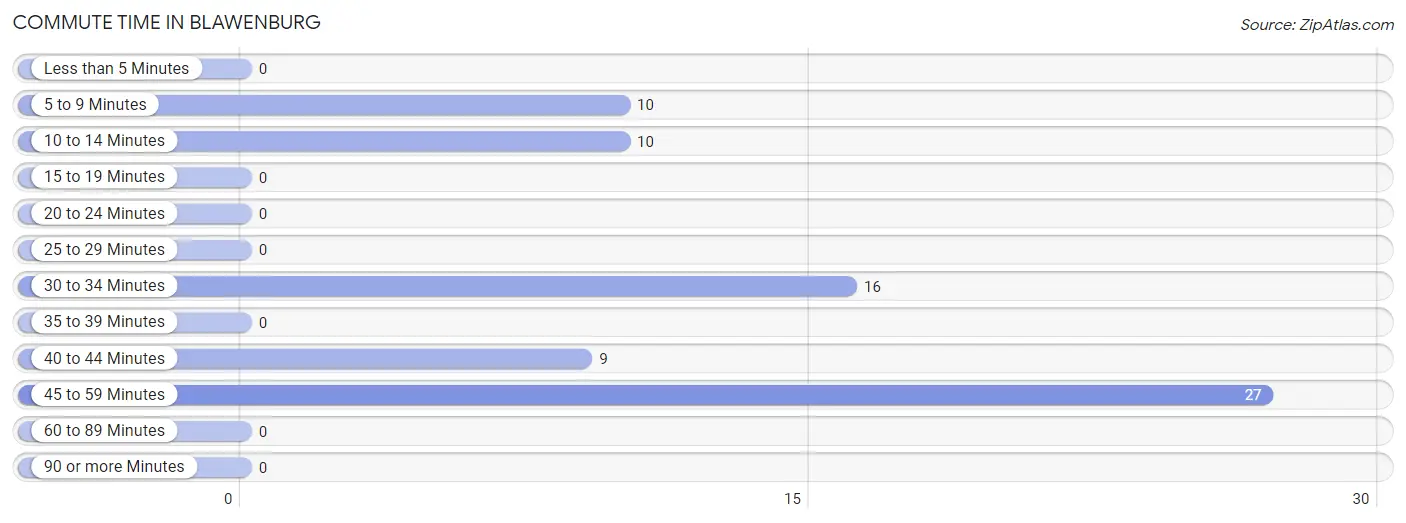
| Commute Time | # Commuters | % Commuters |
| Less than 5 Minutes | 0 | 0.0% |
| 5 to 9 Minutes | 10 | 13.9% |
| 10 to 14 Minutes | 10 | 13.9% |
| 15 to 19 Minutes | 0 | 0.0% |
| 20 to 24 Minutes | 0 | 0.0% |
| 25 to 29 Minutes | 0 | 0.0% |
| 30 to 34 Minutes | 16 | 22.2% |
| 35 to 39 Minutes | 0 | 0.0% |
| 40 to 44 Minutes | 9 | 12.5% |
| 45 to 59 Minutes | 27 | 37.5% |
| 60 to 89 Minutes | 0 | 0.0% |
| 90 or more Minutes | 0 | 0.0% |
Commute Time by Sex in Blawenburg
The most common commute times in Blawenburg are 45 to 59 minutes (17 commuters, 47.2%) for males and 30 to 34 minutes (16 commuters, 44.4%) for females.
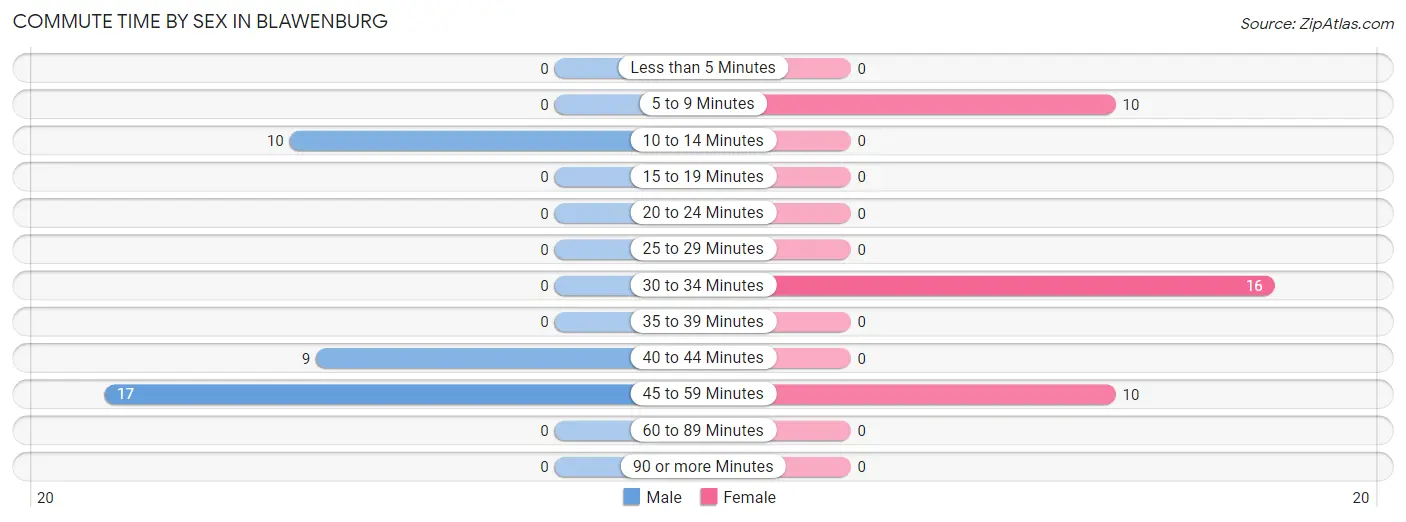
| Commute Time | Male | Female |
| Less than 5 Minutes | 0 (0.0%) | 0 (0.0%) |
| 5 to 9 Minutes | 0 (0.0%) | 10 (27.8%) |
| 10 to 14 Minutes | 10 (27.8%) | 0 (0.0%) |
| 15 to 19 Minutes | 0 (0.0%) | 0 (0.0%) |
| 20 to 24 Minutes | 0 (0.0%) | 0 (0.0%) |
| 25 to 29 Minutes | 0 (0.0%) | 0 (0.0%) |
| 30 to 34 Minutes | 0 (0.0%) | 16 (44.4%) |
| 35 to 39 Minutes | 0 (0.0%) | 0 (0.0%) |
| 40 to 44 Minutes | 9 (25.0%) | 0 (0.0%) |
| 45 to 59 Minutes | 17 (47.2%) | 10 (27.8%) |
| 60 to 89 Minutes | 0 (0.0%) | 0 (0.0%) |
| 90 or more Minutes | 0 (0.0%) | 0 (0.0%) |
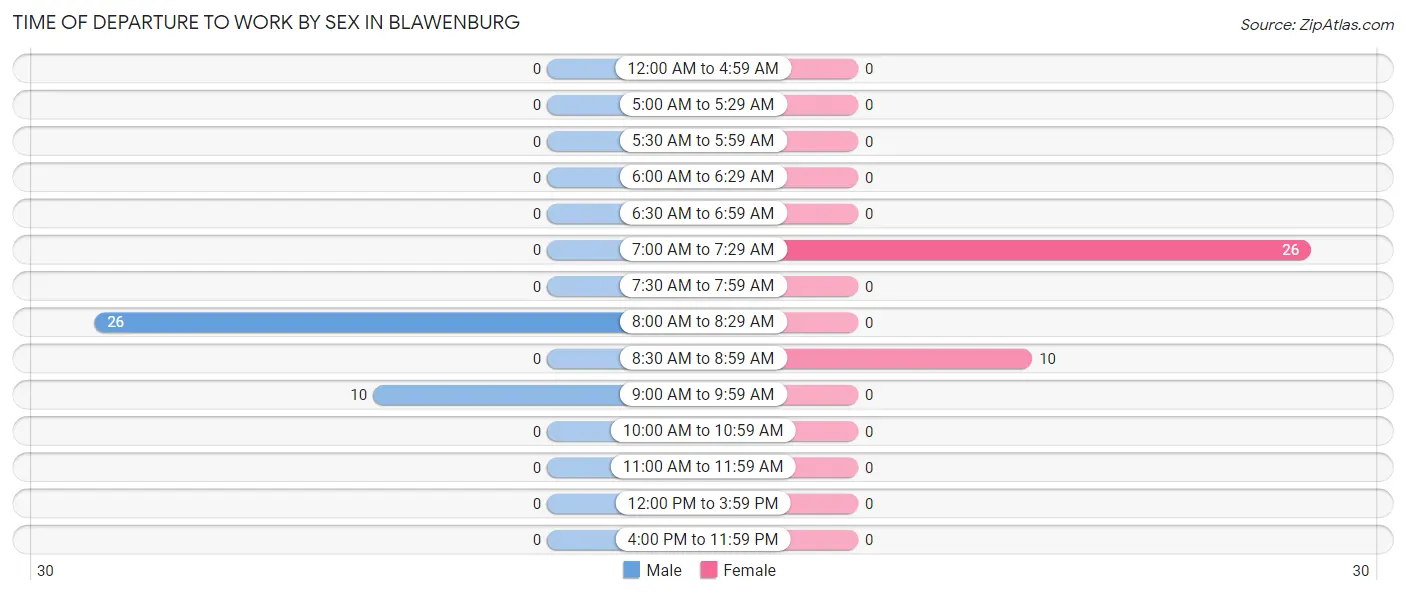
Time of Departure to Work by Sex in Blawenburg
The most frequent times of departure to work in Blawenburg are 8:00 AM to 8:29 AM (26, 72.2%) for males and 7:00 AM to 7:29 AM (26, 72.2%) for females.
| Time of Departure | Male | Female |
| 12:00 AM to 4:59 AM | 0 (0.0%) | 0 (0.0%) |
| 5:00 AM to 5:29 AM | 0 (0.0%) | 0 (0.0%) |
| 5:30 AM to 5:59 AM | 0 (0.0%) | 0 (0.0%) |
| 6:00 AM to 6:29 AM | 0 (0.0%) | 0 (0.0%) |
| 6:30 AM to 6:59 AM | 0 (0.0%) | 0 (0.0%) |
| 7:00 AM to 7:29 AM | 0 (0.0%) | 26 (72.2%) |
| 7:30 AM to 7:59 AM | 0 (0.0%) | 0 (0.0%) |
| 8:00 AM to 8:29 AM | 26 (72.2%) | 0 (0.0%) |
| 8:30 AM to 8:59 AM | 0 (0.0%) | 10 (27.8%) |
| 9:00 AM to 9:59 AM | 10 (27.8%) | 0 (0.0%) |
| 10:00 AM to 10:59 AM | 0 (0.0%) | 0 (0.0%) |
| 11:00 AM to 11:59 AM | 0 (0.0%) | 0 (0.0%) |
| 12:00 PM to 3:59 PM | 0 (0.0%) | 0 (0.0%) |
| 4:00 PM to 11:59 PM | 0 (0.0%) | 0 (0.0%) |
| Total | 36 (100.0%) | 36 (100.0%) |
Housing Occupancy in Blawenburg
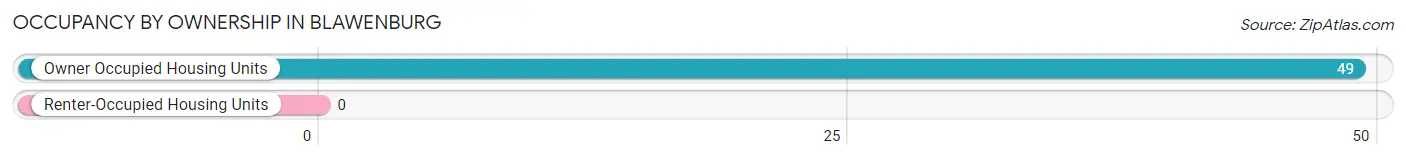
Occupancy by Ownership in Blawenburg
Of the total 49 dwellings in Blawenburg, owner-occupied units account for 49 (100.0%), while renter-occupied units make up 0 (0.0%).
| Occupancy | # Housing Units | % Housing Units |
| Owner Occupied Housing Units | 49 | 100.0% |
| Renter-Occupied Housing Units | 0 | 0.0% |
| Total Occupied Housing Units | 49 | 100.0% |
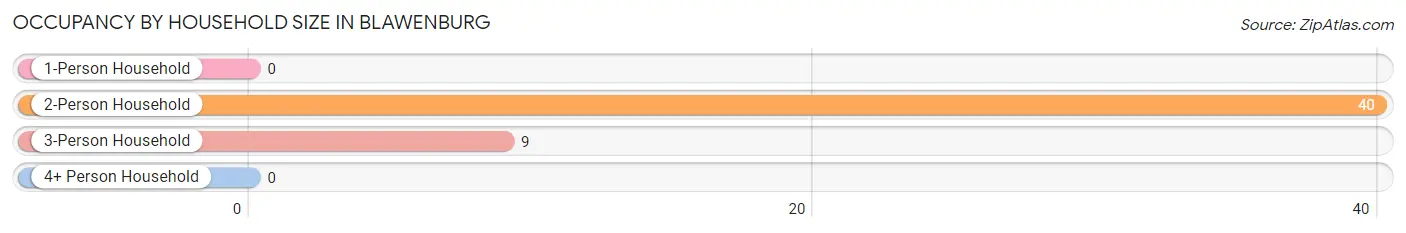
Occupancy by Household Size in Blawenburg
| Household Size | # Housing Units | % Housing Units |
| 1-Person Household | 0 | 0.0% |
| 2-Person Household | 40 | 81.6% |
| 3-Person Household | 9 | 18.4% |
| 4+ Person Household | 0 | 0.0% |
| Total Housing Units | 49 | 100.0% |
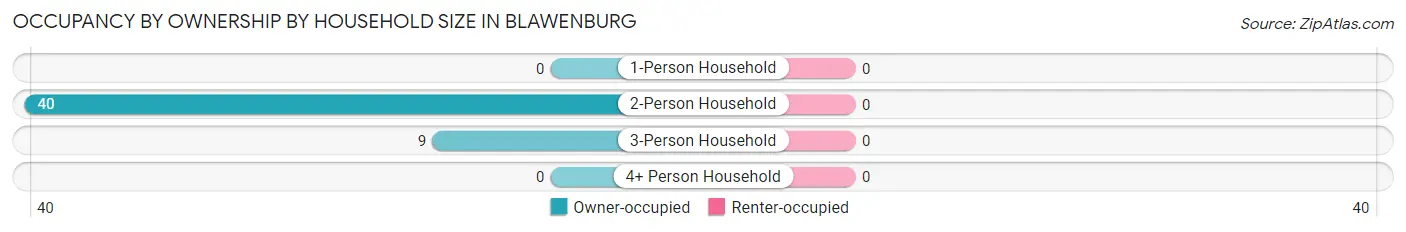
Occupancy by Ownership by Household Size in Blawenburg
| Household Size | Owner-occupied | Renter-occupied |
| 1-Person Household | 0 (0.0%) | 0 (0.0%) |
| 2-Person Household | 40 (100.0%) | 0 (0.0%) |
| 3-Person Household | 9 (100.0%) | 0 (0.0%) |
| 4+ Person Household | 0 (0.0%) | 0 (0.0%) |
| Total Housing Units | 49 (100.0%) | 0 (0.0%) |
Occupancy by Educational Attainment in Blawenburg
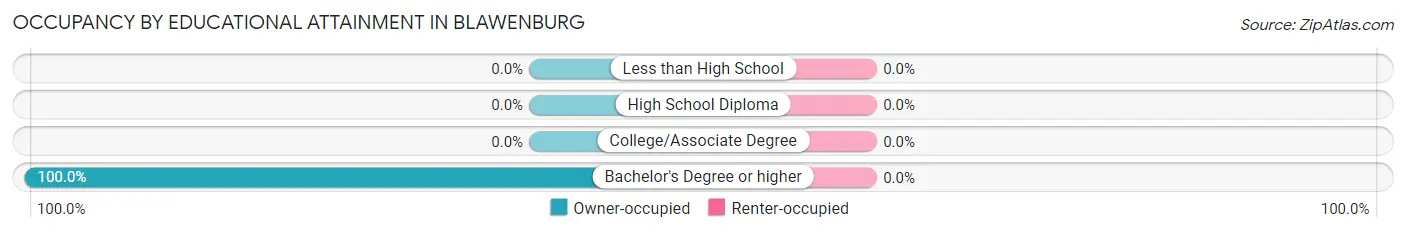
| Household Size | Owner-occupied | Renter-occupied |
| Less than High School | 0 (0.0%) | 0 (0.0%) |
| High School Diploma | 0 (0.0%) | 0 (0.0%) |
| College/Associate Degree | 0 (0.0%) | 0 (0.0%) |
| Bachelor's Degree or higher | 49 (100.0%) | 0 (0.0%) |
Occupancy by Age of Householder in Blawenburg
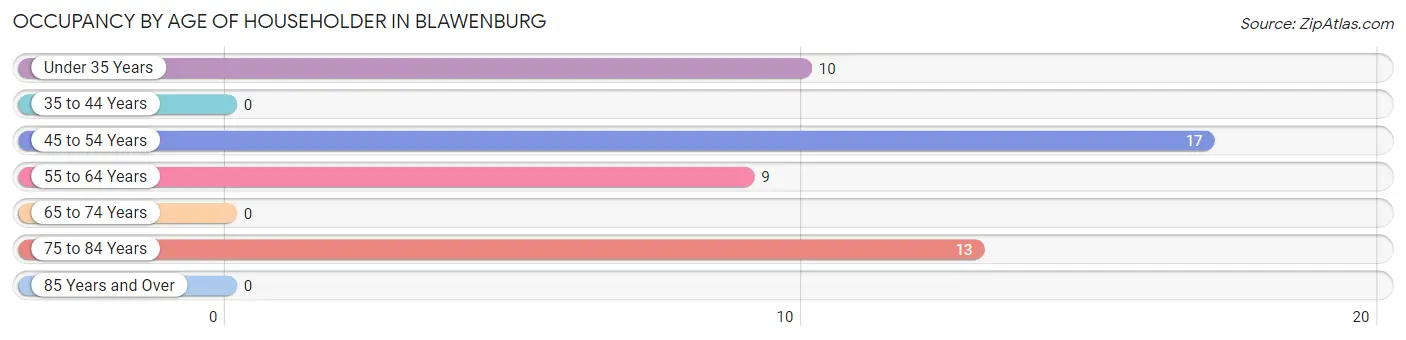
| Age Bracket | # Households | % Households |
| Under 35 Years | 10 | 20.4% |
| 35 to 44 Years | 0 | 0.0% |
| 45 to 54 Years | 17 | 34.7% |
| 55 to 64 Years | 9 | 18.4% |
| 65 to 74 Years | 0 | 0.0% |
| 75 to 84 Years | 13 | 26.5% |
| 85 Years and Over | 0 | 0.0% |
| Total | 49 | 100.0% |
Housing Finances in Blawenburg
Median Income by Occupancy in Blawenburg
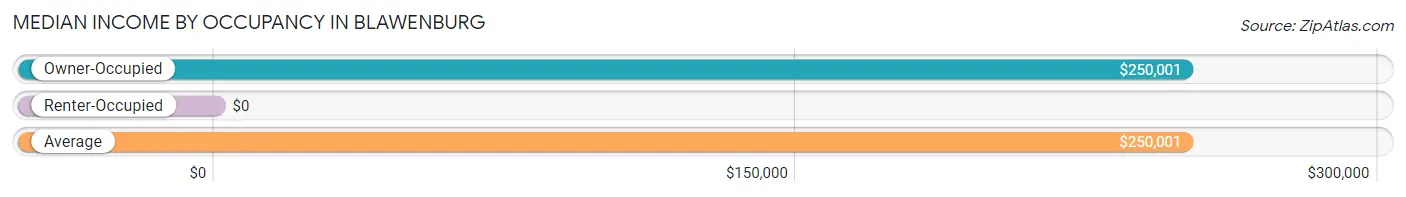
| Occupancy Type | # Households | Median Income |
| Owner-Occupied | 49 (100.0%) | $250,001 |
| Renter-Occupied | 0 (0.0%) | $0 |
| Average | 49 (100.0%) | $250,001 |
Occupancy by Householder Income Bracket in Blawenburg
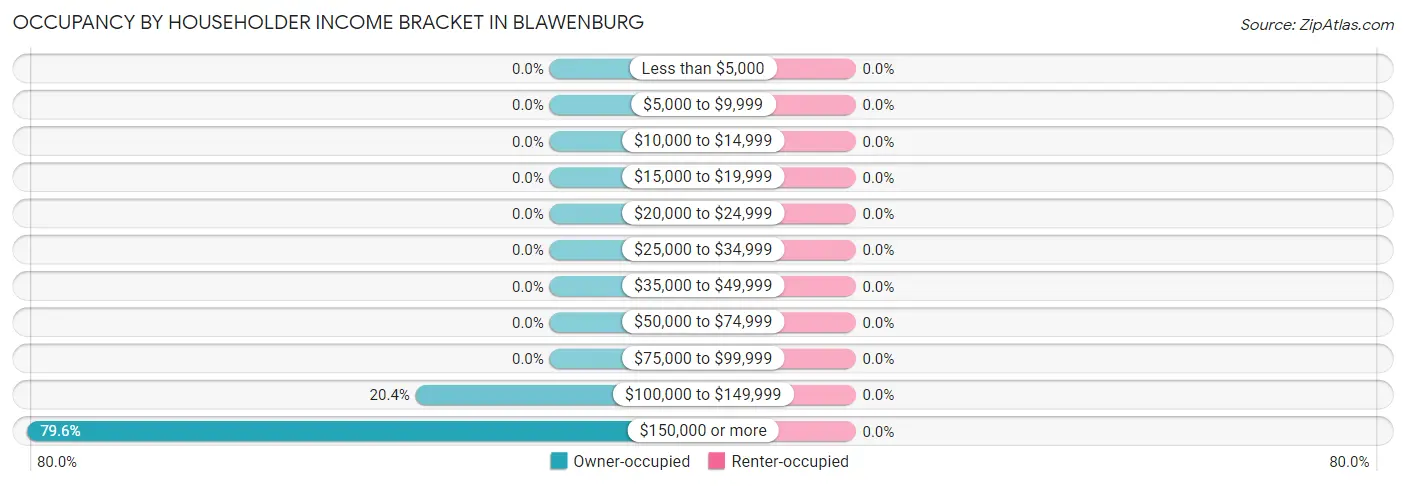
| Income Bracket | Owner-occupied | Renter-occupied |
| Less than $5,000 | 0 (0.0%) | 0 (0.0%) |
| $5,000 to $9,999 | 0 (0.0%) | 0 (0.0%) |
| $10,000 to $14,999 | 0 (0.0%) | 0 (0.0%) |
| $15,000 to $19,999 | 0 (0.0%) | 0 (0.0%) |
| $20,000 to $24,999 | 0 (0.0%) | 0 (0.0%) |
| $25,000 to $34,999 | 0 (0.0%) | 0 (0.0%) |
| $35,000 to $49,999 | 0 (0.0%) | 0 (0.0%) |
| $50,000 to $74,999 | 0 (0.0%) | 0 (0.0%) |
| $75,000 to $99,999 | 0 (0.0%) | 0 (0.0%) |
| $100,000 to $149,999 | 10 (20.4%) | 0 (0.0%) |
| $150,000 or more | 39 (79.6%) | 0 (0.0%) |
| Total | 49 (100.0%) | 0 (0.0%) |
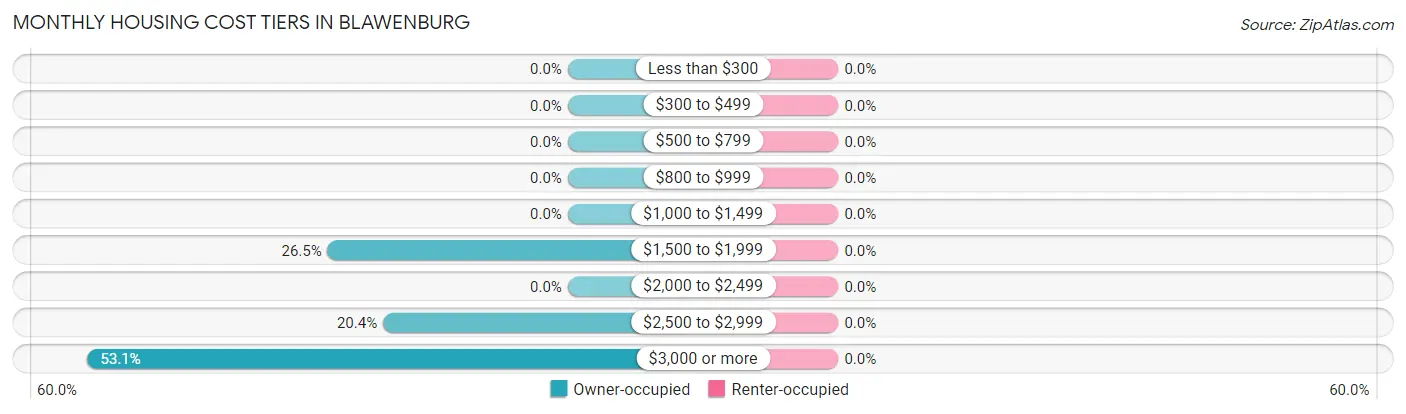
Monthly Housing Cost Tiers in Blawenburg
| Monthly Cost | Owner-occupied | Renter-occupied |
| Less than $300 | 0 (0.0%) | 0 (0.0%) |
| $300 to $499 | 0 (0.0%) | 0 (0.0%) |
| $500 to $799 | 0 (0.0%) | 0 (0.0%) |
| $800 to $999 | 0 (0.0%) | 0 (0.0%) |
| $1,000 to $1,499 | 0 (0.0%) | 0 (0.0%) |
| $1,500 to $1,999 | 13 (26.5%) | 0 (0.0%) |
| $2,000 to $2,499 | 0 (0.0%) | 0 (0.0%) |
| $2,500 to $2,999 | 10 (20.4%) | 0 (0.0%) |
| $3,000 or more | 26 (53.1%) | 0 (0.0%) |
| Total | 49 (100.0%) | 0 (0.0%) |
Physical Housing Characteristics in Blawenburg
Housing Structures in Blawenburg
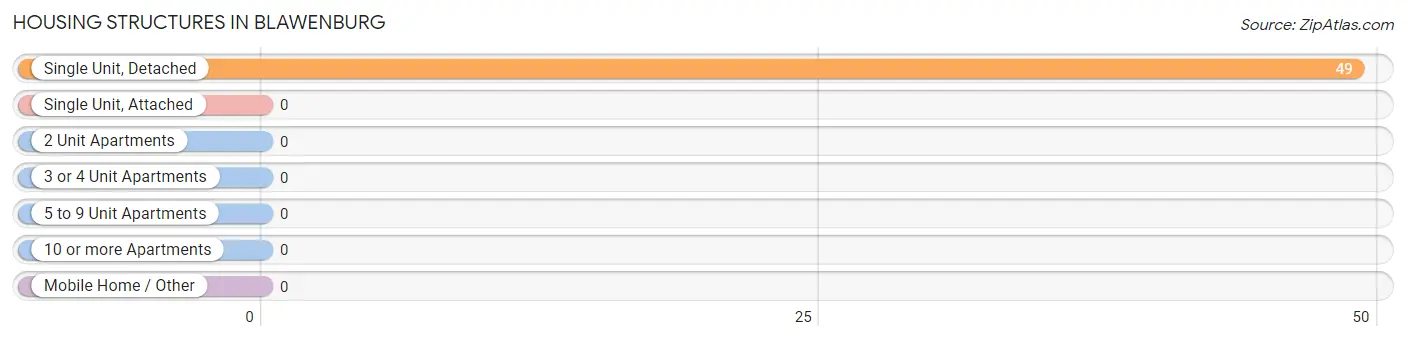
| Structure Type | # Housing Units | % Housing Units |
| Single Unit, Detached | 49 | 100.0% |
| Single Unit, Attached | 0 | 0.0% |
| 2 Unit Apartments | 0 | 0.0% |
| 3 or 4 Unit Apartments | 0 | 0.0% |
| 5 to 9 Unit Apartments | 0 | 0.0% |
| 10 or more Apartments | 0 | 0.0% |
| Mobile Home / Other | 0 | 0.0% |
| Total | 49 | 100.0% |
Housing Structures by Occupancy in Blawenburg
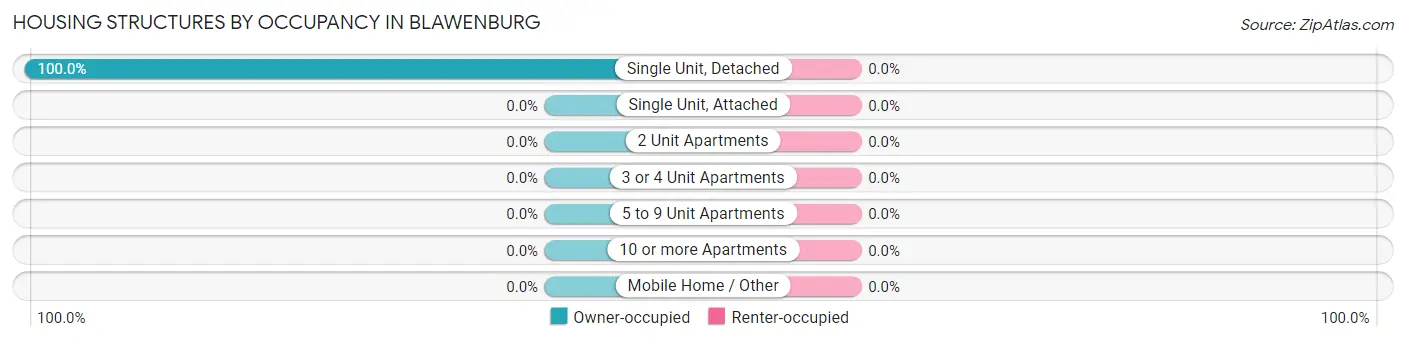
| Structure Type | Owner-occupied | Renter-occupied |
| Single Unit, Detached | 49 (100.0%) | 0 (0.0%) |
| Single Unit, Attached | 0 (0.0%) | 0 (0.0%) |
| 2 Unit Apartments | 0 (0.0%) | 0 (0.0%) |
| 3 or 4 Unit Apartments | 0 (0.0%) | 0 (0.0%) |
| 5 to 9 Unit Apartments | 0 (0.0%) | 0 (0.0%) |
| 10 or more Apartments | 0 (0.0%) | 0 (0.0%) |
| Mobile Home / Other | 0 (0.0%) | 0 (0.0%) |
| Total | 49 (100.0%) | 0 (0.0%) |
Housing Structures by Number of Rooms in Blawenburg
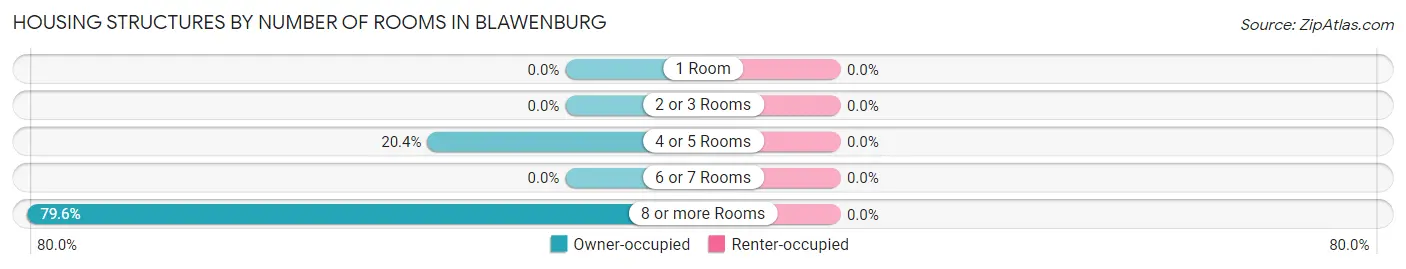
| Number of Rooms | Owner-occupied | Renter-occupied |
| 1 Room | 0 (0.0%) | 0 (0.0%) |
| 2 or 3 Rooms | 0 (0.0%) | 0 (0.0%) |
| 4 or 5 Rooms | 10 (20.4%) | 0 (0.0%) |
| 6 or 7 Rooms | 0 (0.0%) | 0 (0.0%) |
| 8 or more Rooms | 39 (79.6%) | 0 (0.0%) |
| Total | 49 (100.0%) | 0 (0.0%) |
Housing Structure by Heating Type in Blawenburg
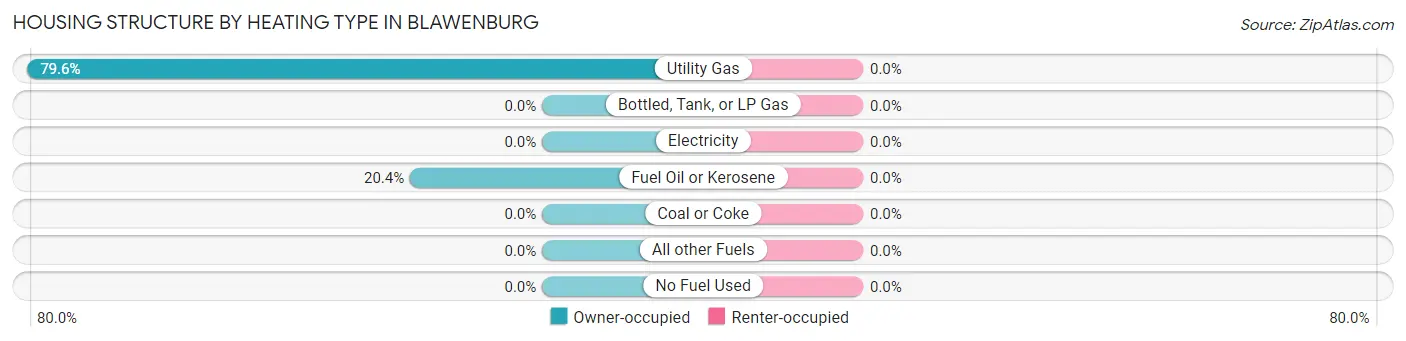
| Heating Type | Owner-occupied | Renter-occupied |
| Utility Gas | 39 (79.6%) | 0 (0.0%) |
| Bottled, Tank, or LP Gas | 0 (0.0%) | 0 (0.0%) |
| Electricity | 0 (0.0%) | 0 (0.0%) |
| Fuel Oil or Kerosene | 10 (20.4%) | 0 (0.0%) |
| Coal or Coke | 0 (0.0%) | 0 (0.0%) |
| All other Fuels | 0 (0.0%) | 0 (0.0%) |
| No Fuel Used | 0 (0.0%) | 0 (0.0%) |
| Total | 49 (100.0%) | 0 (0.0%) |
Household Vehicle Usage in Blawenburg
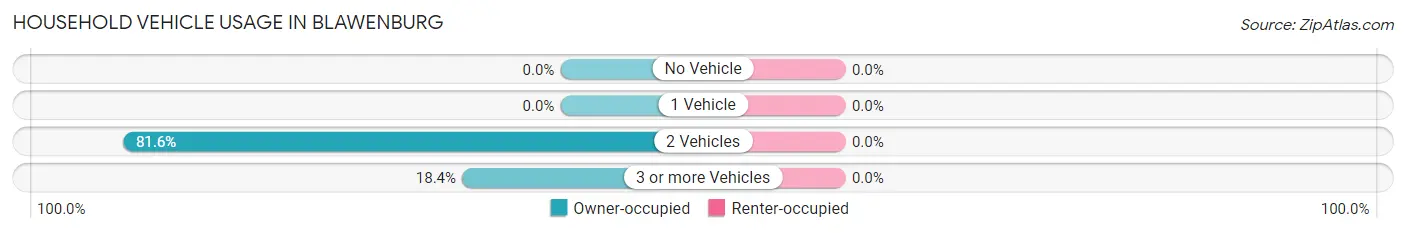
| Vehicles per Household | Owner-occupied | Renter-occupied |
| No Vehicle | 0 (0.0%) | 0 (0.0%) |
| 1 Vehicle | 0 (0.0%) | 0 (0.0%) |
| 2 Vehicles | 40 (81.6%) | 0 (0.0%) |
| 3 or more Vehicles | 9 (18.4%) | 0 (0.0%) |
| Total | 49 (100.0%) | 0 (0.0%) |
Real Estate & Mortgages in Blawenburg
Real Estate and Mortgage Overview in Blawenburg
| Characteristic | Without Mortgage | With Mortgage |
| Housing Units | 13 | 36 |
| Median Property Value | - | - |
| Median Household Income | - | - |
| Monthly Housing Costs | - | - |
| Real Estate Taxes | - | - |
Property Value by Mortgage Status in Blawenburg
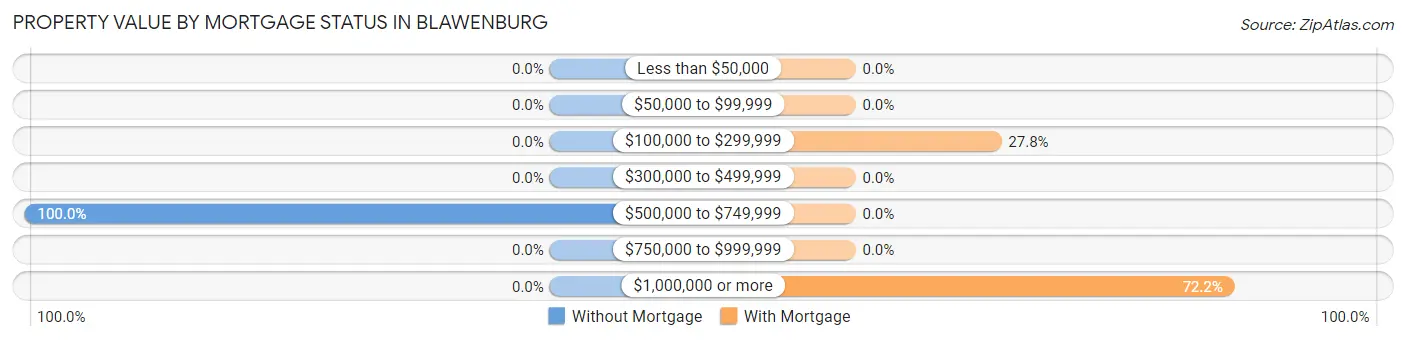
| Property Value | Without Mortgage | With Mortgage |
| Less than $50,000 | 0 (0.0%) | 0 (0.0%) |
| $50,000 to $99,999 | 0 (0.0%) | 0 (0.0%) |
| $100,000 to $299,999 | 0 (0.0%) | 10 (27.8%) |
| $300,000 to $499,999 | 0 (0.0%) | 0 (0.0%) |
| $500,000 to $749,999 | 13 (100.0%) | 0 (0.0%) |
| $750,000 to $999,999 | 0 (0.0%) | 0 (0.0%) |
| $1,000,000 or more | 0 (0.0%) | 26 (72.2%) |
| Total | 13 (100.0%) | 36 (100.0%) |
Household Income by Mortgage Status in Blawenburg
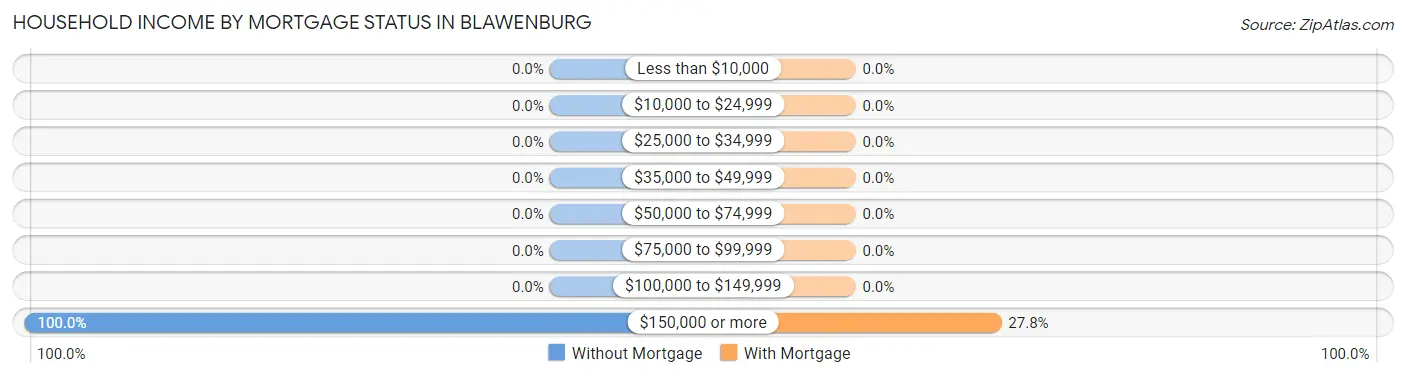
| Household Income | Without Mortgage | With Mortgage |
| Less than $10,000 | 0 (0.0%) | 0 (0.0%) |
| $10,000 to $24,999 | 0 (0.0%) | 0 (0.0%) |
| $25,000 to $34,999 | 0 (0.0%) | 0 (0.0%) |
| $35,000 to $49,999 | 0 (0.0%) | 0 (0.0%) |
| $50,000 to $74,999 | 0 (0.0%) | 0 (0.0%) |
| $75,000 to $99,999 | 0 (0.0%) | 0 (0.0%) |
| $100,000 to $149,999 | 0 (0.0%) | 0 (0.0%) |
| $150,000 or more | 13 (100.0%) | 10 (27.8%) |
| Total | 13 (100.0%) | 36 (100.0%) |
Property Value to Household Income Ratio in Blawenburg
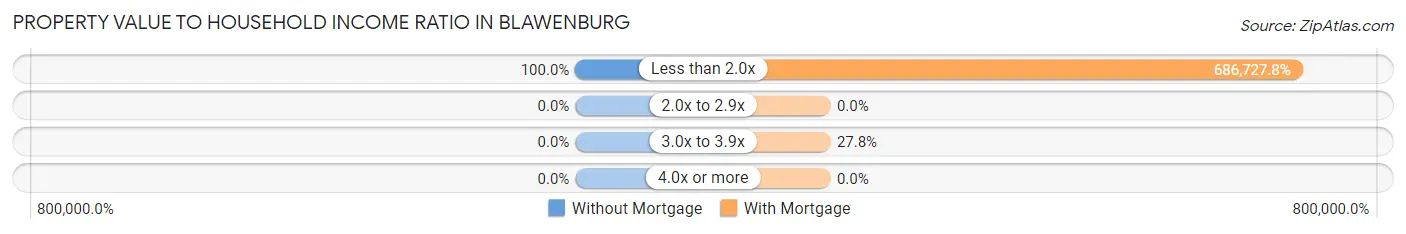
| Value-to-Income Ratio | Without Mortgage | With Mortgage |
| Less than 2.0x | 13 (100.0%) | 247,222 (686,727.8%) |
| 2.0x to 2.9x | 0 (0.0%) | 0 (0.0%) |
| 3.0x to 3.9x | 0 (0.0%) | 10 (27.8%) |
| 4.0x or more | 0 (0.0%) | 0 (0.0%) |
| Total | 13 (100.0%) | 36 (100.0%) |
Real Estate Taxes by Mortgage Status in Blawenburg
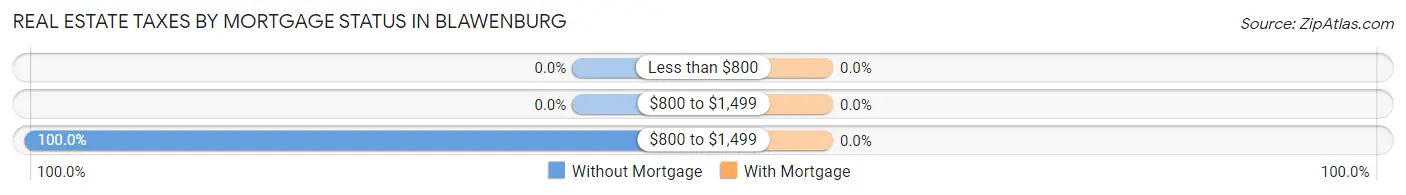
| Property Taxes | Without Mortgage | With Mortgage |
| Less than $800 | 0 (0.0%) | 0 (0.0%) |
| $800 to $1,499 | 0 (0.0%) | 0 (0.0%) |
| $800 to $1,499 | 13 (100.0%) | 0 (0.0%) |
| Total | 13 (100.0%) | 36 (100.0%) |
Health & Disability in Blawenburg
Health Insurance Coverage by Age in Blawenburg
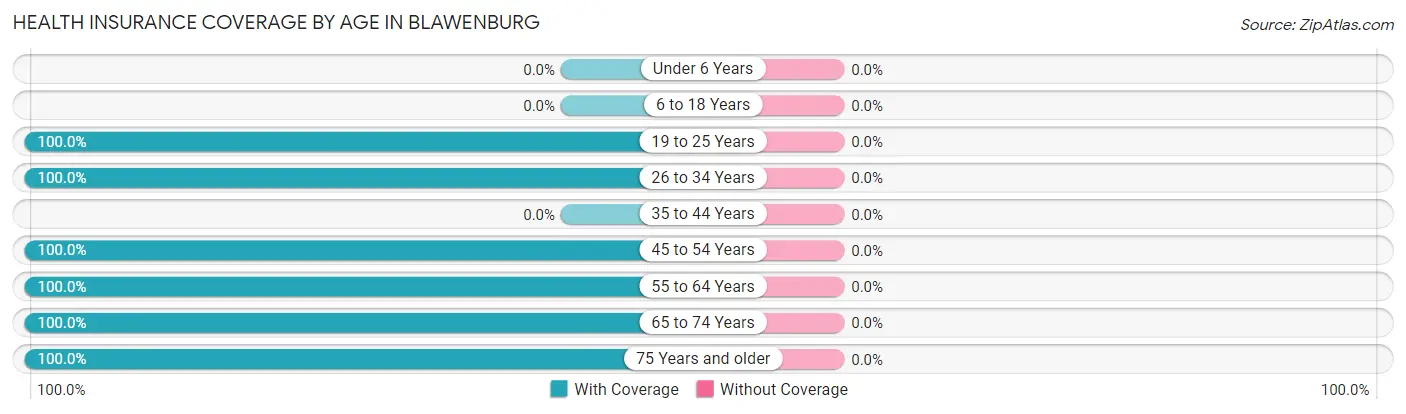
| Age Bracket | With Coverage | Without Coverage |
| Under 6 Years | 0 (0.0%) | 0 (0.0%) |
| 6 to 18 Years | 0 (0.0%) | 0 (0.0%) |
| 19 to 25 Years | 13 (100.0%) | 0 (0.0%) |
| 26 to 34 Years | 20 (100.0%) | 0 (0.0%) |
| 35 to 44 Years | 0 (0.0%) | 0 (0.0%) |
| 45 to 54 Years | 33 (100.0%) | 0 (0.0%) |
| 55 to 64 Years | 19 (100.0%) | 0 (0.0%) |
| 65 to 74 Years | 14 (100.0%) | 0 (0.0%) |
| 75 Years and older | 13 (100.0%) | 0 (0.0%) |
| Total | 112 (100.0%) | 0 (0.0%) |
Health Insurance Coverage by Citizenship Status in Blawenburg
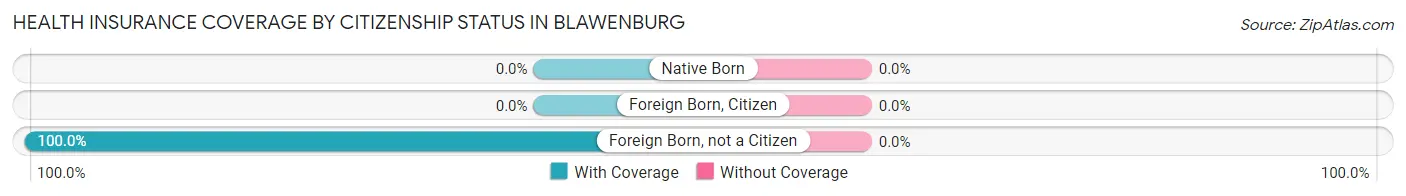
| Citizenship Status | With Coverage | Without Coverage |
| Native Born | 0 (0.0%) | 0 (0.0%) |
| Foreign Born, Citizen | 0 (0.0%) | 0 (0.0%) |
| Foreign Born, not a Citizen | 13 (100.0%) | 0 (0.0%) |
Health Insurance Coverage by Household Income in Blawenburg
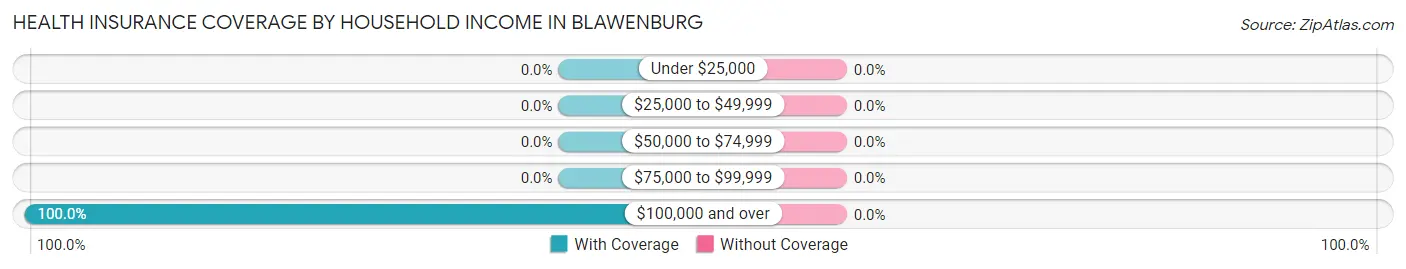
| Household Income | With Coverage | Without Coverage |
| Under $25,000 | 0 (0.0%) | 0 (0.0%) |
| $25,000 to $49,999 | 0 (0.0%) | 0 (0.0%) |
| $50,000 to $74,999 | 0 (0.0%) | 0 (0.0%) |
| $75,000 to $99,999 | 0 (0.0%) | 0 (0.0%) |
| $100,000 and over | 112 (100.0%) | 0 (0.0%) |
Public vs Private Health Insurance Coverage by Age in Blawenburg
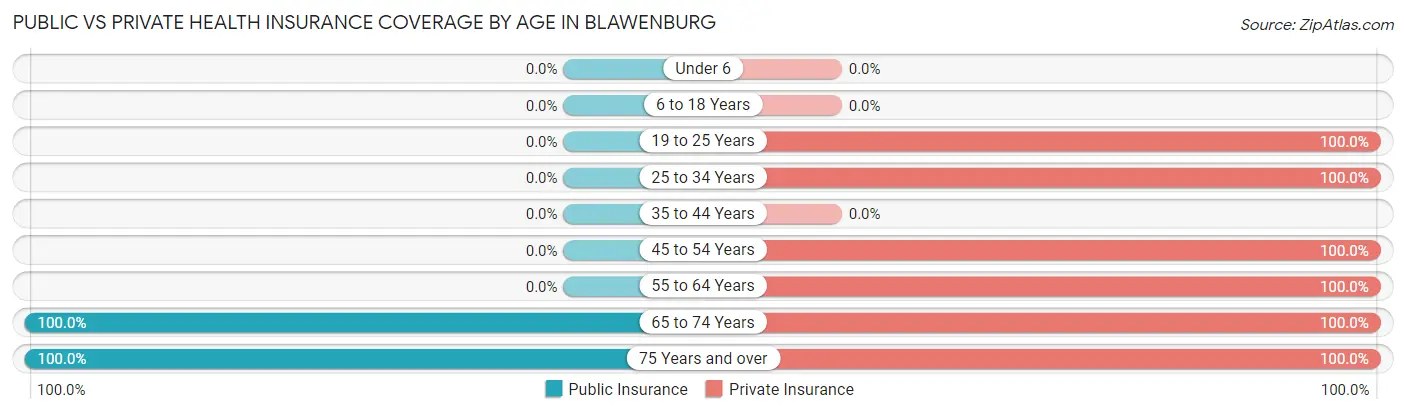
| Age Bracket | Public Insurance | Private Insurance |
| Under 6 | 0 (0.0%) | 0 (0.0%) |
| 6 to 18 Years | 0 (0.0%) | 0 (0.0%) |
| 19 to 25 Years | 0 (0.0%) | 13 (100.0%) |
| 25 to 34 Years | 0 (0.0%) | 20 (100.0%) |
| 35 to 44 Years | 0 (0.0%) | 0 (0.0%) |
| 45 to 54 Years | 0 (0.0%) | 33 (100.0%) |
| 55 to 64 Years | 0 (0.0%) | 19 (100.0%) |
| 65 to 74 Years | 14 (100.0%) | 14 (100.0%) |
| 75 Years and over | 13 (100.0%) | 13 (100.0%) |
| Total | 27 (24.1%) | 112 (100.0%) |
Disability Status by Sex by Age in Blawenburg
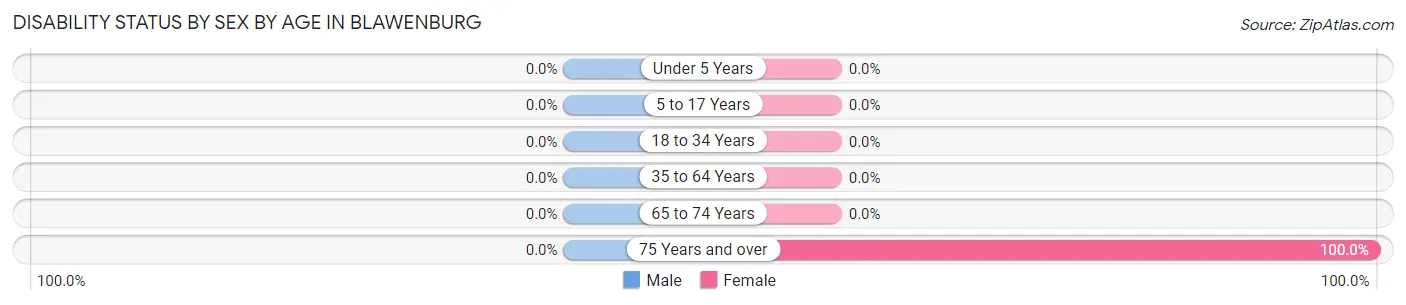
| Age Bracket | Male | Female |
| Under 5 Years | 0 (0.0%) | 0 (0.0%) |
| 5 to 17 Years | 0 (0.0%) | 0 (0.0%) |
| 18 to 34 Years | 0 (0.0%) | 0 (0.0%) |
| 35 to 64 Years | 0 (0.0%) | 0 (0.0%) |
| 65 to 74 Years | 0 (0.0%) | 0 (0.0%) |
| 75 Years and over | 0 (0.0%) | 13 (100.0%) |
Disability Class by Sex by Age in Blawenburg
Disability Class: Hearing Difficulty
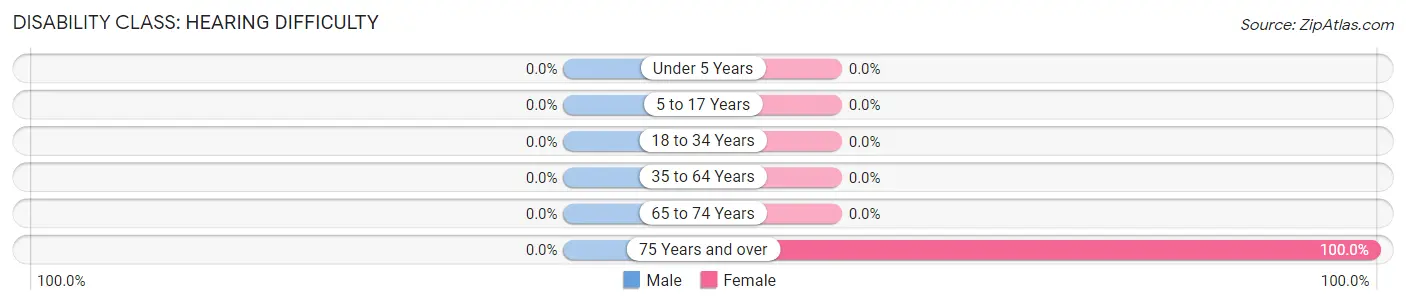
| Age Bracket | Male | Female |
| Under 5 Years | 0 (0.0%) | 0 (0.0%) |
| 5 to 17 Years | 0 (0.0%) | 0 (0.0%) |
| 18 to 34 Years | 0 (0.0%) | 0 (0.0%) |
| 35 to 64 Years | 0 (0.0%) | 0 (0.0%) |
| 65 to 74 Years | 0 (0.0%) | 0 (0.0%) |
| 75 Years and over | 0 (0.0%) | 13 (100.0%) |
Disability Class: Vision Difficulty
| Age Bracket | Male | Female |
| Under 5 Years | 0 (0.0%) | 0 (0.0%) |
| 5 to 17 Years | 0 (0.0%) | 0 (0.0%) |
| 18 to 34 Years | 0 (0.0%) | 0 (0.0%) |
| 35 to 64 Years | 0 (0.0%) | 0 (0.0%) |
| 65 to 74 Years | 0 (0.0%) | 0 (0.0%) |
| 75 Years and over | 0 (0.0%) | 0 (0.0%) |
Disability Class: Cognitive Difficulty
| Age Bracket | Male | Female |
| 5 to 17 Years | 0 (0.0%) | 0 (0.0%) |
| 18 to 34 Years | 0 (0.0%) | 0 (0.0%) |
| 35 to 64 Years | 0 (0.0%) | 0 (0.0%) |
| 65 to 74 Years | 0 (0.0%) | 0 (0.0%) |
| 75 Years and over | 0 (0.0%) | 0 (0.0%) |
Disability Class: Ambulatory Difficulty
| Age Bracket | Male | Female |
| 5 to 17 Years | 0 (0.0%) | 0 (0.0%) |
| 18 to 34 Years | 0 (0.0%) | 0 (0.0%) |
| 35 to 64 Years | 0 (0.0%) | 0 (0.0%) |
| 65 to 74 Years | 0 (0.0%) | 0 (0.0%) |
| 75 Years and over | 0 (0.0%) | 0 (0.0%) |
Disability Class: Self-Care Difficulty

| Age Bracket | Male | Female |
| 5 to 17 Years | 0 (0.0%) | 0 (0.0%) |
| 18 to 34 Years | 0 (0.0%) | 0 (0.0%) |
| 35 to 64 Years | 0 (0.0%) | 0 (0.0%) |
| 65 to 74 Years | 0 (0.0%) | 0 (0.0%) |
| 75 Years and over | 0 (0.0%) | 0 (0.0%) |
Technology Access in Blawenburg
Computing Device Access in Blawenburg
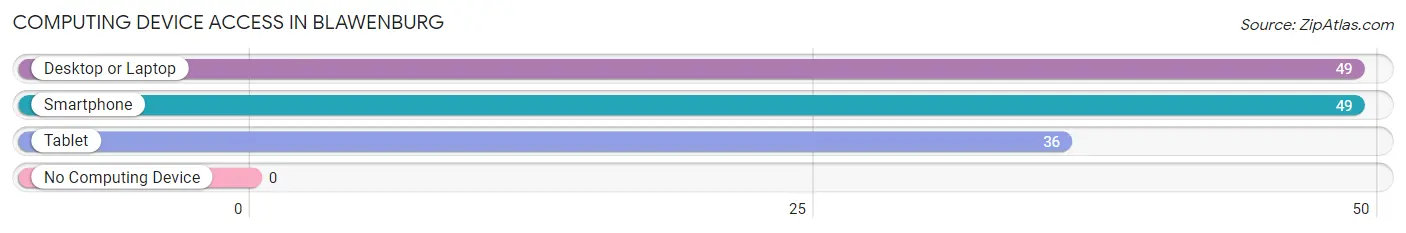
| Device Type | # Households | % Households |
| Desktop or Laptop | 49 | 100.0% |
| Smartphone | 49 | 100.0% |
| Tablet | 36 | 73.5% |
| No Computing Device | 0 | 0.0% |
| Total | 49 | 100.0% |
Internet Access in Blawenburg
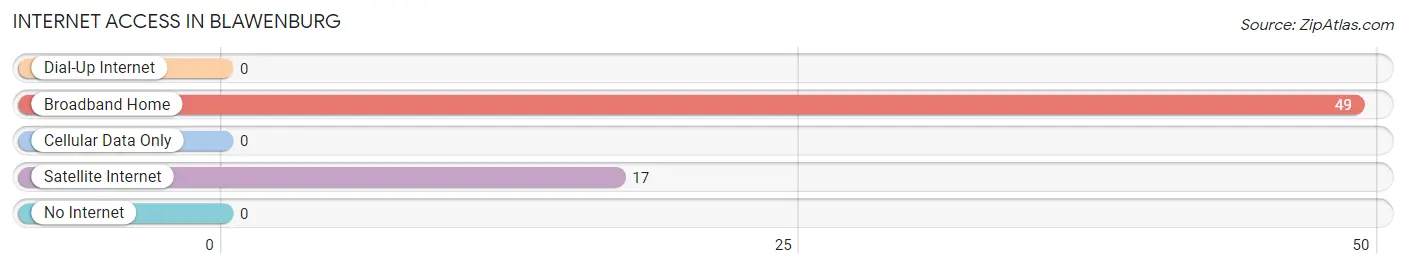
| Internet Type | # Households | % Households |
| Dial-Up Internet | 0 | 0.0% |
| Broadband Home | 49 | 100.0% |
| Cellular Data Only | 0 | 0.0% |
| Satellite Internet | 17 | 34.7% |
| No Internet | 0 | 0.0% |
| Total | 49 | 100.0% |
Blawenburg Summary
Blawenburg is a small unincorporated community located in Montgomery Township, Somerset County, New Jersey. It is situated in the Sourland Mountains, a range of low hills that run through central New Jersey. The area is known for its rural character and its historic buildings, many of which date back to the 18th century.
History
The area now known as Blawenburg was first settled in the late 17th century by Dutch and German immigrants. The name Blawenburg is derived from the Dutch word “blauw”, meaning blue, and the German word “burg”, meaning castle or fort. The name was likely chosen to reflect the blue-gray color of the local stone used to build the area’s homes and buildings.
The area was originally part of Montgomery Township, which was established in 1702. In 1845, the area was split off from Montgomery Township and became its own municipality, known as Blawenburg. The village was incorporated in 1867 and remained an independent municipality until 1895, when it was reincorporated into Montgomery Township.
Geography
Blawenburg is located in central New Jersey, approximately 25 miles southwest of New York City. It is situated in the Sourland Mountains, a range of low hills that run through central New Jersey. The area is known for its rural character and its historic buildings, many of which date back to the 18th century.
The area is home to several small streams, including the Millstone River, which runs through the village. The area is also home to several parks, including the Sourland Mountain Preserve, which is a popular destination for hikers and nature lovers.
Economy
The economy of Blawenburg is largely based on agriculture and tourism. The area is home to several small farms, which produce a variety of fruits and vegetables. The area is also home to several wineries, which produce a variety of wines.
The area is also home to several small businesses, including antique stores, art galleries, and restaurants. The area is also home to several bed and breakfasts, which attract tourists from around the world.
Demographics
As of the 2010 census, the population of Blawenburg was 1,845. The population is largely white (94.3%), with a small percentage of African Americans (2.2%) and Asians (1.2%). The median household income is $90,938, and the median age is 43.
Conclusion
Blawenburg is a small unincorporated community located in Montgomery Township, Somerset County, New Jersey. It is situated in the Sourland Mountains, a range of low hills that run through central New Jersey. The area is known for its rural character and its historic buildings, many of which date back to the 18th century. The economy of Blawenburg is largely based on agriculture and tourism, and the population is largely white. The area is home to several small farms, wineries, businesses, and bed and breakfasts, which attract tourists from around the world.
Common Questions
What is Per Capita Income in Blawenburg?
Per Capita income in Blawenburg is $158,670.
What is the Median Family Income in Blawenburg?
Median Family Income in Blawenburg is $250,001.
What is the Median Household income in Blawenburg?
Median Household Income in Blawenburg is $250,001.
What is Inequality or Gini Index in Blawenburg?
Inequality or Gini Index in Blawenburg is 0.28.
What is the Total Population of Blawenburg?
Total Population of Blawenburg is 112.
What is the Total Male Population of Blawenburg?
Total Male Population of Blawenburg is 50.
What is the Total Female Population of Blawenburg?
Total Female Population of Blawenburg is 62.
What is the Ratio of Males per 100 Females in Blawenburg?
There are 80.65 Males per 100 Females in Blawenburg.
What is the Ratio of Females per 100 Males in Blawenburg?
There are 124.00 Females per 100 Males in Blawenburg.
What is the Median Population Age in Blawenburg?
Median Population Age in Blawenburg is 54.4 Years.
What is the Average Family Size in Blawenburg
Average Family Size in Blawenburg is 2.4 People.
What is the Average Household Size in Blawenburg
Average Household Size in Blawenburg is 2.3 People.
How Large is the Labor Force in Blawenburg?
There are 112 People in the Labor Forcein in Blawenburg.
What is the Percentage of People in the Labor Force in Blawenburg?
100.0% of People are in the Labor Force in Blawenburg.
What is the Unemployment Rate in Blawenburg?
Unemployment Rate in Blawenburg is 11.6%.