Cities with the Most Immigrants from Japan in New Jersey
RELATED REPORTS & OPTIONS
Japan
New Jersey
Compare Cities
Map of Cities with the Most Immigrants from Japan in New Jersey
0
1,500
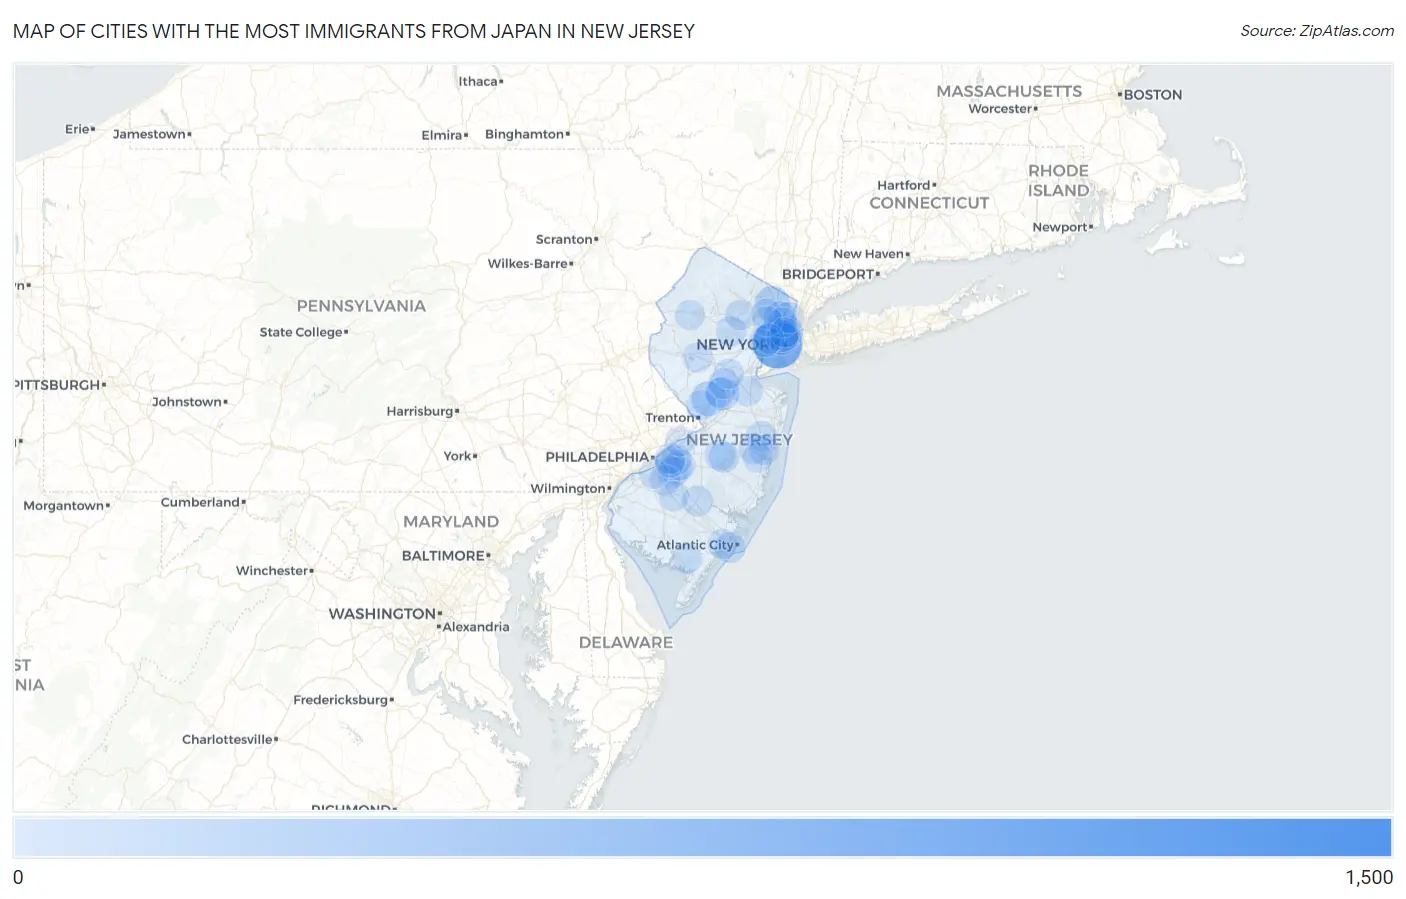
Cities with the Most Immigrants from Japan in New Jersey
| City | Japan | vs State | vs National | |
| 1. | Fort Lee Borough | 1,138 | 10,042(11.33%)#1 | 342,380(0.33%)#22 |
| 2. | Jersey City | 806 | 10,042(8.03%)#2 | 342,380(0.24%)#44 |
| 3. | Edgewater Borough | 557 | 10,042(5.55%)#3 | 342,380(0.16%)#76 |
| 4. | West New York | 235 | 10,042(2.34%)#4 | 342,380(0.07%)#228 |
| 5. | Ridgewood | 228 | 10,042(2.27%)#5 | 342,380(0.07%)#238 |
| 6. | Princeton | 207 | 10,042(2.06%)#6 | 342,380(0.06%)#266 |
| 7. | Glen Rock Borough | 190 | 10,042(1.89%)#7 | 342,380(0.06%)#287 |
| 8. | Little Ferry Borough | 150 | 10,042(1.49%)#8 | 342,380(0.04%)#372 |
| 9. | Monmouth Junction | 142 | 10,042(1.41%)#9 | 342,380(0.04%)#393 |
| 10. | Fair Lawn Borough | 132 | 10,042(1.31%)#10 | 342,380(0.04%)#421 |
| 11. | Leonia Borough | 121 | 10,042(1.20%)#11 | 342,380(0.04%)#454 |
| 12. | Demarest Borough | 121 | 10,042(1.20%)#12 | 342,380(0.04%)#455 |
| 13. | Paramus Borough | 110 | 10,042(1.10%)#13 | 342,380(0.03%)#494 |
| 14. | Hackensack | 109 | 10,042(1.09%)#14 | 342,380(0.03%)#497 |
| 15. | Hoboken | 99 | 10,042(0.99%)#15 | 342,380(0.03%)#549 |
| 16. | Cliffside Park Borough | 88 | 10,042(0.88%)#16 | 342,380(0.03%)#609 |
| 17. | Springdale | 85 | 10,042(0.85%)#17 | 342,380(0.02%)#625 |
| 18. | Allendale Borough | 85 | 10,042(0.85%)#18 | 342,380(0.02%)#626 |
| 19. | Maywood Borough | 80 | 10,042(0.80%)#19 | 342,380(0.02%)#652 |
| 20. | Union City | 77 | 10,042(0.77%)#20 | 342,380(0.02%)#663 |
| 21. | Glassboro Borough | 76 | 10,042(0.76%)#21 | 342,380(0.02%)#675 |
| 22. | Preakness | 71 | 10,042(0.71%)#22 | 342,380(0.02%)#717 |
| 23. | Newark | 68 | 10,042(0.68%)#23 | 342,380(0.02%)#731 |
| 24. | Matawan Borough | 61 | 10,042(0.61%)#24 | 342,380(0.02%)#800 |
| 25. | Englewood | 60 | 10,042(0.60%)#25 | 342,380(0.02%)#809 |
| 26. | The Hills | 59 | 10,042(0.59%)#26 | 342,380(0.02%)#826 |
| 27. | Caldwell Borough | 56 | 10,042(0.56%)#27 | 342,380(0.02%)#876 |
| 28. | Browns Mills | 54 | 10,042(0.54%)#28 | 342,380(0.02%)#900 |
| 29. | Ventnor City | 52 | 10,042(0.52%)#29 | 342,380(0.02%)#926 |
| 30. | Ridgefield Borough | 51 | 10,042(0.51%)#30 | 342,380(0.01%)#936 |
| 31. | Saddle River Borough | 48 | 10,042(0.48%)#31 | 342,380(0.01%)#986 |
| 32. | Norwood Borough | 47 | 10,042(0.47%)#32 | 342,380(0.01%)#1,002 |
| 33. | New Milford Borough | 46 | 10,042(0.46%)#33 | 342,380(0.01%)#1,014 |
| 34. | Hammonton | 43 | 10,042(0.43%)#34 | 342,380(0.01%)#1,061 |
| 35. | Old Tappan Borough | 43 | 10,042(0.43%)#35 | 342,380(0.01%)#1,067 |
| 36. | Montvale Borough | 42 | 10,042(0.42%)#36 | 342,380(0.01%)#1,077 |
| 37. | River Edge Borough | 41 | 10,042(0.41%)#37 | 342,380(0.01%)#1,096 |
| 38. | Country Lake Estates | 41 | 10,042(0.41%)#38 | 342,380(0.01%)#1,104 |
| 39. | Echelon | 40 | 10,042(0.40%)#39 | 342,380(0.01%)#1,119 |
| 40. | Franklin Park | 40 | 10,042(0.40%)#40 | 342,380(0.01%)#1,120 |
| 41. | Morristown | 38 | 10,042(0.38%)#41 | 342,380(0.01%)#1,153 |
| 42. | Oradell Borough | 38 | 10,042(0.38%)#42 | 342,380(0.01%)#1,159 |
| 43. | Haworth Borough | 38 | 10,042(0.38%)#43 | 342,380(0.01%)#1,162 |
| 44. | Lyons | 36 | 10,042(0.36%)#44 | 342,380(0.01%)#1,202 |
| 45. | Marlton | 35 | 10,042(0.35%)#45 | 342,380(0.01%)#1,216 |
| 46. | Tenafly Borough | 33 | 10,042(0.33%)#46 | 342,380(0.01%)#1,262 |
| 47. | Cresskill Borough | 33 | 10,042(0.33%)#47 | 342,380(0.01%)#1,268 |
| 48. | Ramblewood | 33 | 10,042(0.33%)#48 | 342,380(0.01%)#1,271 |
| 49. | Lodi Borough | 32 | 10,042(0.32%)#49 | 342,380(0.01%)#1,289 |
| 50. | Palisades Park Borough | 32 | 10,042(0.32%)#50 | 342,380(0.01%)#1,291 |
| 51. | Closter Borough | 31 | 10,042(0.31%)#51 | 342,380(0.01%)#1,331 |
| 52. | Blackwood | 30 | 10,042(0.30%)#52 | 342,380(0.01%)#1,371 |
| 53. | Leisure Village West | 30 | 10,042(0.30%)#53 | 342,380(0.01%)#1,375 |
| 54. | Lakewood | 29 | 10,042(0.29%)#54 | 342,380(0.01%)#1,383 |
| 55. | Sayreville Borough | 29 | 10,042(0.29%)#55 | 342,380(0.01%)#1,386 |
| 56. | Boonton | 29 | 10,042(0.29%)#56 | 342,380(0.01%)#1,403 |
| 57. | Old Bridge | 28 | 10,042(0.28%)#57 | 342,380(0.01%)#1,427 |
| 58. | Waldwick Borough | 28 | 10,042(0.28%)#58 | 342,380(0.01%)#1,433 |
| 59. | Park Ridge Borough | 27 | 10,042(0.27%)#59 | 342,380(0.01%)#1,461 |
| 60. | Englewood Cliffs Borough | 27 | 10,042(0.27%)#60 | 342,380(0.01%)#1,465 |
| 61. | Williamstown | 26 | 10,042(0.26%)#61 | 342,380(0.01%)#1,487 |
| 62. | Cherry Hill Mall | 26 | 10,042(0.26%)#62 | 342,380(0.01%)#1,489 |
| 63. | White House Station | 26 | 10,042(0.26%)#63 | 342,380(0.01%)#1,500 |
| 64. | Chatham Borough | 25 | 10,042(0.25%)#64 | 342,380(0.01%)#1,541 |
| 65. | Ho Ho Kus Borough | 24 | 10,042(0.24%)#65 | 342,380(0.01%)#1,584 |
| 66. | Toms River | 23 | 10,042(0.23%)#66 | 342,380(0.01%)#1,590 |
| 67. | Raritan Borough | 23 | 10,042(0.23%)#67 | 342,380(0.01%)#1,621 |
| 68. | Bergenfield Borough | 22 | 10,042(0.22%)#68 | 342,380(0.01%)#1,645 |
| 69. | Somerville Borough | 22 | 10,042(0.22%)#69 | 342,380(0.01%)#1,662 |
| 70. | Heathcote | 22 | 10,042(0.22%)#70 | 342,380(0.01%)#1,669 |
| 71. | Butler Borough | 21 | 10,042(0.21%)#71 | 342,380(0.01%)#1,717 |
| 72. | Rutherford Borough | 20 | 10,042(0.20%)#72 | 342,380(0.01%)#1,763 |
| 73. | Paterson | 19 | 10,042(0.19%)#73 | 342,380(0.01%)#1,785 |
| 74. | Hopatcong Borough | 19 | 10,042(0.19%)#74 | 342,380(0.01%)#1,806 |
| 75. | Eatontown Borough | 19 | 10,042(0.19%)#75 | 342,380(0.01%)#1,807 |
| 76. | Forsgate | 19 | 10,042(0.19%)#76 | 342,380(0.01%)#1,823 |
| 77. | Ridgefield Park | 18 | 10,042(0.18%)#77 | 342,380(0.01%)#1,863 |
| 78. | Glen Ridge Borough | 18 | 10,042(0.18%)#78 | 342,380(0.01%)#1,870 |
| 79. | Holiday City South | 18 | 10,042(0.18%)#79 | 342,380(0.01%)#1,878 |
| 80. | Clifton | 17 | 10,042(0.17%)#80 | 342,380(0.00%)#1,889 |
| 81. | Harrison | 17 | 10,042(0.17%)#81 | 342,380(0.00%)#1,914 |
| 82. | Bound Brook Borough | 17 | 10,042(0.17%)#82 | 342,380(0.00%)#1,920 |
| 83. | Guttenberg | 17 | 10,042(0.17%)#83 | 342,380(0.00%)#1,921 |
| 84. | Woodbury | 16 | 10,042(0.16%)#84 | 342,380(0.00%)#1,985 |
| 85. | Bloomingdale Borough | 16 | 10,042(0.16%)#85 | 342,380(0.00%)#1,989 |
| 86. | Panther Valley | 16 | 10,042(0.16%)#86 | 342,380(0.00%)#1,996 |
| 87. | Belleplain | 16 | 10,042(0.16%)#87 | 342,380(0.00%)#2,011 |
| 88. | Parsippany | 15 | 10,042(0.15%)#88 | 342,380(0.00%)#2,040 |
| 89. | Ellisburg | 15 | 10,042(0.15%)#89 | 342,380(0.00%)#2,070 |
| 90. | Beverly | 15 | 10,042(0.15%)#90 | 342,380(0.00%)#2,079 |
| 91. | Somerset | 14 | 10,042(0.14%)#91 | 342,380(0.00%)#2,110 |
| 92. | Springfield | 14 | 10,042(0.14%)#92 | 342,380(0.00%)#2,158 |
| 93. | Fairview Borough | 13 | 10,042(0.13%)#93 | 342,380(0.00%)#2,201 |
| 94. | Clayton Borough | 13 | 10,042(0.13%)#94 | 342,380(0.00%)#2,216 |
| 95. | Harrington Park Borough | 13 | 10,042(0.13%)#95 | 342,380(0.00%)#2,227 |
| 96. | Lawrenceville | 13 | 10,042(0.13%)#96 | 342,380(0.00%)#2,233 |
| 97. | Sicklerville | 12 | 10,042(0.12%)#97 | 342,380(0.00%)#2,264 |
| 98. | Kinnelon Borough | 12 | 10,042(0.12%)#98 | 342,380(0.00%)#2,313 |
| 99. | Northfield | 12 | 10,042(0.12%)#99 | 342,380(0.00%)#2,322 |
| 100. | Pennington Borough | 12 | 10,042(0.12%)#100 | 342,380(0.00%)#2,344 |
Common Questions
What are the Top 10 Cities with the Most Immigrants from Japan in New Jersey?
Top 10 Cities with the Most Immigrants from Japan in New Jersey are:
#1
806
#2
235
#3
228
#4
207
#5
142
#6
109
#7
99
#8
85
#9
77
#10
68
What city has the Most Immigrants from Japan in New Jersey?
Jersey City has the Most Immigrants from Japan in New Jersey with 806.
What is the Total Immigrants from Japan in the State of New Jersey?
Total Immigrants from Japan in New Jersey is 10,042.
What is the Total Immigrants from Japan in the United States?
Total Immigrants from Japan in the United States is 342,380.