Cities with the Highest Poverty Level Among Seniors Over the Age of 75 in New Jersey
RELATED REPORTS & OPTIONS
Highest Poverty | Seniors 75+
New Jersey
Compare Cities
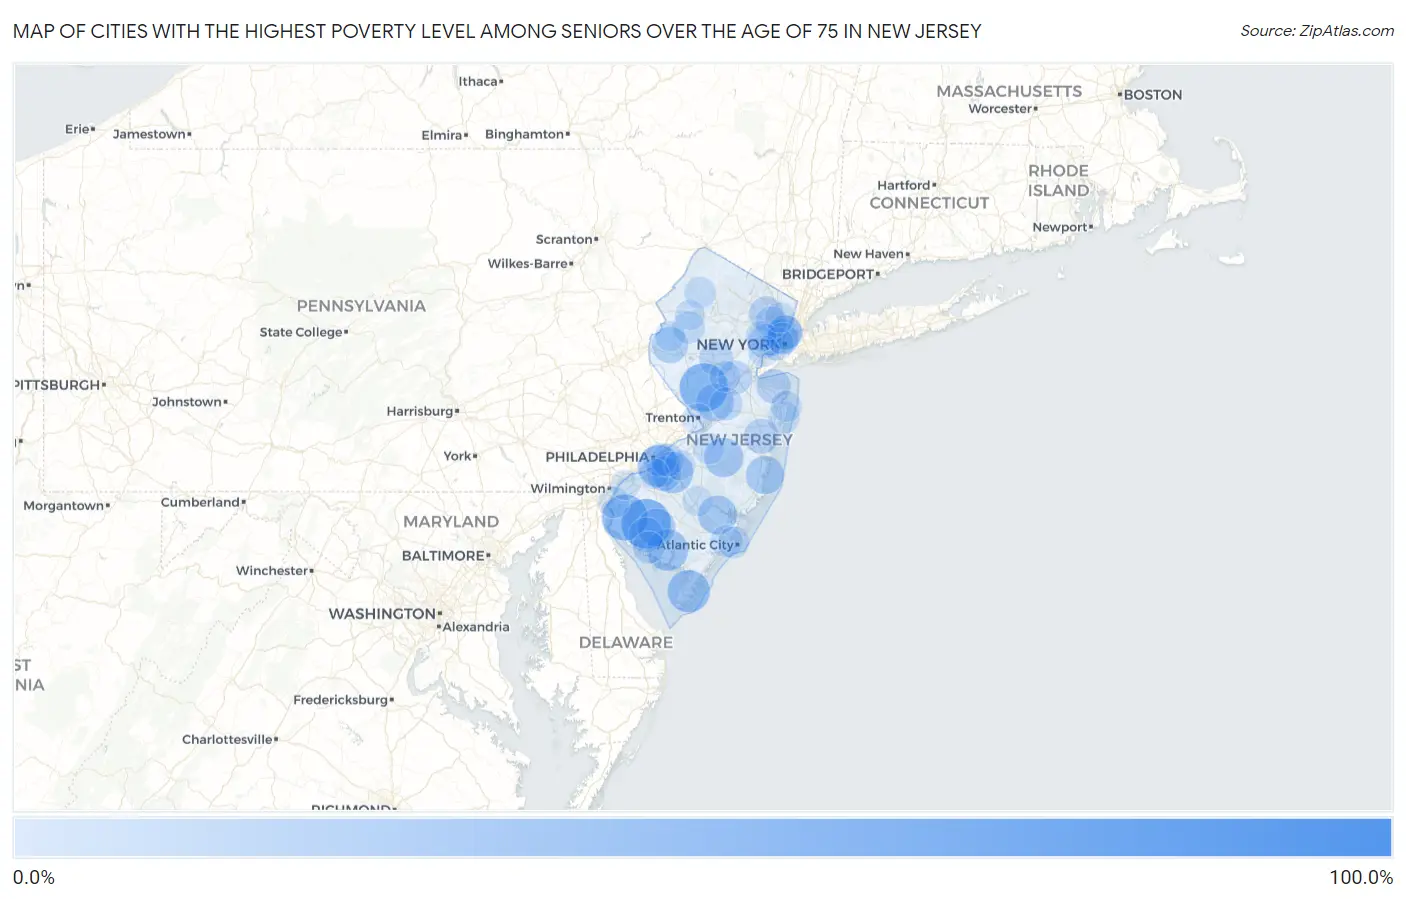
Map of Cities with the Highest Poverty Level Among Seniors Over the Age of 75 in New Jersey
0.0%
100.0%
Cities with the Highest Poverty Level Among Seniors Over the Age of 75 in New Jersey
| City | Senior Poverty | vs State | vs National | |
| 1. | Keasbey | 100.0% | 10.7%(+89.3)#1 | 11.1%(+88.9)#5 |
| 2. | Three Bridges | 100.0% | 10.7%(+89.3)#2 | 11.1%(+88.9)#73 |
| 3. | Deerfield Street | 100.0% | 10.7%(+89.3)#3 | 11.1%(+88.9)#322 |
| 4. | Germania | 62.8% | 10.7%(+52.1)#4 | 11.1%(+51.7)#763 |
| 5. | Seabrook Farms | 62.4% | 10.7%(+51.7)#5 | 11.1%(+51.3)#780 |
| 6. | Skillman | 60.0% | 10.7%(+49.3)#6 | 11.1%(+48.9)#846 |
| 7. | Quinton | 54.5% | 10.7%(+43.9)#7 | 11.1%(+43.5)#1,039 |
| 8. | Woodlynne Borough | 49.4% | 10.7%(+38.7)#8 | 11.1%(+38.3)#1,319 |
| 9. | Englishtown Borough | 47.6% | 10.7%(+36.9)#9 | 11.1%(+36.5)#1,401 |
| 10. | Carlls Corner | 45.5% | 10.7%(+34.8)#10 | 11.1%(+34.4)#1,524 |
| 11. | Burleigh | 45.5% | 10.7%(+34.8)#11 | 11.1%(+34.4)#1,530 |
| 12. | Gloucester City | 44.5% | 10.7%(+33.9)#12 | 11.1%(+33.5)#1,578 |
| 13. | Laurel Lake | 43.5% | 10.7%(+32.8)#13 | 11.1%(+32.4)#1,641 |
| 14. | Echelon | 43.3% | 10.7%(+32.6)#14 | 11.1%(+32.2)#1,659 |
| 15. | West Park | 42.4% | 10.7%(+31.7)#15 | 11.1%(+31.3)#1,735 |
| 16. | Dunellen Borough | 39.6% | 10.7%(+28.9)#16 | 11.1%(+28.5)#1,984 |
| 17. | Country Lake Estates | 38.3% | 10.7%(+27.7)#17 | 11.1%(+27.3)#2,093 |
| 18. | Egg Harbor City | 37.4% | 10.7%(+26.7)#18 | 11.1%(+26.3)#2,197 |
| 19. | Sea Bright Borough | 36.8% | 10.7%(+26.2)#19 | 11.1%(+25.8)#2,234 |
| 20. | Forked River | 36.0% | 10.7%(+25.3)#20 | 11.1%(+24.9)#2,318 |
| 21. | Rosenhayn | 35.1% | 10.7%(+24.4)#21 | 11.1%(+24.0)#2,408 |
| 22. | Princeton Junction | 34.9% | 10.7%(+24.2)#22 | 11.1%(+23.8)#2,427 |
| 23. | Asbury | 31.2% | 10.7%(+20.6)#23 | 11.1%(+20.2)#2,937 |
| 24. | Butler Borough | 30.3% | 10.7%(+19.6)#24 | 11.1%(+19.2)#3,072 |
| 25. | Manville Borough | 28.9% | 10.7%(+18.2)#25 | 11.1%(+17.8)#3,304 |
| 26. | West New York | 28.5% | 10.7%(+17.9)#26 | 11.1%(+17.5)#3,392 |
| 27. | Franklinville | 28.0% | 10.7%(+17.4)#27 | 11.1%(+17.0)#3,448 |
| 28. | Lindenwold Borough | 28.0% | 10.7%(+17.4)#28 | 11.1%(+17.0)#3,450 |
| 29. | Bridgeton | 28.0% | 10.7%(+17.3)#29 | 11.1%(+16.9)#3,470 |
| 30. | Lakewood | 27.9% | 10.7%(+17.3)#30 | 11.1%(+16.9)#3,476 |
| 31. | Penns Grove Borough | 27.9% | 10.7%(+17.2)#31 | 11.1%(+16.8)#3,484 |
| 32. | Paterson | 27.5% | 10.7%(+16.8)#32 | 11.1%(+16.4)#3,546 |
| 33. | Glendora | 27.4% | 10.7%(+16.7)#33 | 11.1%(+16.3)#3,574 |
| 34. | Port Monmouth | 26.8% | 10.7%(+16.1)#34 | 11.1%(+15.7)#3,703 |
| 35. | Union City | 26.7% | 10.7%(+16.0)#35 | 11.1%(+15.6)#3,712 |
| 36. | Green Knoll | 26.6% | 10.7%(+15.9)#36 | 11.1%(+15.5)#3,738 |
| 37. | Ogdensburg Borough | 26.0% | 10.7%(+15.4)#37 | 11.1%(+15.0)#3,861 |
| 38. | Prospect Park Borough | 26.0% | 10.7%(+15.3)#38 | 11.1%(+14.9)#3,873 |
| 39. | Buena Borough | 25.9% | 10.7%(+15.2)#39 | 11.1%(+14.8)#3,900 |
| 40. | Guttenberg | 25.9% | 10.7%(+15.2)#40 | 11.1%(+14.8)#3,904 |
| 41. | Newark | 25.7% | 10.7%(+15.0)#41 | 11.1%(+14.6)#3,949 |
| 42. | New Brunswick | 25.4% | 10.7%(+14.7)#42 | 11.1%(+14.3)#4,000 |
| 43. | Somerdale Borough | 25.3% | 10.7%(+14.7)#43 | 11.1%(+14.3)#4,013 |
| 44. | Rockaway Borough | 24.9% | 10.7%(+14.3)#44 | 11.1%(+13.9)#4,205 |
| 45. | Cape May Point Borough | 23.7% | 10.7%(+13.1)#45 | 11.1%(+12.7)#4,455 |
| 46. | East Rutherford Borough | 23.7% | 10.7%(+13.0)#46 | 11.1%(+12.6)#4,464 |
| 47. | Camden | 23.5% | 10.7%(+12.9)#47 | 11.1%(+12.5)#4,497 |
| 48. | Middlesex Borough | 23.4% | 10.7%(+12.7)#48 | 11.1%(+12.3)#4,547 |
| 49. | Jersey City | 23.2% | 10.7%(+12.5)#49 | 11.1%(+12.1)#4,582 |
| 50. | Golden Triangle | 23.1% | 10.7%(+12.5)#50 | 11.1%(+12.1)#4,596 |
| 51. | Lodi Borough | 23.1% | 10.7%(+12.5)#51 | 11.1%(+12.1)#4,601 |
| 52. | Cranbury | 23.0% | 10.7%(+12.3)#52 | 11.1%(+11.9)#4,664 |
| 53. | Fieldsboro Borough | 22.9% | 10.7%(+12.3)#53 | 11.1%(+11.8)#4,673 |
| 54. | Asbury Park | 22.1% | 10.7%(+11.4)#54 | 11.1%(+11.0)#4,944 |
| 55. | Passaic | 21.8% | 10.7%(+11.2)#55 | 11.1%(+10.8)#5,017 |
| 56. | Brookside | 21.8% | 10.7%(+11.1)#56 | 11.1%(+10.7)#5,024 |
| 57. | Renaissance At Monroe | 21.6% | 10.7%(+10.9)#57 | 11.1%(+10.5)#5,087 |
| 58. | Beattystown | 21.6% | 10.7%(+10.9)#58 | 11.1%(+10.5)#5,091 |
| 59. | Pleasantville | 21.6% | 10.7%(+10.9)#59 | 11.1%(+10.5)#5,104 |
| 60. | Cedarville | 21.4% | 10.7%(+10.8)#60 | 11.1%(+10.4)#5,135 |
| 61. | Haworth Borough | 21.3% | 10.7%(+10.7)#61 | 11.1%(+10.3)#5,170 |
| 62. | River Edge Borough | 21.3% | 10.7%(+10.7)#62 | 11.1%(+10.3)#5,171 |
| 63. | Hoboken | 20.7% | 10.7%(+10.1)#63 | 11.1%(+9.66)#5,353 |
| 64. | Port Elizabeth | 20.7% | 10.7%(+10.0)#64 | 11.1%(+9.62)#5,374 |
| 65. | Newton | 20.6% | 10.7%(+9.92)#65 | 11.1%(+9.52)#5,393 |
| 66. | Carteret Borough | 20.2% | 10.7%(+9.53)#66 | 11.1%(+9.13)#5,523 |
| 67. | Atlantic City | 20.2% | 10.7%(+9.53)#67 | 11.1%(+9.12)#5,526 |
| 68. | Little Ferry Borough | 20.0% | 10.7%(+9.37)#68 | 11.1%(+8.96)#5,553 |
| 69. | Franklin Borough | 19.8% | 10.7%(+9.13)#69 | 11.1%(+8.73)#5,761 |
| 70. | Pennsville | 19.6% | 10.7%(+8.93)#70 | 11.1%(+8.52)#5,824 |
| 71. | Long Branch | 19.3% | 10.7%(+8.64)#71 | 11.1%(+8.24)#5,933 |
| 72. | Elizabeth | 19.2% | 10.7%(+8.51)#72 | 11.1%(+8.11)#5,998 |
| 73. | Juliustown | 19.0% | 10.7%(+8.38)#73 | 11.1%(+7.98)#6,057 |
| 74. | Middlebush | 18.9% | 10.7%(+8.23)#74 | 11.1%(+7.83)#6,105 |
| 75. | Branchville Borough | 18.9% | 10.7%(+8.20)#75 | 11.1%(+7.80)#6,120 |
| 76. | Ridgefield Borough | 18.8% | 10.7%(+8.10)#76 | 11.1%(+7.69)#6,148 |
| 77. | Watsessing | 18.6% | 10.7%(+7.93)#77 | 11.1%(+7.53)#6,226 |
| 78. | Bound Brook Borough | 18.5% | 10.7%(+7.79)#78 | 11.1%(+7.39)#6,286 |
| 79. | Flanders | 18.3% | 10.7%(+7.59)#79 | 11.1%(+7.19)#6,365 |
| 80. | Cookstown | 18.2% | 10.7%(+7.52)#80 | 11.1%(+7.11)#6,413 |
| 81. | Trenton | 18.2% | 10.7%(+7.52)#81 | 11.1%(+7.11)#6,460 |
| 82. | Metuchen Borough | 17.7% | 10.7%(+7.08)#82 | 11.1%(+6.68)#6,618 |
| 83. | Marlton | 17.7% | 10.7%(+7.06)#83 | 11.1%(+6.66)#6,626 |
| 84. | Union | 17.7% | 10.7%(+7.03)#84 | 11.1%(+6.62)#6,646 |
| 85. | Woodbury | 17.6% | 10.7%(+6.92)#85 | 11.1%(+6.52)#6,715 |
| 86. | East Orange | 17.5% | 10.7%(+6.81)#86 | 11.1%(+6.41)#6,757 |
| 87. | Thorofare | 17.3% | 10.7%(+6.68)#87 | 11.1%(+6.27)#6,816 |
| 88. | Collingswood Borough | 17.3% | 10.7%(+6.61)#88 | 11.1%(+6.21)#6,842 |
| 89. | Panther Valley | 17.2% | 10.7%(+6.52)#89 | 11.1%(+6.12)#6,881 |
| 90. | Palmyra Borough | 17.1% | 10.7%(+6.45)#90 | 11.1%(+6.04)#6,917 |
| 91. | Glassboro Borough | 16.9% | 10.7%(+6.26)#91 | 11.1%(+5.86)#7,002 |
| 92. | Hammonton | 16.9% | 10.7%(+6.21)#92 | 11.1%(+5.81)#7,016 |
| 93. | Hackensack | 16.8% | 10.7%(+6.13)#93 | 11.1%(+5.72)#7,045 |
| 94. | Palisades Park Borough | 16.7% | 10.7%(+6.02)#94 | 11.1%(+5.62)#7,072 |
| 95. | Brass Castle | 16.7% | 10.7%(+6.00)#95 | 11.1%(+5.60)#7,093 |
| 96. | Pedricktown | 16.7% | 10.7%(+6.00)#96 | 11.1%(+5.60)#7,160 |
| 97. | Florham Park Borough | 16.5% | 10.7%(+5.88)#97 | 11.1%(+5.48)#7,265 |
| 98. | Sewell | 16.4% | 10.7%(+5.73)#98 | 11.1%(+5.33)#7,332 |
| 99. | Caldwell Borough | 16.3% | 10.7%(+5.67)#99 | 11.1%(+5.27)#7,348 |
| 100. | Peapack And Gladstone Borough | 16.3% | 10.7%(+5.66)#100 | 11.1%(+5.26)#7,352 |
Common Questions
What are the Top 10 Cities with the Highest Poverty Level Among Seniors Over the Age of 75 in New Jersey?
Top 10 Cities with the Highest Poverty Level Among Seniors Over the Age of 75 in New Jersey are:
#1
62.4%
#2
60.0%
#3
54.5%
#4
45.5%
#5
44.5%
#6
43.5%
#7
43.3%
#8
38.3%
#9
37.4%
#10
36.0%
What city has the Highest Poverty Level Among Seniors Over the Age of 75 in New Jersey?
Seabrook Farms has the Highest Poverty Level Among Seniors Over the Age of 75 in New Jersey with 62.4%.
What is the Poverty Level Among Seniors Over the Age of 75 in the State of New Jersey?
Poverty Level Among Seniors Over the Age of 75 in New Jersey is 10.7%.
What is the Poverty Level Among Seniors Over the Age of 75 in the United States?
Poverty Level Among Seniors Over the Age of 75 in the United States is 11.1%.