Cities with the Highest Percentage of Immigrants from Europe in New Jersey
RELATED REPORTS & OPTIONS
Europe
New Jersey
Compare Cities
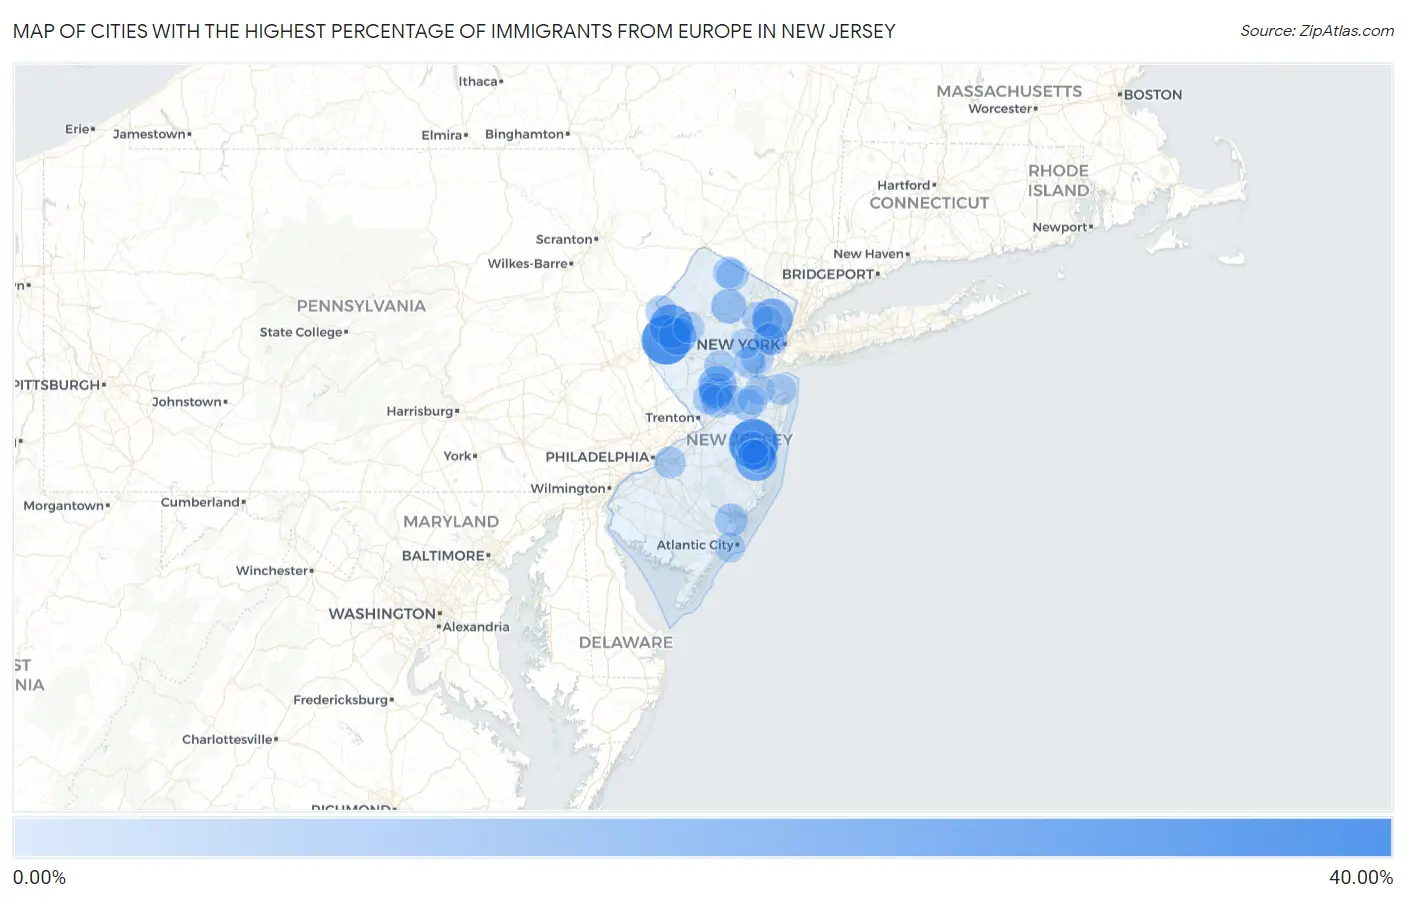
Map of Cities with the Highest Percentage of Immigrants from Europe in New Jersey
0.00%
40.00%
Cities with the Highest Percentage of Immigrants from Europe in New Jersey
| City | Europe | vs State | vs National | |
| 1. | Wallington Borough | 33.45% | 3.19%(+30.3)#1 | 1.46%(+32.0)#14 |
| 2. | Cedar Glen West | 33.07% | 3.19%(+29.9)#2 | 1.46%(+31.6)#15 |
| 3. | Broadway | 32.43% | 3.19%(+29.2)#3 | 1.46%(+31.0)#16 |
| 4. | Buttzville | 24.27% | 3.19%(+21.1)#4 | 1.46%(+22.8)#35 |
| 5. | Holiday Heights | 22.30% | 3.19%(+19.1)#5 | 1.46%(+20.8)#37 |
| 6. | Lebanon Borough | 21.83% | 3.19%(+18.6)#6 | 1.46%(+20.4)#38 |
| 7. | Garfield | 20.18% | 3.19%(+17.0)#7 | 1.46%(+18.7)#47 |
| 8. | Gandys Beach | 20.00% | 3.19%(+16.8)#8 | 1.46%(+18.5)#48 |
| 9. | Griggstown | 17.33% | 3.19%(+14.1)#9 | 1.46%(+15.9)#61 |
| 10. | Port Colden | 16.44% | 3.19%(+13.3)#10 | 1.46%(+15.0)#72 |
| 11. | East Vineland | 14.26% | 3.19%(+11.1)#11 | 1.46%(+12.8)#95 |
| 12. | Renaissance At Monroe | 14.04% | 3.19%(+10.8)#12 | 1.46%(+12.6)#102 |
| 13. | Fair Lawn Borough | 13.23% | 3.19%(+10.0)#13 | 1.46%(+11.8)#114 |
| 14. | Lake Telemark | 12.61% | 3.19%(+9.42)#14 | 1.46%(+11.1)#123 |
| 15. | East Rocky Hill | 12.41% | 3.19%(+9.22)#15 | 1.46%(+11.0)#131 |
| 16. | Elmwood Park Borough | 12.30% | 3.19%(+9.11)#16 | 1.46%(+10.8)#133 |
| 17. | Hewitt | 12.09% | 3.19%(+8.90)#17 | 1.46%(+10.6)#139 |
| 18. | Seeley | 11.25% | 3.19%(+8.06)#18 | 1.46%(+9.79)#160 |
| 19. | Silver Ridge | 11.10% | 3.19%(+7.91)#19 | 1.46%(+9.64)#167 |
| 20. | Cliffside Park Borough | 10.42% | 3.19%(+7.23)#20 | 1.46%(+8.97)#188 |
| 21. | North Arlington Borough | 10.36% | 3.19%(+7.17)#21 | 1.46%(+8.90)#193 |
| 22. | Rocky Hill Borough | 10.33% | 3.19%(+7.14)#22 | 1.46%(+8.87)#194 |
| 23. | Linden | 10.28% | 3.19%(+7.09)#23 | 1.46%(+8.82)#196 |
| 24. | Pines Lake | 10.25% | 3.19%(+7.06)#24 | 1.46%(+8.79)#198 |
| 25. | Clearbrook | 10.22% | 3.19%(+7.03)#25 | 1.46%(+8.76)#200 |
| 26. | Cream Ridge | 10.21% | 3.19%(+7.02)#26 | 1.46%(+8.76)#201 |
| 27. | Richland | 10.04% | 3.19%(+6.85)#27 | 1.46%(+8.58)#210 |
| 28. | Connecticut Farms | 9.94% | 3.19%(+6.75)#28 | 1.46%(+8.48)#217 |
| 29. | Kearny | 9.76% | 3.19%(+6.57)#29 | 1.46%(+8.30)#225 |
| 30. | Kingston | 9.70% | 3.19%(+6.51)#30 | 1.46%(+8.24)#228 |
| 31. | Port Republic | 9.69% | 3.19%(+6.50)#31 | 1.46%(+8.24)#230 |
| 32. | Plainsboro Center | 9.54% | 3.19%(+6.35)#32 | 1.46%(+8.09)#239 |
| 33. | Fortescue | 9.20% | 3.19%(+6.01)#33 | 1.46%(+7.74)#259 |
| 34. | Mizpah | 9.09% | 3.19%(+5.90)#34 | 1.46%(+7.64)#268 |
| 35. | Heislerville | 9.09% | 3.19%(+5.90)#35 | 1.46%(+7.64)#269 |
| 36. | Allenhurst Borough | 8.98% | 3.19%(+5.79)#36 | 1.46%(+7.52)#274 |
| 37. | Englishtown Borough | 8.83% | 3.19%(+5.64)#37 | 1.46%(+7.37)#284 |
| 38. | Leisure Knoll | 8.77% | 3.19%(+5.58)#38 | 1.46%(+7.32)#290 |
| 39. | Mendham Borough | 8.57% | 3.19%(+5.39)#39 | 1.46%(+7.12)#301 |
| 40. | Lincoln Park Borough | 8.55% | 3.19%(+5.36)#40 | 1.46%(+7.10)#304 |
| 41. | Edgewater Borough | 8.45% | 3.19%(+5.27)#41 | 1.46%(+7.00)#312 |
| 42. | Tavistock Borough | 8.33% | 3.19%(+5.14)#42 | 1.46%(+6.88)#323 |
| 43. | Colonia | 8.31% | 3.19%(+5.12)#43 | 1.46%(+6.85)#324 |
| 44. | Ellisburg | 8.14% | 3.19%(+4.95)#44 | 1.46%(+6.69)#338 |
| 45. | Rockleigh Borough | 8.11% | 3.19%(+4.92)#45 | 1.46%(+6.66)#342 |
| 46. | Finderne | 8.11% | 3.19%(+4.92)#46 | 1.46%(+6.66)#343 |
| 47. | Highland Lakes | 8.02% | 3.19%(+4.83)#47 | 1.46%(+6.57)#352 |
| 48. | South River Borough | 8.00% | 3.19%(+4.81)#48 | 1.46%(+6.54)#356 |
| 49. | Princeton | 7.99% | 3.19%(+4.80)#49 | 1.46%(+6.53)#358 |
| 50. | Yorketown | 7.98% | 3.19%(+4.79)#50 | 1.46%(+6.52)#360 |
| 51. | Lodi Borough | 7.81% | 3.19%(+4.62)#51 | 1.46%(+6.35)#375 |
| 52. | Cedar Knolls | 7.77% | 3.19%(+4.58)#52 | 1.46%(+6.32)#380 |
| 53. | Vernon Center | 7.70% | 3.19%(+4.51)#53 | 1.46%(+6.25)#386 |
| 54. | Columbia | 7.66% | 3.19%(+4.47)#54 | 1.46%(+6.20)#390 |
| 55. | Englewood Cliffs Borough | 7.63% | 3.19%(+4.44)#55 | 1.46%(+6.17)#392 |
| 56. | Dorothy | 7.60% | 3.19%(+4.42)#56 | 1.46%(+6.15)#397 |
| 57. | Kenilworth Borough | 7.55% | 3.19%(+4.36)#57 | 1.46%(+6.09)#406 |
| 58. | Beattystown | 7.52% | 3.19%(+4.33)#58 | 1.46%(+6.06)#410 |
| 59. | Singac | 7.43% | 3.19%(+4.24)#59 | 1.46%(+5.97)#424 |
| 60. | Cranford | 7.41% | 3.19%(+4.22)#60 | 1.46%(+5.95)#426 |
| 61. | Llewellyn Park | 7.34% | 3.19%(+4.15)#61 | 1.46%(+5.89)#431 |
| 62. | Mountainside Borough | 7.24% | 3.19%(+4.05)#62 | 1.46%(+5.78)#443 |
| 63. | North Haledon Borough | 7.24% | 3.19%(+4.05)#63 | 1.46%(+5.78)#444 |
| 64. | Carlstadt Borough | 7.13% | 3.19%(+3.94)#64 | 1.46%(+5.67)#457 |
| 65. | Macopin | 7.11% | 3.19%(+3.92)#65 | 1.46%(+5.65)#460 |
| 66. | Towaco | 7.08% | 3.19%(+3.89)#66 | 1.46%(+5.62)#462 |
| 67. | Fairview Borough | 7.04% | 3.19%(+3.85)#67 | 1.46%(+5.58)#466 |
| 68. | Green | 7.00% | 3.19%(+3.82)#68 | 1.46%(+5.55)#469 |
| 69. | Holiday City Berkeley | 6.98% | 3.19%(+3.79)#69 | 1.46%(+5.52)#476 |
| 70. | Woodland Park Borough | 6.80% | 3.19%(+3.61)#70 | 1.46%(+5.35)#504 |
| 71. | Fort Lee Borough | 6.66% | 3.19%(+3.47)#71 | 1.46%(+5.21)#529 |
| 72. | Oakland Borough | 6.64% | 3.19%(+3.45)#72 | 1.46%(+5.19)#535 |
| 73. | Navesink | 6.60% | 3.19%(+3.41)#73 | 1.46%(+5.15)#541 |
| 74. | Little Ferry Borough | 6.57% | 3.19%(+3.38)#74 | 1.46%(+5.12)#546 |
| 75. | Pleasantdale | 6.54% | 3.19%(+3.35)#75 | 1.46%(+5.08)#556 |
| 76. | Clifton | 6.54% | 3.19%(+3.35)#76 | 1.46%(+5.08)#559 |
| 77. | East Rutherford Borough | 6.48% | 3.19%(+3.29)#77 | 1.46%(+5.02)#571 |
| 78. | Millington | 6.39% | 3.19%(+3.20)#78 | 1.46%(+4.94)#593 |
| 79. | Cresskill Borough | 6.25% | 3.19%(+3.06)#79 | 1.46%(+4.79)#621 |
| 80. | Hasbrouck Heights Borough | 6.19% | 3.19%(+3.00)#80 | 1.46%(+4.74)#626 |
| 81. | Demarest Borough | 6.19% | 3.19%(+3.00)#81 | 1.46%(+4.73)#627 |
| 82. | Summit | 6.13% | 3.19%(+2.94)#82 | 1.46%(+4.68)#641 |
| 83. | Rossmoor | 6.10% | 3.19%(+2.91)#83 | 1.46%(+4.64)#647 |
| 84. | Upper Greenwood Lake | 6.09% | 3.19%(+2.90)#84 | 1.46%(+4.63)#648 |
| 85. | Hawthorne Borough | 6.08% | 3.19%(+2.89)#85 | 1.46%(+4.62)#651 |
| 86. | Brookside | 6.07% | 3.19%(+2.88)#86 | 1.46%(+4.61)#657 |
| 87. | Harrison | 6.06% | 3.19%(+2.87)#87 | 1.46%(+4.61)#658 |
| 88. | Strathmore | 6.05% | 3.19%(+2.86)#88 | 1.46%(+4.60)#661 |
| 89. | Robertsville | 6.04% | 3.19%(+2.85)#89 | 1.46%(+4.59)#667 |
| 90. | Ventnor City | 6.02% | 3.19%(+2.83)#90 | 1.46%(+4.56)#673 |
| 91. | Highland Park Borough | 6.00% | 3.19%(+2.81)#91 | 1.46%(+4.55)#675 |
| 92. | Helmetta Borough | 5.95% | 3.19%(+2.76)#92 | 1.46%(+4.50)#683 |
| 93. | Saddle River Borough | 5.95% | 3.19%(+2.76)#93 | 1.46%(+4.49)#686 |
| 94. | Jobstown | 5.94% | 3.19%(+2.75)#94 | 1.46%(+4.49)#689 |
| 95. | Regency At Monroe | 5.93% | 3.19%(+2.74)#95 | 1.46%(+4.48)#691 |
| 96. | Bedminster | 5.92% | 3.19%(+2.73)#96 | 1.46%(+4.46)#699 |
| 97. | Springfield | 5.89% | 3.19%(+2.70)#97 | 1.46%(+4.43)#703 |
| 98. | Fieldsboro Borough | 5.87% | 3.19%(+2.68)#98 | 1.46%(+4.42)#707 |
| 99. | Pompton Lakes Borough | 5.85% | 3.19%(+2.66)#99 | 1.46%(+4.39)#713 |
| 100. | Haledon Borough | 5.84% | 3.19%(+2.65)#100 | 1.46%(+4.38)#716 |
Common Questions
What are the Top 10 Cities with the Highest Percentage of Immigrants from Europe in New Jersey?
Top 10 Cities with the Highest Percentage of Immigrants from Europe in New Jersey are:
#1
33.07%
#2
32.43%
#3
24.27%
#4
22.30%
#5
20.18%
#6
17.33%
#7
16.44%
#8
12.61%
#9
12.41%
#10
11.10%
What city has the Highest Percentage of Immigrants from Europe in New Jersey?
Cedar Glen West has the Highest Percentage of Immigrants from Europe in New Jersey with 33.07%.
What is the Percentage of Immigrants from Europe in the State of New Jersey?
Percentage of Immigrants from Europe in New Jersey is 3.19%.
What is the Percentage of Immigrants from Europe in the United States?
Percentage of Immigrants from Europe in the United States is 1.46%.