Cities with the Largest Danish Community in New Jersey
RELATED REPORTS & OPTIONS
Danish
New Jersey
Compare Cities
Map of Cities with the Largest Danish Community in New Jersey
0
500
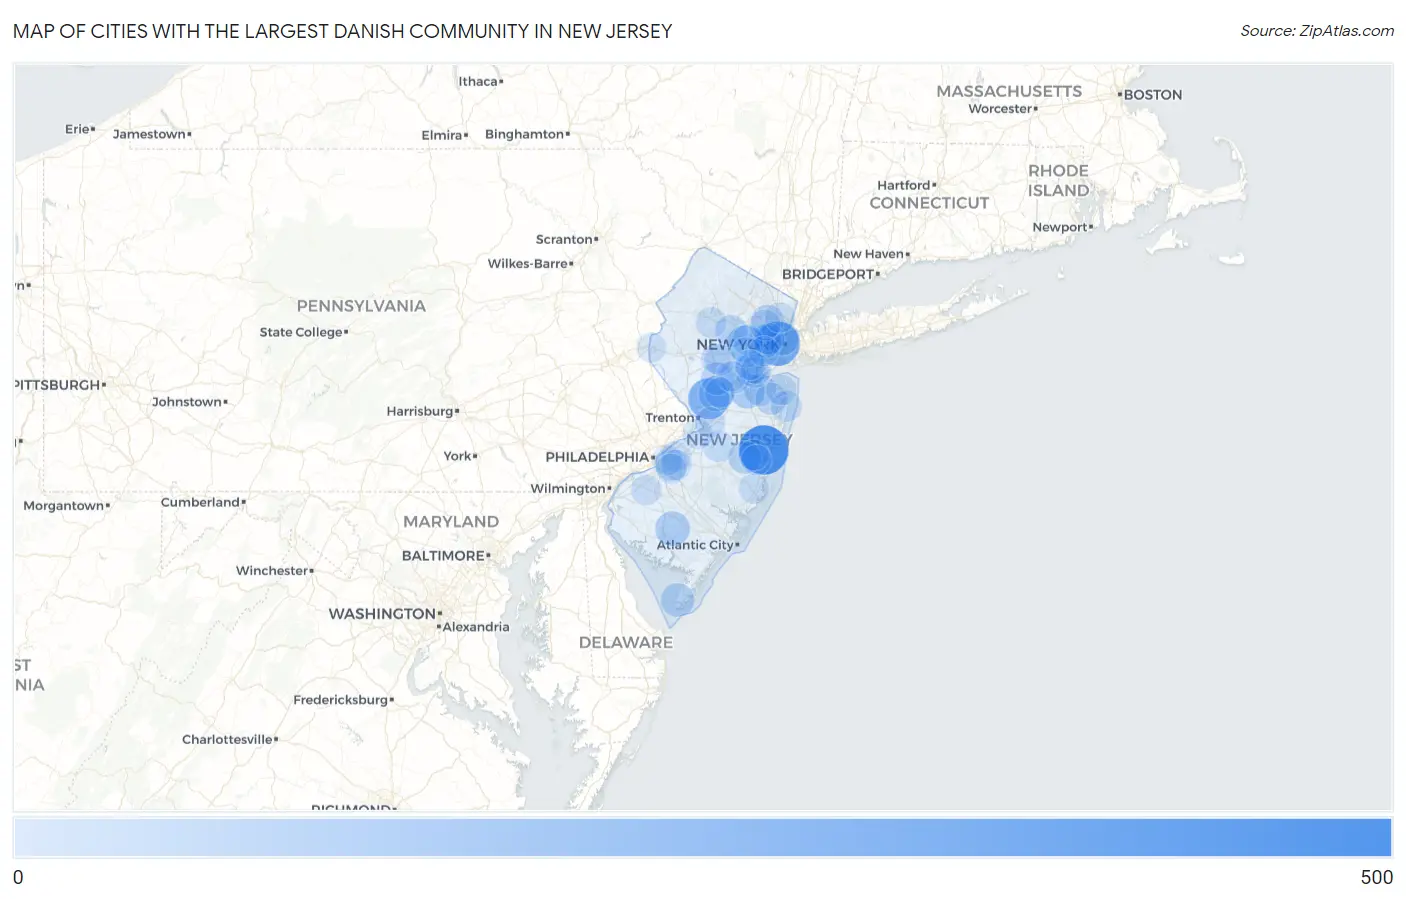
Cities with the Largest Danish Community in New Jersey
| City | Danish | vs State | vs National | |
| 1. | Toms River | 455 | 15,084(3.02%)#1 | 1,182,895(0.04%)#358 |
| 2. | Jersey City | 344 | 15,084(2.28%)#2 | 1,182,895(0.03%)#500 |
| 3. | Princeton | 264 | 15,084(1.75%)#3 | 1,182,895(0.02%)#694 |
| 4. | Summit | 157 | 15,084(1.04%)#4 | 1,182,895(0.01%)#1,177 |
| 5. | Kingston | 139 | 15,084(0.92%)#5 | 1,182,895(0.01%)#1,327 |
| 6. | The Hills | 133 | 15,084(0.88%)#6 | 1,182,895(0.01%)#1,376 |
| 7. | Vineland | 122 | 15,084(0.81%)#7 | 1,182,895(0.01%)#1,475 |
| 8. | Old Bridge | 120 | 15,084(0.80%)#8 | 1,182,895(0.01%)#1,504 |
| 9. | Hopelawn | 115 | 15,084(0.76%)#9 | 1,182,895(0.01%)#1,556 |
| 10. | South Plainfield Borough | 110 | 15,084(0.73%)#10 | 1,182,895(0.01%)#1,611 |
| 11. | North Cape May | 101 | 15,084(0.67%)#11 | 1,182,895(0.01%)#1,749 |
| 12. | Sayreville Borough | 98 | 15,084(0.65%)#12 | 1,182,895(0.01%)#1,785 |
| 13. | Hoboken | 95 | 15,084(0.63%)#13 | 1,182,895(0.01%)#1,833 |
| 14. | Newark | 93 | 15,084(0.62%)#14 | 1,182,895(0.01%)#1,867 |
| 15. | Oceanport Borough | 90 | 15,084(0.60%)#15 | 1,182,895(0.01%)#1,915 |
| 16. | Westmont | 89 | 15,084(0.59%)#16 | 1,182,895(0.01%)#1,924 |
| 17. | Blackwells Mills | 87 | 15,084(0.58%)#17 | 1,182,895(0.01%)#1,963 |
| 18. | Flanders | 86 | 15,084(0.57%)#18 | 1,182,895(0.01%)#1,991 |
| 19. | Fort Lee Borough | 85 | 15,084(0.56%)#19 | 1,182,895(0.01%)#2,005 |
| 20. | Red Bank Borough | 85 | 15,084(0.56%)#20 | 1,182,895(0.01%)#2,013 |
| 21. | Clifton | 84 | 15,084(0.56%)#21 | 1,182,895(0.01%)#2,024 |
| 22. | Crestwood Village | 81 | 15,084(0.54%)#22 | 1,182,895(0.01%)#2,093 |
| 23. | Metuchen Borough | 80 | 15,084(0.53%)#23 | 1,182,895(0.01%)#2,108 |
| 24. | Little Silver Borough | 80 | 15,084(0.53%)#24 | 1,182,895(0.01%)#2,112 |
| 25. | Spotswood Borough | 79 | 15,084(0.52%)#25 | 1,182,895(0.01%)#2,126 |
| 26. | Morristown | 75 | 15,084(0.50%)#26 | 1,182,895(0.01%)#2,207 |
| 27. | Allendale Borough | 74 | 15,084(0.49%)#27 | 1,182,895(0.01%)#2,245 |
| 28. | Strathmore | 71 | 15,084(0.47%)#28 | 1,182,895(0.01%)#2,316 |
| 29. | Green | 70 | 15,084(0.46%)#29 | 1,182,895(0.01%)#2,348 |
| 30. | Mountainside Borough | 69 | 15,084(0.46%)#30 | 1,182,895(0.01%)#2,372 |
| 31. | Florham Park Borough | 67 | 15,084(0.44%)#31 | 1,182,895(0.01%)#2,417 |
| 32. | Lincroft | 67 | 15,084(0.44%)#32 | 1,182,895(0.01%)#2,424 |
| 33. | Flemington Borough | 67 | 15,084(0.44%)#33 | 1,182,895(0.01%)#2,429 |
| 34. | Hillsborough | 66 | 15,084(0.44%)#34 | 1,182,895(0.01%)#2,446 |
| 35. | Highland Park Borough | 66 | 15,084(0.44%)#35 | 1,182,895(0.01%)#2,449 |
| 36. | Mountain Lakes Borough | 66 | 15,084(0.44%)#36 | 1,182,895(0.01%)#2,469 |
| 37. | Riverton Borough | 66 | 15,084(0.44%)#37 | 1,182,895(0.01%)#2,471 |
| 38. | Woodbridge | 62 | 15,084(0.41%)#38 | 1,182,895(0.01%)#2,571 |
| 39. | Madison Borough | 62 | 15,084(0.41%)#39 | 1,182,895(0.01%)#2,573 |
| 40. | Barclay | 57 | 15,084(0.38%)#40 | 1,182,895(0.00%)#2,754 |
| 41. | Fords | 56 | 15,084(0.37%)#41 | 1,182,895(0.00%)#2,776 |
| 42. | New Brunswick | 55 | 15,084(0.36%)#42 | 1,182,895(0.00%)#2,803 |
| 43. | Waldwick Borough | 53 | 15,084(0.35%)#43 | 1,182,895(0.00%)#2,879 |
| 44. | Long Branch | 51 | 15,084(0.34%)#44 | 1,182,895(0.00%)#2,945 |
| 45. | Mcguire Afb | 51 | 15,084(0.34%)#45 | 1,182,895(0.00%)#2,969 |
| 46. | Beachwood Borough | 49 | 15,084(0.32%)#46 | 1,182,895(0.00%)#3,025 |
| 47. | Lake Hopatcong | 49 | 15,084(0.32%)#47 | 1,182,895(0.00%)#3,026 |
| 48. | Harrison | 47 | 15,084(0.31%)#48 | 1,182,895(0.00%)#3,101 |
| 49. | River Edge Borough | 47 | 15,084(0.31%)#49 | 1,182,895(0.00%)#3,106 |
| 50. | Upper Saddle River Borough | 46 | 15,084(0.30%)#50 | 1,182,895(0.00%)#3,148 |
| 51. | Keyport Borough | 46 | 15,084(0.30%)#51 | 1,182,895(0.00%)#3,155 |
| 52. | Carlstadt Borough | 45 | 15,084(0.30%)#52 | 1,182,895(0.00%)#3,208 |
| 53. | Ramsey Borough | 44 | 15,084(0.29%)#53 | 1,182,895(0.00%)#3,249 |
| 54. | Martinsville | 43 | 15,084(0.29%)#54 | 1,182,895(0.00%)#3,294 |
| 55. | South Dennis | 43 | 15,084(0.29%)#55 | 1,182,895(0.00%)#3,321 |
| 56. | Short Hills | 42 | 15,084(0.28%)#56 | 1,182,895(0.00%)#3,340 |
| 57. | Caldwell Borough | 41 | 15,084(0.27%)#57 | 1,182,895(0.00%)#3,405 |
| 58. | Holiday City Berkeley | 40 | 15,084(0.27%)#58 | 1,182,895(0.00%)#3,454 |
| 59. | Brookdale | 40 | 15,084(0.27%)#59 | 1,182,895(0.00%)#3,460 |
| 60. | Hewitt | 40 | 15,084(0.27%)#60 | 1,182,895(0.00%)#3,479 |
| 61. | Succasunna | 39 | 15,084(0.26%)#61 | 1,182,895(0.00%)#3,512 |
| 62. | Monmouth Beach Borough | 39 | 15,084(0.26%)#62 | 1,182,895(0.00%)#3,533 |
| 63. | Surf City Borough | 39 | 15,084(0.26%)#63 | 1,182,895(0.00%)#3,549 |
| 64. | Glassboro Borough | 38 | 15,084(0.25%)#64 | 1,182,895(0.00%)#3,566 |
| 65. | Flagtown | 38 | 15,084(0.25%)#65 | 1,182,895(0.00%)#3,611 |
| 66. | Moorestown Lenola | 37 | 15,084(0.25%)#66 | 1,182,895(0.00%)#3,626 |
| 67. | Ledgewood | 37 | 15,084(0.25%)#67 | 1,182,895(0.00%)#3,645 |
| 68. | Green Knoll | 36 | 15,084(0.24%)#68 | 1,182,895(0.00%)#3,708 |
| 69. | Navesink | 36 | 15,084(0.24%)#69 | 1,182,895(0.00%)#3,732 |
| 70. | Bernardsville Borough | 35 | 15,084(0.23%)#70 | 1,182,895(0.00%)#3,785 |
| 71. | Perth Amboy | 34 | 15,084(0.23%)#71 | 1,182,895(0.00%)#3,827 |
| 72. | Fanwood Borough | 34 | 15,084(0.23%)#72 | 1,182,895(0.00%)#3,855 |
| 73. | Spring Lake Heights Borough | 34 | 15,084(0.23%)#73 | 1,182,895(0.00%)#3,862 |
| 74. | Mullica Hill | 34 | 15,084(0.23%)#74 | 1,182,895(0.00%)#3,864 |
| 75. | Ocean Acres | 33 | 15,084(0.22%)#75 | 1,182,895(0.00%)#3,908 |
| 76. | New Milford Borough | 33 | 15,084(0.22%)#76 | 1,182,895(0.00%)#3,909 |
| 77. | Roebling | 33 | 15,084(0.22%)#77 | 1,182,895(0.00%)#3,934 |
| 78. | East Franklin | 32 | 15,084(0.21%)#78 | 1,182,895(0.00%)#3,995 |
| 79. | West Long Branch Borough | 32 | 15,084(0.21%)#79 | 1,182,895(0.00%)#3,997 |
| 80. | Yardville | 32 | 15,084(0.21%)#80 | 1,182,895(0.00%)#4,003 |
| 81. | Golden Triangle | 32 | 15,084(0.21%)#81 | 1,182,895(0.00%)#4,007 |
| 82. | Westfield | 31 | 15,084(0.21%)#82 | 1,182,895(0.00%)#4,050 |
| 83. | Greentree | 31 | 15,084(0.21%)#83 | 1,182,895(0.00%)#4,063 |
| 84. | The College Of New Jersey | 31 | 15,084(0.21%)#84 | 1,182,895(0.00%)#4,079 |
| 85. | National Park Borough | 31 | 15,084(0.21%)#85 | 1,182,895(0.00%)#4,092 |
| 86. | Pennington Borough | 31 | 15,084(0.21%)#86 | 1,182,895(0.00%)#4,094 |
| 87. | Holiday Heights | 31 | 15,084(0.21%)#87 | 1,182,895(0.00%)#4,106 |
| 88. | Hackensack | 30 | 15,084(0.20%)#88 | 1,182,895(0.00%)#4,128 |
| 89. | Pompton Plains | 30 | 15,084(0.20%)#89 | 1,182,895(0.00%)#4,147 |
| 90. | Heathcote | 30 | 15,084(0.20%)#90 | 1,182,895(0.00%)#4,155 |
| 91. | Ashland | 29 | 15,084(0.19%)#91 | 1,182,895(0.00%)#4,226 |
| 92. | Sewaren | 29 | 15,084(0.19%)#92 | 1,182,895(0.00%)#4,253 |
| 93. | Gillette | 29 | 15,084(0.19%)#93 | 1,182,895(0.00%)#4,256 |
| 94. | Elizabeth | 28 | 15,084(0.19%)#94 | 1,182,895(0.00%)#4,285 |
| 95. | Cliffside Park Borough | 28 | 15,084(0.19%)#95 | 1,182,895(0.00%)#4,292 |
| 96. | Lindenwold Borough | 28 | 15,084(0.19%)#96 | 1,182,895(0.00%)#4,296 |
| 97. | Fair Haven Borough | 28 | 15,084(0.19%)#97 | 1,182,895(0.00%)#4,318 |
| 98. | Hightstown Borough | 28 | 15,084(0.19%)#98 | 1,182,895(0.00%)#4,323 |
| 99. | Iselin | 27 | 15,084(0.18%)#99 | 1,182,895(0.00%)#4,378 |
| 100. | Phillipsburg | 27 | 15,084(0.18%)#100 | 1,182,895(0.00%)#4,386 |
Common Questions
What are the Top 10 Cities with the Largest Danish Community in New Jersey?
Top 10 Cities with the Largest Danish Community in New Jersey are:
#1
455
#2
344
#3
264
#4
157
#5
139
#6
122
#7
120
#8
101
#9
95
#10
93
What city has the Largest Danish Community in New Jersey?
Toms River has the Largest Danish Community in New Jersey with 455.
What is the Total Danish Population in the State of New Jersey?
Total Danish Population in New Jersey is 15,084.
What is the Total Danish Population in the United States?
Total Danish Population in the United States is 1,182,895.