Cities with the Most Immigrants from Bosnia and Herzegovina in New Jersey
RELATED REPORTS & OPTIONS
Bosnia and Herzegovina
New Jersey
Compare Cities
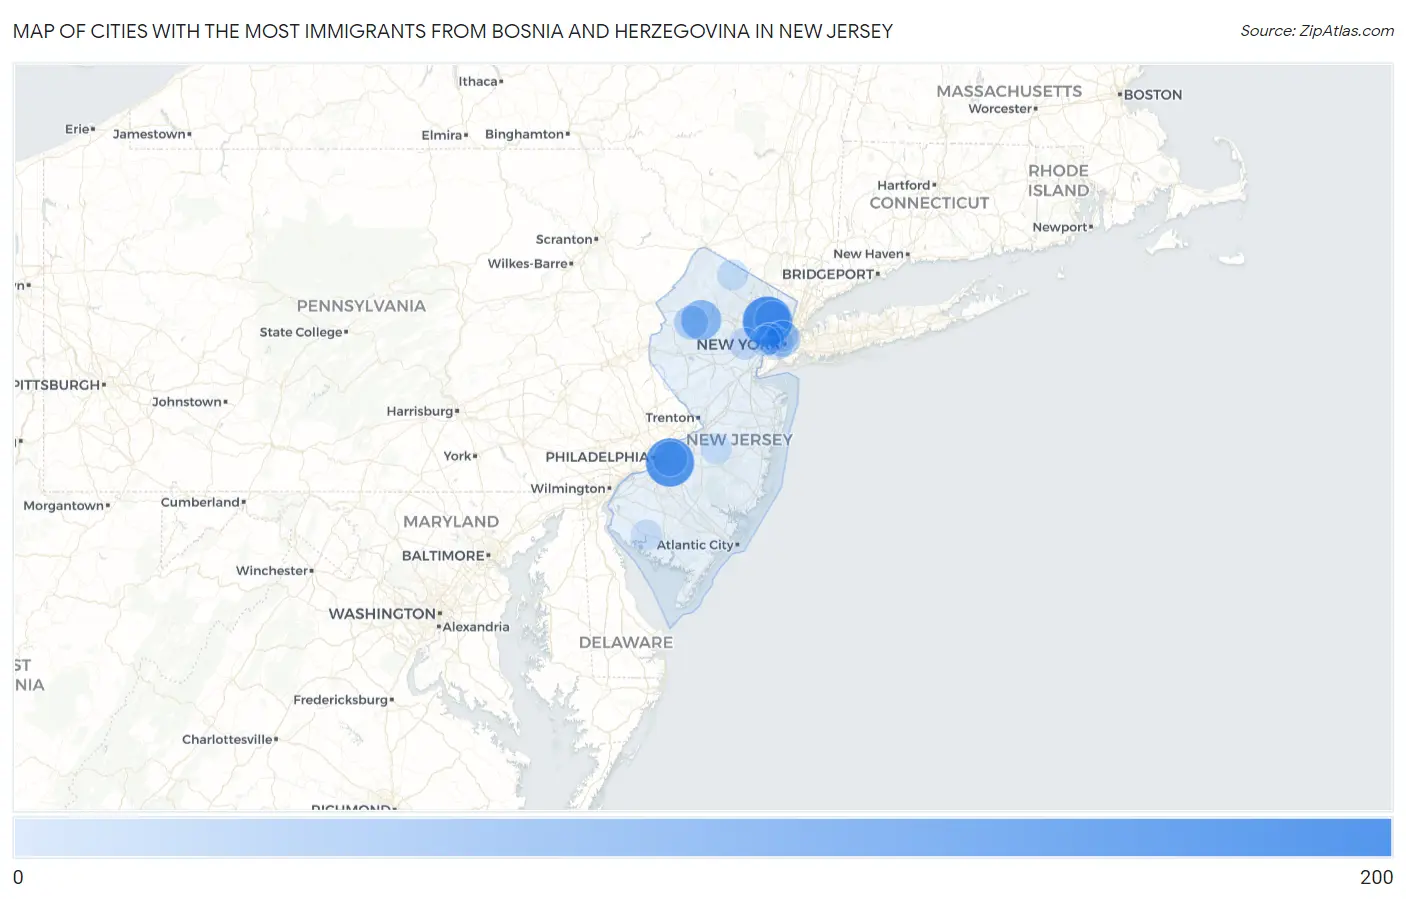
Map of Cities with the Most Immigrants from Bosnia and Herzegovina in New Jersey
0
200
Cities with the Most Immigrants from Bosnia and Herzegovina in New Jersey
| City | Bosnia and Herzegovina | vs State | vs National | |
| 1. | Clifton | 182 | 1,406(12.94%)#1 | 106,359(0.17%)#95 |
| 2. | Ellisburg | 170 | 1,406(12.09%)#2 | 106,359(0.16%)#108 |
| 3. | Budd Lake | 91 | 1,406(6.47%)#3 | 106,359(0.09%)#197 |
| 4. | Kinnelon Borough | 66 | 1,406(4.69%)#4 | 106,359(0.06%)#271 |
| 5. | Wallington Borough | 58 | 1,406(4.13%)#5 | 106,359(0.05%)#301 |
| 6. | Hoboken | 55 | 1,406(3.91%)#6 | 106,359(0.05%)#315 |
| 7. | Garfield | 49 | 1,406(3.49%)#7 | 106,359(0.05%)#347 |
| 8. | Cherry Hill Mall | 45 | 1,406(3.20%)#8 | 106,359(0.04%)#374 |
| 9. | Glen Ridge Borough | 39 | 1,406(2.77%)#9 | 106,359(0.04%)#414 |
| 10. | Hackettstown | 36 | 1,406(2.56%)#10 | 106,359(0.03%)#435 |
| 11. | Flanders | 36 | 1,406(2.56%)#11 | 106,359(0.03%)#436 |
| 12. | Robbinsville Center | 35 | 1,406(2.49%)#12 | 106,359(0.03%)#445 |
| 13. | Collingswood Borough | 33 | 1,406(2.35%)#13 | 106,359(0.03%)#457 |
| 14. | East Rutherford Borough | 28 | 1,406(1.99%)#14 | 106,359(0.03%)#510 |
| 15. | Jersey City | 19 | 1,406(1.35%)#15 | 106,359(0.02%)#612 |
| 16. | Summit | 18 | 1,406(1.28%)#16 | 106,359(0.02%)#644 |
| 17. | Cedar Knolls | 16 | 1,406(1.14%)#17 | 106,359(0.02%)#702 |
| 18. | Florham Park Borough | 15 | 1,406(1.07%)#18 | 106,359(0.01%)#718 |
| 19. | Bound Brook Borough | 15 | 1,406(1.07%)#19 | 106,359(0.01%)#719 |
| 20. | Freehold Borough | 14 | 1,406(1.00%)#20 | 106,359(0.01%)#747 |
| 21. | River Edge Borough | 13 | 1,406(0.92%)#21 | 106,359(0.01%)#764 |
| 22. | Tenafly Borough | 12 | 1,406(0.85%)#22 | 106,359(0.01%)#791 |
| 23. | Matawan Borough | 12 | 1,406(0.85%)#23 | 106,359(0.01%)#795 |
| 24. | Kearny | 11 | 1,406(0.78%)#24 | 106,359(0.01%)#810 |
| 25. | Union City | 10 | 1,406(0.71%)#25 | 106,359(0.01%)#835 |
| 26. | Butler Borough | 9 | 1,406(0.64%)#26 | 106,359(0.01%)#894 |
| 27. | Highland Lakes | 9 | 1,406(0.64%)#27 | 106,359(0.01%)#901 |
| 28. | Fair Lawn Borough | 8 | 1,406(0.57%)#28 | 106,359(0.01%)#917 |
| 29. | Fort Dix | 8 | 1,406(0.57%)#29 | 106,359(0.01%)#931 |
| 30. | Bridgeton | 7 | 1,406(0.50%)#30 | 106,359(0.01%)#944 |
| 31. | Harrison | 7 | 1,406(0.50%)#31 | 106,359(0.01%)#949 |
| 32. | Metuchen Borough | 7 | 1,406(0.50%)#32 | 106,359(0.01%)#954 |
| 33. | Stanhope Borough | 6 | 1,406(0.43%)#33 | 106,359(0.01%)#983 |
| 34. | Newark | 4 | 1,406(0.28%)#34 | 106,359(0.00%)#1,011 |
| 35. | Roselle Park Borough | 4 | 1,406(0.28%)#35 | 106,359(0.00%)#1,021 |
| 36. | Haddonfield Borough | 4 | 1,406(0.28%)#36 | 106,359(0.00%)#1,022 |
| 37. | Hopewell Borough | 3 | 1,406(0.21%)#37 | 106,359(0.00%)#1,037 |
Common Questions
What are the Top 10 Cities with the Most Immigrants from Bosnia and Herzegovina in New Jersey?
Top 10 Cities with the Most Immigrants from Bosnia and Herzegovina in New Jersey are:
#1
182
#2
170
#3
91
#4
55
#5
49
#6
45
#7
36
#8
19
#9
18
#10
11
What city has the Most Immigrants from Bosnia and Herzegovina in New Jersey?
Clifton has the Most Immigrants from Bosnia and Herzegovina in New Jersey with 182.
What is the Total Immigrants from Bosnia and Herzegovina in the State of New Jersey?
Total Immigrants from Bosnia and Herzegovina in New Jersey is 1,406.
What is the Total Immigrants from Bosnia and Herzegovina in the United States?
Total Immigrants from Bosnia and Herzegovina in the United States is 106,359.