Cities with the Highest Percentage of Guyanese Population in New Jersey
RELATED REPORTS & OPTIONS
Guyanese
New Jersey
Compare Cities
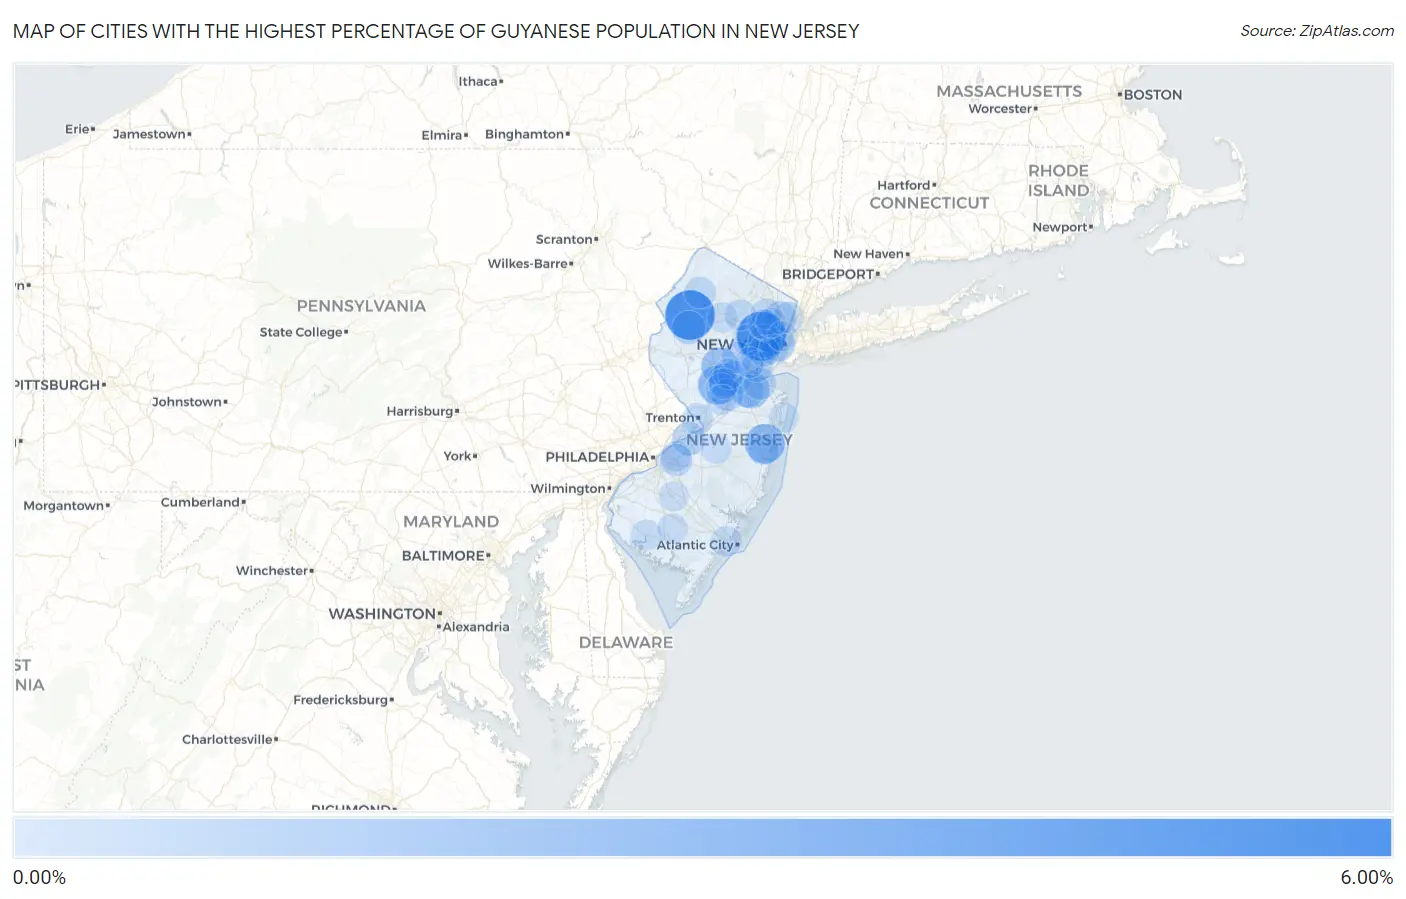
Map of Cities with the Highest Percentage of Guyanese Population in New Jersey
0.00%
6.00%
Cities with the Highest Percentage of Guyanese Population in New Jersey
| City | Guyanese | vs State | vs National | |
| 1. | Panther Valley | 5.37% | 0.27%(+5.10)#1 | 0.078%(+5.29)#10 |
| 2. | East Orange | 5.24% | 0.27%(+4.97)#2 | 0.078%(+5.16)#11 |
| 3. | Ampere North | 3.14% | 0.27%(+2.87)#3 | 0.078%(+3.06)#25 |
| 4. | Leisure Village | 2.63% | 0.27%(+2.36)#4 | 0.078%(+2.55)#36 |
| 5. | Griggstown | 2.45% | 0.27%(+2.18)#5 | 0.078%(+2.37)#40 |
| 6. | Finderne | 2.02% | 0.27%(+1.76)#6 | 0.078%(+1.95)#53 |
| 7. | Neptune City Borough | 1.93% | 0.27%(+1.66)#7 | 0.078%(+1.85)#56 |
| 8. | Brownville | 1.83% | 0.27%(+1.56)#8 | 0.078%(+1.75)#60 |
| 9. | South Bound Brook Borough | 1.69% | 0.27%(+1.43)#9 | 0.078%(+1.62)#68 |
| 10. | Jersey City | 1.40% | 0.27%(+1.13)#10 | 0.078%(+1.32)#90 |
| 11. | Moonachie Borough | 1.33% | 0.27%(+1.06)#11 | 0.078%(+1.25)#93 |
| 12. | Midland Park Borough | 1.32% | 0.27%(+1.06)#12 | 0.078%(+1.25)#94 |
| 13. | William Paterson University Of New Jersey | 1.27% | 0.27%(+0.999)#13 | 0.078%(+1.19)#99 |
| 14. | South Plainfield Borough | 1.08% | 0.27%(+0.807)#14 | 0.078%(+0.997)#110 |
| 15. | Six Mile Run | 1.05% | 0.27%(+0.778)#15 | 0.078%(+0.969)#114 |
| 16. | New Brunswick | 1.00% | 0.27%(+0.735)#16 | 0.078%(+0.925)#122 |
| 17. | Beattystown | 0.95% | 0.27%(+0.684)#17 | 0.078%(+0.874)#128 |
| 18. | Burlington | 0.95% | 0.27%(+0.678)#18 | 0.078%(+0.868)#130 |
| 19. | Oak Ridge | 0.89% | 0.27%(+0.623)#19 | 0.078%(+0.813)#137 |
| 20. | Roselle Borough | 0.87% | 0.27%(+0.603)#20 | 0.078%(+0.793)#142 |
| 21. | Linden | 0.84% | 0.27%(+0.576)#21 | 0.078%(+0.766)#147 |
| 22. | Old Bridge | 0.84% | 0.27%(+0.572)#22 | 0.078%(+0.762)#148 |
| 23. | Newark | 0.84% | 0.27%(+0.569)#23 | 0.078%(+0.759)#149 |
| 24. | Avon By The Sea Borough | 0.78% | 0.27%(+0.513)#24 | 0.078%(+0.703)#159 |
| 25. | Watsessing | 0.78% | 0.27%(+0.509)#25 | 0.078%(+0.699)#161 |
| 26. | Hackensack | 0.73% | 0.27%(+0.462)#26 | 0.078%(+0.652)#169 |
| 27. | Spring Lake Borough | 0.68% | 0.27%(+0.413)#27 | 0.078%(+0.603)#184 |
| 28. | Clementon Borough | 0.66% | 0.27%(+0.391)#28 | 0.078%(+0.581)#189 |
| 29. | Somerville Borough | 0.66% | 0.27%(+0.390)#29 | 0.078%(+0.580)#190 |
| 30. | Ramblewood | 0.63% | 0.27%(+0.365)#30 | 0.078%(+0.555)#198 |
| 31. | Haworth Borough | 0.63% | 0.27%(+0.360)#31 | 0.078%(+0.550)#199 |
| 32. | Wharton Borough | 0.62% | 0.27%(+0.355)#32 | 0.078%(+0.545)#202 |
| 33. | The College Of New Jersey | 0.60% | 0.27%(+0.337)#33 | 0.078%(+0.527)#207 |
| 34. | North Plainfield Borough | 0.60% | 0.27%(+0.335)#34 | 0.078%(+0.526)#209 |
| 35. | Bergenfield Borough | 0.58% | 0.27%(+0.316)#35 | 0.078%(+0.507)#213 |
| 36. | Dayton | 0.57% | 0.27%(+0.306)#36 | 0.078%(+0.496)#220 |
| 37. | Rutgers University-Busch Campus | 0.57% | 0.27%(+0.302)#37 | 0.078%(+0.492)#222 |
| 38. | New Milford Borough | 0.57% | 0.27%(+0.300)#38 | 0.078%(+0.490)#224 |
| 39. | Cliffwood Beach | 0.57% | 0.27%(+0.297)#39 | 0.078%(+0.487)#228 |
| 40. | Ramapo College Of New Jersey | 0.49% | 0.27%(+0.222)#40 | 0.078%(+0.412)#255 |
| 41. | Washington Borough | 0.48% | 0.27%(+0.215)#41 | 0.078%(+0.405)#257 |
| 42. | Plainfield | 0.48% | 0.27%(+0.212)#42 | 0.078%(+0.402)#261 |
| 43. | Paramus Borough | 0.47% | 0.27%(+0.206)#43 | 0.078%(+0.396)#265 |
| 44. | Newton | 0.47% | 0.27%(+0.198)#44 | 0.078%(+0.388)#270 |
| 45. | Port Reading | 0.45% | 0.27%(+0.177)#45 | 0.078%(+0.367)#281 |
| 46. | Millington | 0.44% | 0.27%(+0.174)#46 | 0.078%(+0.364)#283 |
| 47. | Woodbine Borough | 0.40% | 0.27%(+0.129)#47 | 0.078%(+0.319)#309 |
| 48. | Englewood | 0.38% | 0.27%(+0.117)#48 | 0.078%(+0.307)#322 |
| 49. | Westmont | 0.38% | 0.27%(+0.114)#49 | 0.078%(+0.304)#324 |
| 50. | Kendall Park | 0.35% | 0.27%(+0.080)#50 | 0.078%(+0.270)#344 |
| 51. | Trenton | 0.34% | 0.27%(+0.076)#51 | 0.078%(+0.266)#349 |
| 52. | Short Hills | 0.34% | 0.27%(+0.071)#52 | 0.078%(+0.261)#353 |
| 53. | Raritan Borough | 0.34% | 0.27%(+0.069)#53 | 0.078%(+0.259)#356 |
| 54. | Boonton | 0.33% | 0.27%(+0.062)#54 | 0.078%(+0.252)#361 |
| 55. | Elizabeth | 0.31% | 0.27%(+0.038)#55 | 0.078%(+0.228)#378 |
| 56. | Paterson | 0.29% | 0.27%(+0.019)#56 | 0.078%(+0.209)#399 |
| 57. | Palisades Park Borough | 0.28% | 0.27%(+0.014)#57 | 0.078%(+0.204)#406 |
| 58. | Somerset | 0.28% | 0.27%(+0.012)#58 | 0.078%(+0.202)#409 |
| 59. | Ringwood Borough | 0.27% | 0.27%(-0.003)#59 | 0.078%(+0.187)#429 |
| 60. | Bridgeton | 0.26% | 0.27%(-0.004)#60 | 0.078%(+0.186)#431 |
| 61. | Dunellen Borough | 0.26% | 0.27%(-0.005)#61 | 0.078%(+0.185)#434 |
| 62. | Pleasantville | 0.26% | 0.27%(-0.006)#62 | 0.078%(+0.185)#435 |
| 63. | Moorestown Lenola | 0.24% | 0.27%(-0.032)#63 | 0.078%(+0.158)#470 |
| 64. | Lindenwold Borough | 0.23% | 0.27%(-0.034)#64 | 0.078%(+0.156)#472 |
| 65. | Matawan Borough | 0.21% | 0.27%(-0.059)#65 | 0.078%(+0.131)#501 |
| 66. | Carteret Borough | 0.19% | 0.27%(-0.073)#66 | 0.078%(+0.117)#517 |
| 67. | Vineland | 0.19% | 0.27%(-0.074)#67 | 0.078%(+0.116)#518 |
| 68. | Glen Gardner Borough | 0.19% | 0.27%(-0.082)#68 | 0.078%(+0.108)#525 |
| 69. | Ramsey Borough | 0.18% | 0.27%(-0.085)#69 | 0.078%(+0.105)#532 |
| 70. | Toms River | 0.18% | 0.27%(-0.088)#70 | 0.078%(+0.102)#535 |
| 71. | Dover | 0.17% | 0.27%(-0.100)#71 | 0.078%(+0.090)#554 |
| 72. | Metuchen Borough | 0.17% | 0.27%(-0.101)#72 | 0.078%(+0.089)#556 |
| 73. | Colonia | 0.17% | 0.27%(-0.101)#73 | 0.078%(+0.089)#558 |
| 74. | Tenafly Borough | 0.16% | 0.27%(-0.105)#74 | 0.078%(+0.085)#562 |
| 75. | South River Borough | 0.16% | 0.27%(-0.107)#75 | 0.078%(+0.084)#569 |
| 76. | Lodi Borough | 0.16% | 0.27%(-0.110)#76 | 0.078%(+0.080)#578 |
| 77. | Westwood Borough | 0.15% | 0.27%(-0.117)#77 | 0.078%(+0.073)#595 |
| 78. | Sayreville Borough | 0.15% | 0.27%(-0.122)#78 | 0.078%(+0.068)#606 |
| 79. | Pompton Lakes Borough | 0.14% | 0.27%(-0.123)#79 | 0.078%(+0.067)#609 |
| 80. | Franklin Park | 0.14% | 0.27%(-0.127)#80 | 0.078%(+0.063)#613 |
| 81. | Fort Dix | 0.14% | 0.27%(-0.127)#81 | 0.078%(+0.063)#614 |
| 82. | Cliffside Park Borough | 0.14% | 0.27%(-0.127)#82 | 0.078%(+0.063)#616 |
| 83. | Princeton Meadows | 0.13% | 0.27%(-0.133)#83 | 0.078%(+0.057)#625 |
| 84. | Brookdale | 0.13% | 0.27%(-0.142)#84 | 0.078%(+0.048)#642 |
| 85. | Florham Park Borough | 0.13% | 0.27%(-0.143)#85 | 0.078%(+0.047)#643 |
| 86. | Roselle Park Borough | 0.12% | 0.27%(-0.146)#86 | 0.078%(+0.044)#651 |
| 87. | Maywood Borough | 0.12% | 0.27%(-0.149)#87 | 0.078%(+0.041)#661 |
| 88. | Bound Brook Borough | 0.12% | 0.27%(-0.151)#88 | 0.078%(+0.040)#670 |
| 89. | Fanwood Borough | 0.12% | 0.27%(-0.152)#89 | 0.078%(+0.038)#674 |
| 90. | Williamstown | 0.11% | 0.27%(-0.160)#90 | 0.078%(+0.030)#697 |
| 91. | Bayonne | 0.11% | 0.27%(-0.162)#91 | 0.078%(+0.028)#703 |
| 92. | Tinton Falls Borough | 0.089% | 0.27%(-0.180)#92 | 0.078%(+0.011)#756 |
| 93. | Spotswood Borough | 0.086% | 0.27%(-0.182)#93 | 0.078%(+0.008)#766 |
| 94. | Glen Rock Borough | 0.083% | 0.27%(-0.185)#94 | 0.078%(+0.005)#782 |
| 95. | Upper Montclair | 0.080% | 0.27%(-0.188)#95 | 0.078%(+0.002)#792 |
| 96. | North Haledon Borough | 0.080% | 0.27%(-0.189)#96 | 0.078%(+0.001)#798 |
| 97. | Union City | 0.073% | 0.27%(-0.195)#97 | 0.078%(-0.005)#826 |
| 98. | Asbury Park | 0.072% | 0.27%(-0.196)#98 | 0.078%(-0.006)#832 |
| 99. | Sicklerville | 0.070% | 0.27%(-0.198)#99 | 0.078%(-0.008)#843 |
| 100. | Passaic | 0.066% | 0.27%(-0.203)#100 | 0.078%(-0.012)#865 |
Common Questions
What are the Top 10 Cities with the Highest Percentage of Guyanese Population in New Jersey?
Top 10 Cities with the Highest Percentage of Guyanese Population in New Jersey are:
#1
5.37%
#2
5.24%
#3
2.63%
#4
2.45%
#5
2.02%
#6
1.83%
#7
1.40%
#8
1.05%
#9
1.00%
#10
0.95%
What city has the Highest Percentage of Guyanese Population in New Jersey?
Panther Valley has the Highest Percentage of Guyanese Population in New Jersey with 5.37%.
What is the Percentage of Guyanese Population in the State of New Jersey?
Percentage of Guyanese Population in New Jersey is 0.27%.
What is the Percentage of Guyanese Population in the United States?
Percentage of Guyanese Population in the United States is 0.078%.