Cities with the Most Immigrants from Hong Kong in New Jersey
RELATED REPORTS & OPTIONS
Hong Kong
New Jersey
Compare Cities
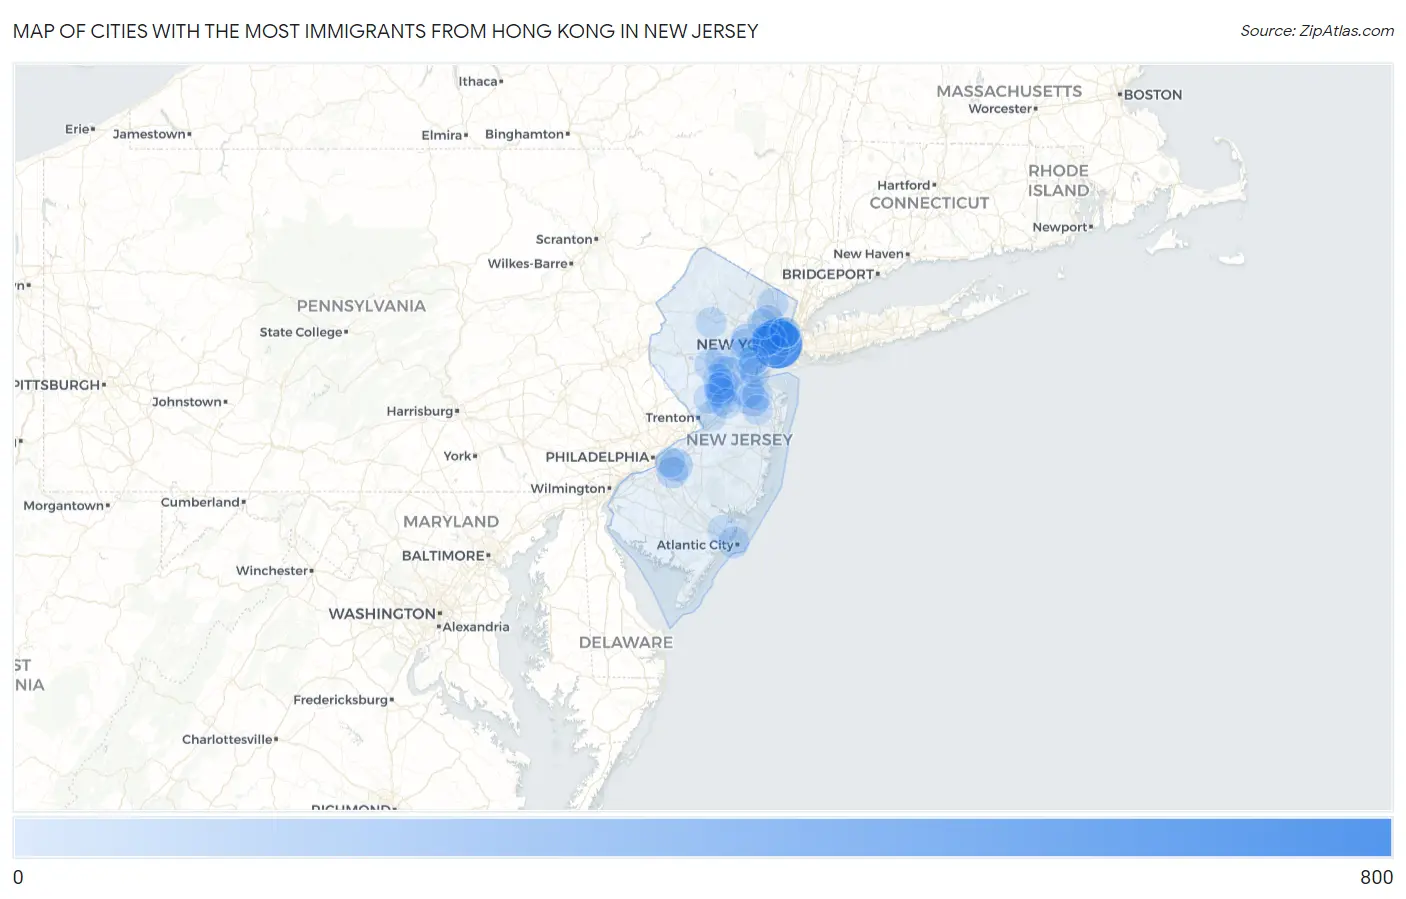
Map of Cities with the Most Immigrants from Hong Kong in New Jersey
0
800
Cities with the Most Immigrants from Hong Kong in New Jersey
| City | Hong Kong | vs State | vs National | |
| 1. | Jersey City | 666 | 11,161(5.97%)#1 | 239,302(0.28%)#53 |
| 2. | Fort Lee Borough | 223 | 11,161(2.00%)#2 | 239,302(0.09%)#136 |
| 3. | Ridgefield Borough | 158 | 11,161(1.42%)#3 | 239,302(0.07%)#193 |
| 4. | Leonia Borough | 156 | 11,161(1.40%)#4 | 239,302(0.07%)#195 |
| 5. | Hoboken | 146 | 11,161(1.31%)#5 | 239,302(0.06%)#205 |
| 6. | Chatham Borough | 133 | 11,161(1.19%)#6 | 239,302(0.06%)#224 |
| 7. | Greentree | 116 | 11,161(1.04%)#7 | 239,302(0.05%)#259 |
| 8. | Parsippany | 115 | 11,161(1.03%)#8 | 239,302(0.05%)#263 |
| 9. | Short Hills | 113 | 11,161(1.01%)#9 | 239,302(0.05%)#268 |
| 10. | Somerset | 112 | 11,161(1.00%)#10 | 239,302(0.05%)#270 |
| 11. | Secaucus | 111 | 11,161(0.99%)#11 | 239,302(0.05%)#273 |
| 12. | Tenafly Borough | 109 | 11,161(0.98%)#12 | 239,302(0.05%)#276 |
| 13. | Robertsville | 105 | 11,161(0.94%)#13 | 239,302(0.04%)#282 |
| 14. | Old Bridge | 102 | 11,161(0.91%)#14 | 239,302(0.04%)#291 |
| 15. | Harrison | 97 | 11,161(0.87%)#15 | 239,302(0.04%)#305 |
| 16. | Robbinsville Center | 90 | 11,161(0.81%)#16 | 239,302(0.04%)#328 |
| 17. | Clifton | 79 | 11,161(0.71%)#17 | 239,302(0.03%)#374 |
| 18. | Fair Lawn Borough | 79 | 11,161(0.71%)#18 | 239,302(0.03%)#375 |
| 19. | Kendall Park | 69 | 11,161(0.62%)#19 | 239,302(0.03%)#426 |
| 20. | Towaco | 67 | 11,161(0.60%)#20 | 239,302(0.03%)#436 |
| 21. | Echelon | 66 | 11,161(0.59%)#21 | 239,302(0.03%)#442 |
| 22. | Atlantic City | 61 | 11,161(0.55%)#22 | 239,302(0.03%)#483 |
| 23. | Paramus Borough | 60 | 11,161(0.54%)#23 | 239,302(0.03%)#492 |
| 24. | Ridgewood | 59 | 11,161(0.53%)#24 | 239,302(0.02%)#498 |
| 25. | Bradley Gardens | 55 | 11,161(0.49%)#25 | 239,302(0.02%)#522 |
| 26. | Fanwood Borough | 49 | 11,161(0.44%)#26 | 239,302(0.02%)#571 |
| 27. | Sicklerville | 48 | 11,161(0.43%)#27 | 239,302(0.02%)#576 |
| 28. | Morganville | 47 | 11,161(0.42%)#28 | 239,302(0.02%)#596 |
| 29. | Princeton Meadows | 46 | 11,161(0.41%)#29 | 239,302(0.02%)#604 |
| 30. | Edgewater Borough | 46 | 11,161(0.41%)#30 | 239,302(0.02%)#606 |
| 31. | Carlstadt Borough | 45 | 11,161(0.40%)#31 | 239,302(0.02%)#623 |
| 32. | Succasunna | 44 | 11,161(0.39%)#32 | 239,302(0.02%)#631 |
| 33. | Sayreville Borough | 40 | 11,161(0.36%)#33 | 239,302(0.02%)#661 |
| 34. | Rockaway Borough | 40 | 11,161(0.36%)#34 | 239,302(0.02%)#671 |
| 35. | Westfield | 38 | 11,161(0.34%)#35 | 239,302(0.02%)#692 |
| 36. | Palisades Park Borough | 38 | 11,161(0.34%)#36 | 239,302(0.02%)#695 |
| 37. | Tinton Falls Borough | 38 | 11,161(0.34%)#37 | 239,302(0.02%)#696 |
| 38. | Dumont Borough | 37 | 11,161(0.33%)#38 | 239,302(0.02%)#710 |
| 39. | Highland Park Borough | 37 | 11,161(0.33%)#39 | 239,302(0.02%)#712 |
| 40. | Franklin Center | 37 | 11,161(0.33%)#40 | 239,302(0.02%)#717 |
| 41. | Union City | 36 | 11,161(0.32%)#41 | 239,302(0.02%)#724 |
| 42. | Guttenberg | 36 | 11,161(0.32%)#42 | 239,302(0.02%)#734 |
| 43. | Lake Hiawatha | 35 | 11,161(0.31%)#43 | 239,302(0.01%)#751 |
| 44. | Cliffside Park Borough | 34 | 11,161(0.30%)#44 | 239,302(0.01%)#761 |
| 45. | Martinsville | 34 | 11,161(0.30%)#45 | 239,302(0.01%)#765 |
| 46. | Monmouth Junction | 34 | 11,161(0.30%)#46 | 239,302(0.01%)#767 |
| 47. | Wharton Borough | 34 | 11,161(0.30%)#47 | 239,302(0.01%)#768 |
| 48. | Hasbrouck Heights Borough | 33 | 11,161(0.30%)#48 | 239,302(0.01%)#784 |
| 49. | Madison Borough | 32 | 11,161(0.29%)#49 | 239,302(0.01%)#795 |
| 50. | Hopatcong Borough | 32 | 11,161(0.29%)#50 | 239,302(0.01%)#796 |
| 51. | Rutherford Borough | 31 | 11,161(0.28%)#51 | 239,302(0.01%)#813 |
| 52. | Metuchen Borough | 31 | 11,161(0.28%)#52 | 239,302(0.01%)#814 |
| 53. | Franklin Park | 31 | 11,161(0.28%)#53 | 239,302(0.01%)#818 |
| 54. | Hamilton Square | 31 | 11,161(0.28%)#54 | 239,302(0.01%)#819 |
| 55. | Monroe Manor | 31 | 11,161(0.28%)#55 | 239,302(0.01%)#823 |
| 56. | Kearny | 29 | 11,161(0.26%)#56 | 239,302(0.01%)#851 |
| 57. | Colonia | 29 | 11,161(0.26%)#57 | 239,302(0.01%)#858 |
| 58. | Summit | 28 | 11,161(0.25%)#58 | 239,302(0.01%)#872 |
| 59. | Woodbridge | 28 | 11,161(0.25%)#59 | 239,302(0.01%)#873 |
| 60. | Closter Borough | 27 | 11,161(0.24%)#60 | 239,302(0.01%)#897 |
| 61. | Bayonne | 26 | 11,161(0.23%)#61 | 239,302(0.01%)#914 |
| 62. | Hillsborough | 26 | 11,161(0.23%)#62 | 239,302(0.01%)#924 |
| 63. | Buena Borough | 26 | 11,161(0.23%)#63 | 239,302(0.01%)#933 |
| 64. | Newark | 25 | 11,161(0.22%)#64 | 239,302(0.01%)#937 |
| 65. | Heathcote | 25 | 11,161(0.22%)#65 | 239,302(0.01%)#955 |
| 66. | Blackwells Mills | 24 | 11,161(0.22%)#66 | 239,302(0.01%)#971 |
| 67. | Ellisburg | 24 | 11,161(0.22%)#67 | 239,302(0.01%)#974 |
| 68. | West New York | 23 | 11,161(0.21%)#68 | 239,302(0.01%)#987 |
| 69. | Bergenfield Borough | 23 | 11,161(0.21%)#69 | 239,302(0.01%)#994 |
| 70. | Hillsdale Borough | 23 | 11,161(0.21%)#70 | 239,302(0.01%)#999 |
| 71. | East Freehold | 23 | 11,161(0.21%)#71 | 239,302(0.01%)#1,003 |
| 72. | Perth Amboy | 22 | 11,161(0.20%)#72 | 239,302(0.01%)#1,016 |
| 73. | Englewood Cliffs Borough | 22 | 11,161(0.20%)#73 | 239,302(0.01%)#1,038 |
| 74. | Glassboro Borough | 21 | 11,161(0.19%)#74 | 239,302(0.01%)#1,052 |
| 75. | Eatontown Borough | 21 | 11,161(0.19%)#75 | 239,302(0.01%)#1,056 |
| 76. | Somerville Borough | 21 | 11,161(0.19%)#76 | 239,302(0.01%)#1,058 |
| 77. | Cresskill Borough | 21 | 11,161(0.19%)#77 | 239,302(0.01%)#1,060 |
| 78. | Troy Hills | 21 | 11,161(0.19%)#78 | 239,302(0.01%)#1,065 |
| 79. | Manville Borough | 20 | 11,161(0.18%)#79 | 239,302(0.01%)#1,083 |
| 80. | Rahway | 19 | 11,161(0.17%)#80 | 239,302(0.01%)#1,105 |
| 81. | Lodi Borough | 19 | 11,161(0.17%)#81 | 239,302(0.01%)#1,108 |
| 82. | Elmwood Park Borough | 19 | 11,161(0.17%)#82 | 239,302(0.01%)#1,113 |
| 83. | Upper Montclair | 19 | 11,161(0.17%)#83 | 239,302(0.01%)#1,117 |
| 84. | Lincoln Park Borough | 19 | 11,161(0.17%)#84 | 239,302(0.01%)#1,119 |
| 85. | Mountain Lakes Borough | 19 | 11,161(0.17%)#85 | 239,302(0.01%)#1,127 |
| 86. | Princeton | 18 | 11,161(0.16%)#86 | 239,302(0.01%)#1,141 |
| 87. | South River Borough | 17 | 11,161(0.15%)#87 | 239,302(0.01%)#1,183 |
| 88. | Pomona | 17 | 11,161(0.15%)#88 | 239,302(0.01%)#1,198 |
| 89. | Menlo Park Terrace | 17 | 11,161(0.15%)#89 | 239,302(0.01%)#1,207 |
| 90. | Cranbury | 17 | 11,161(0.15%)#90 | 239,302(0.01%)#1,208 |
| 91. | Englishtown Borough | 17 | 11,161(0.15%)#91 | 239,302(0.01%)#1,209 |
| 92. | Oradell Borough | 16 | 11,161(0.14%)#92 | 239,302(0.01%)#1,238 |
| 93. | Demarest Borough | 16 | 11,161(0.14%)#93 | 239,302(0.01%)#1,241 |
| 94. | Spring Lake Heights Borough | 16 | 11,161(0.14%)#94 | 239,302(0.01%)#1,242 |
| 95. | Cedar Knolls | 16 | 11,161(0.14%)#95 | 239,302(0.01%)#1,243 |
| 96. | Ten Mile Run | 16 | 11,161(0.14%)#96 | 239,302(0.01%)#1,250 |
| 97. | New Milford Borough | 15 | 11,161(0.13%)#97 | 239,302(0.01%)#1,275 |
| 98. | Maywood Borough | 15 | 11,161(0.13%)#98 | 239,302(0.01%)#1,284 |
| 99. | Whippany | 15 | 11,161(0.13%)#99 | 239,302(0.01%)#1,287 |
| 100. | Allendale Borough | 15 | 11,161(0.13%)#100 | 239,302(0.01%)#1,288 |
Common Questions
What are the Top 10 Cities with the Most Immigrants from Hong Kong in New Jersey?
Top 10 Cities with the Most Immigrants from Hong Kong in New Jersey are:
#1
666
#2
146
#3
116
#4
113
#5
112
#6
111
#7
105
#8
102
#9
97
#10
79
What city has the Most Immigrants from Hong Kong in New Jersey?
Jersey City has the Most Immigrants from Hong Kong in New Jersey with 666.
What is the Total Immigrants from Hong Kong in the State of New Jersey?
Total Immigrants from Hong Kong in New Jersey is 11,161.
What is the Total Immigrants from Hong Kong in the United States?
Total Immigrants from Hong Kong in the United States is 239,302.