East Freehold, NJ Map & Demographics
East Freehold Map
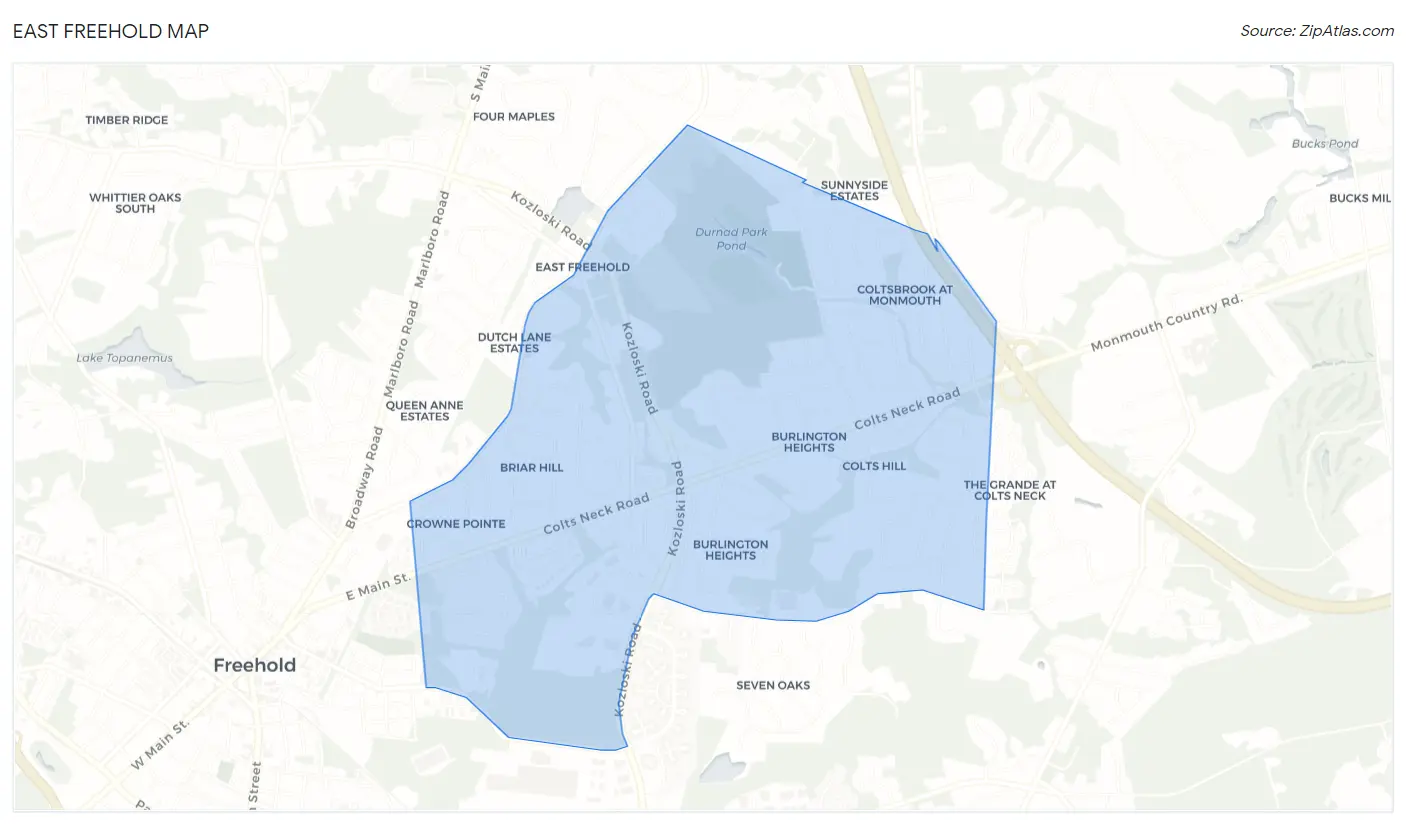
East Freehold Overview
$61,385
PER CAPITA INCOME
$191,957
AVG FAMILY INCOME
$184,579
AVG HOUSEHOLD INCOME
14.5%
WAGE / INCOME GAP [ % ]
85.5¢/ $1
WAGE / INCOME GAP [ $ ]
0.34
INEQUALITY / GINI INDEX
5,150
TOTAL POPULATION
2,796
MALE POPULATION
2,354
FEMALE POPULATION
118.78
MALES / 100 FEMALES
84.19
FEMALES / 100 MALES
43.4
MEDIAN AGE
3.4
AVG FAMILY SIZE
3.1
AVG HOUSEHOLD SIZE
3,097
LABOR FORCE [ PEOPLE ]
76.1%
PERCENT IN LABOR FORCE
6.0%
UNEMPLOYMENT RATE
Income in East Freehold
Income Overview in East Freehold
Per Capita Income in East Freehold is $61,385, while median incomes of families and households are $191,957 and $184,579 respectively.
| Characteristic | Number | Measure |
| Per Capita Income | 5,150 | $61,385 |
| Median Family Income | 1,374 | $191,957 |
| Mean Family Income | 1,374 | $198,197 |
| Median Household Income | 1,633 | $184,579 |
| Mean Household Income | 1,633 | $193,596 |
| Income Deficit | 1,374 | $0 |
| Wage / Income Gap (%) | 5,150 | 14.53% |
| Wage / Income Gap ($) | 5,150 | 85.47¢ per $1 |
| Gini / Inequality Index | 5,150 | 0.34 |
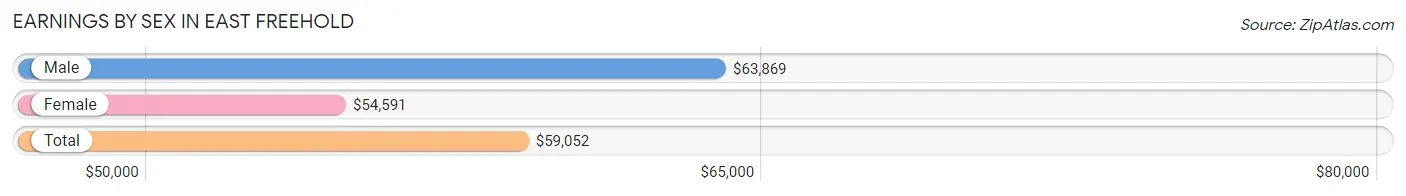
Earnings by Sex in East Freehold
Average Earnings in East Freehold are $59,052, $63,869 for men and $54,591 for women, a difference of 14.5%.
| Sex | Number | Average Earnings |
| Male | 1,863 (59.3%) | $63,869 |
| Female | 1,280 (40.7%) | $54,591 |
| Total | 3,143 (100.0%) | $59,052 |
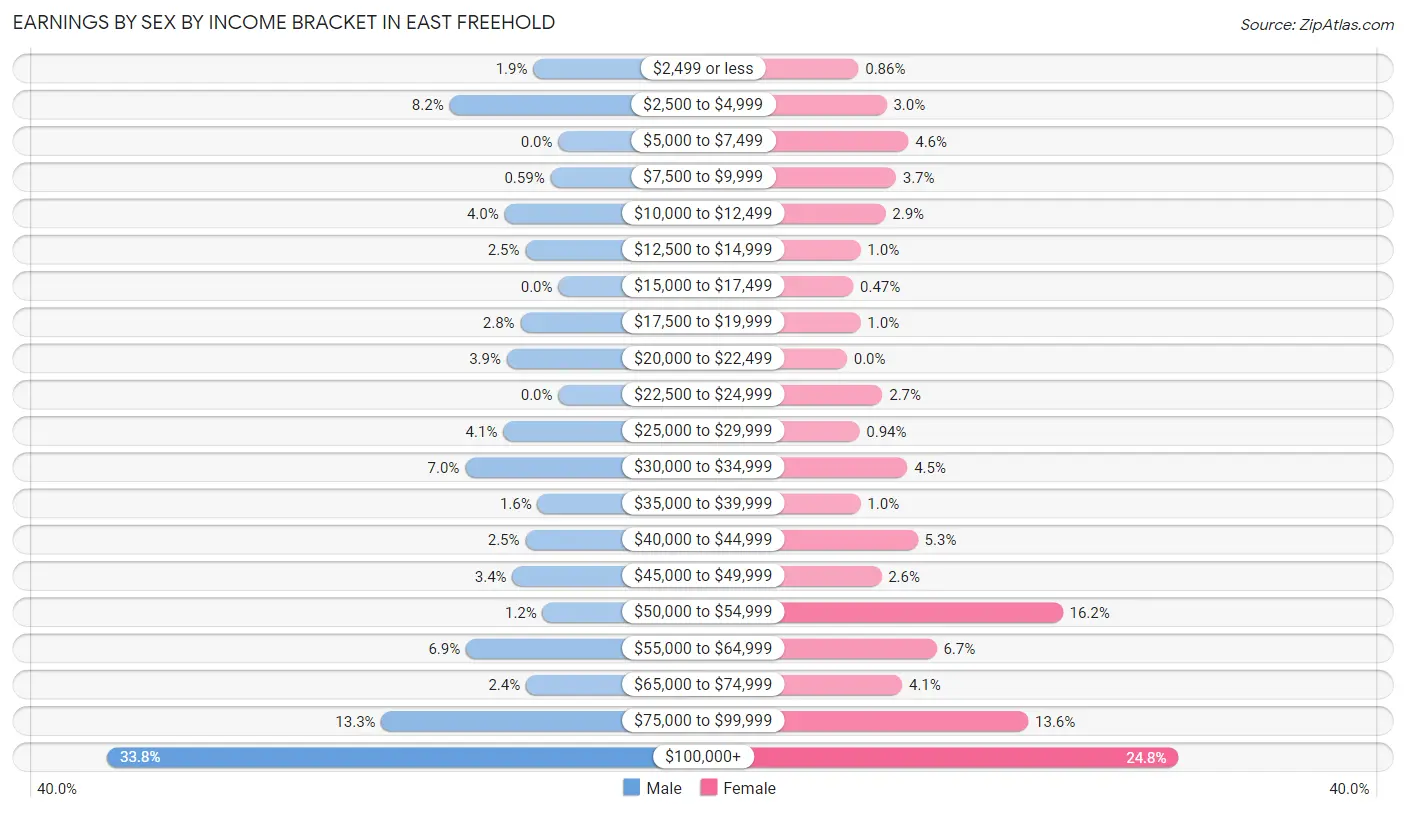
Earnings by Sex by Income Bracket in East Freehold
The most common earnings brackets in East Freehold are $100,000+ for men (630 | 33.8%) and $100,000+ for women (318 | 24.8%).
| Income | Male | Female |
| $2,499 or less | 35 (1.9%) | 11 (0.9%) |
| $2,500 to $4,999 | 152 (8.2%) | 38 (3.0%) |
| $5,000 to $7,499 | 0 (0.0%) | 59 (4.6%) |
| $7,500 to $9,999 | 11 (0.6%) | 47 (3.7%) |
| $10,000 to $12,499 | 75 (4.0%) | 37 (2.9%) |
| $12,500 to $14,999 | 46 (2.5%) | 13 (1.0%) |
| $15,000 to $17,499 | 0 (0.0%) | 6 (0.5%) |
| $17,500 to $19,999 | 53 (2.8%) | 13 (1.0%) |
| $20,000 to $22,499 | 72 (3.9%) | 0 (0.0%) |
| $22,500 to $24,999 | 0 (0.0%) | 34 (2.7%) |
| $25,000 to $29,999 | 77 (4.1%) | 12 (0.9%) |
| $30,000 to $34,999 | 130 (7.0%) | 58 (4.5%) |
| $35,000 to $39,999 | 29 (1.6%) | 13 (1.0%) |
| $40,000 to $44,999 | 46 (2.5%) | 68 (5.3%) |
| $45,000 to $49,999 | 64 (3.4%) | 33 (2.6%) |
| $50,000 to $54,999 | 22 (1.2%) | 207 (16.2%) |
| $55,000 to $64,999 | 129 (6.9%) | 86 (6.7%) |
| $65,000 to $74,999 | 45 (2.4%) | 53 (4.1%) |
| $75,000 to $99,999 | 247 (13.3%) | 174 (13.6%) |
| $100,000+ | 630 (33.8%) | 318 (24.8%) |
| Total | 1,863 (100.0%) | 1,280 (100.0%) |
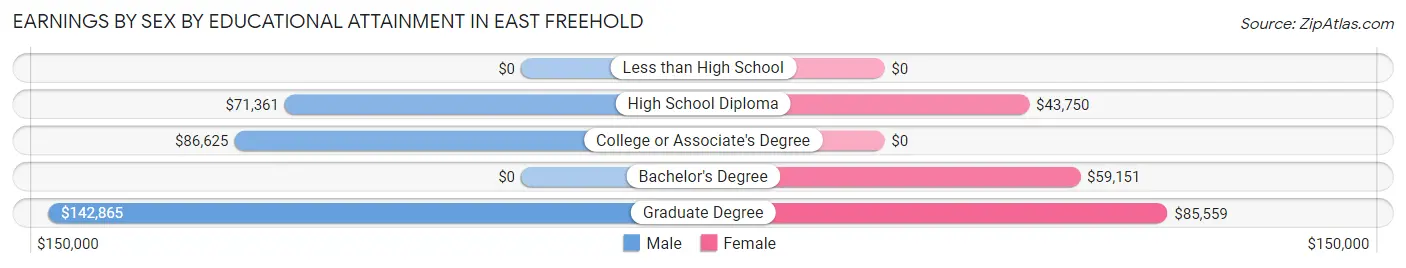
Earnings by Sex by Educational Attainment in East Freehold
Average earnings in East Freehold are $92,981 for men and $58,328 for women, a difference of 37.3%. Men with an educational attainment of graduate degree enjoy the highest average annual earnings of $142,865, while those with high school diploma education earn the least with $71,361. Women with an educational attainment of graduate degree earn the most with the average annual earnings of $85,559, while those with high school diploma education have the smallest earnings of $43,750.
| Educational Attainment | Male Income | Female Income |
| Less than High School | - | - |
| High School Diploma | $71,361 | $43,750 |
| College or Associate's Degree | $86,625 | $0 |
| Bachelor's Degree | - | - |
| Graduate Degree | $142,865 | $85,559 |
| Total | $92,981 | $58,328 |
Family Income in East Freehold
Family Income Brackets in East Freehold
According to the East Freehold family income data, there are 682 families falling into the $200,000+ income range, which is the most common income bracket and makes up 49.6% of all families.
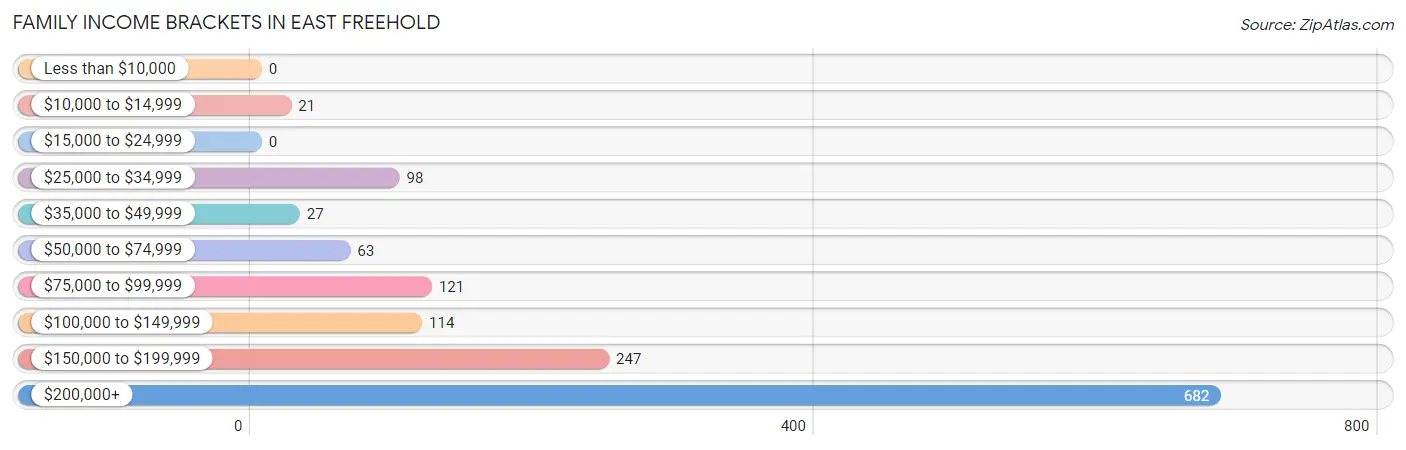
| Income Bracket | # Families | % Families |
| Less than $10,000 | 0 | 0.0% |
| $10,000 to $14,999 | 21 | 1.5% |
| $15,000 to $24,999 | 0 | 0.0% |
| $25,000 to $34,999 | 98 | 7.1% |
| $35,000 to $49,999 | 27 | 2.0% |
| $50,000 to $74,999 | 63 | 4.6% |
| $75,000 to $99,999 | 121 | 8.8% |
| $100,000 to $149,999 | 114 | 8.3% |
| $150,000 to $199,999 | 247 | 18.0% |
| $200,000+ | 682 | 49.6% |
Family Income by Famaliy Size in East Freehold
5-person families (245 | 17.8%) account for the highest median family income in East Freehold with $228,578 per family, while 2-person families (305 | 22.2%) have the highest median income of $82,875 per family member.
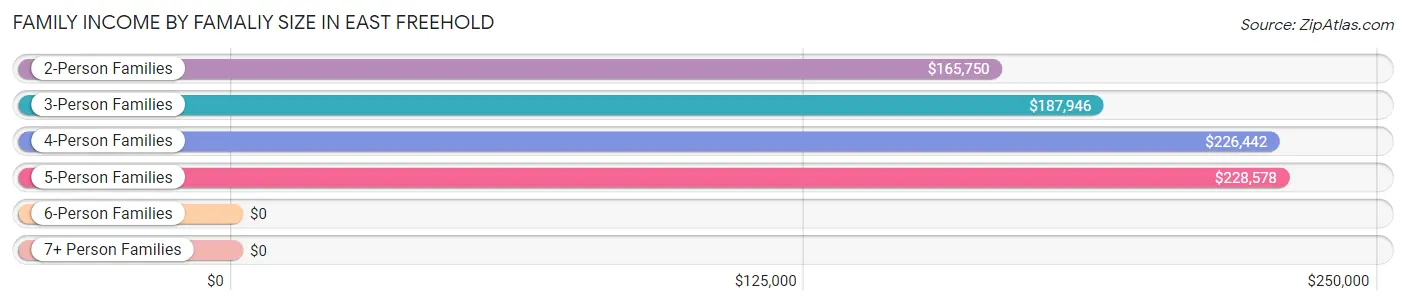
| Income Bracket | # Families | Median Income |
| 2-Person Families | 305 (22.2%) | $165,750 |
| 3-Person Families | 521 (37.9%) | $187,946 |
| 4-Person Families | 293 (21.3%) | $226,442 |
| 5-Person Families | 245 (17.8%) | $228,578 |
| 6-Person Families | 10 (0.7%) | $0 |
| 7+ Person Families | 0 (0.0%) | $0 |
| Total | 1,374 (100.0%) | $191,957 |
Family Income by Number of Earners in East Freehold
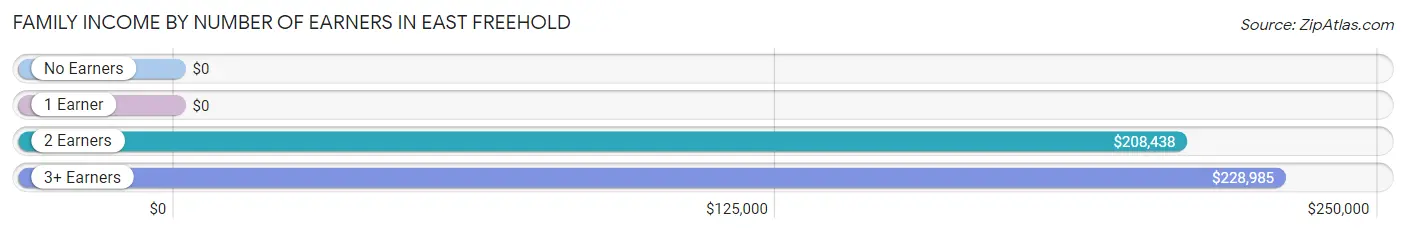
| Number of Earners | # Families | Median Income |
| No Earners | 116 (8.4%) | $0 |
| 1 Earner | 260 (18.9%) | $0 |
| 2 Earners | 607 (44.2%) | $208,438 |
| 3+ Earners | 391 (28.5%) | $228,985 |
| Total | 1,374 (100.0%) | $191,957 |
Household Income in East Freehold
Household Income Brackets in East Freehold
With 764 households falling in the category, the $200,000+ income range is the most frequent in East Freehold, accounting for 46.8% of all households.
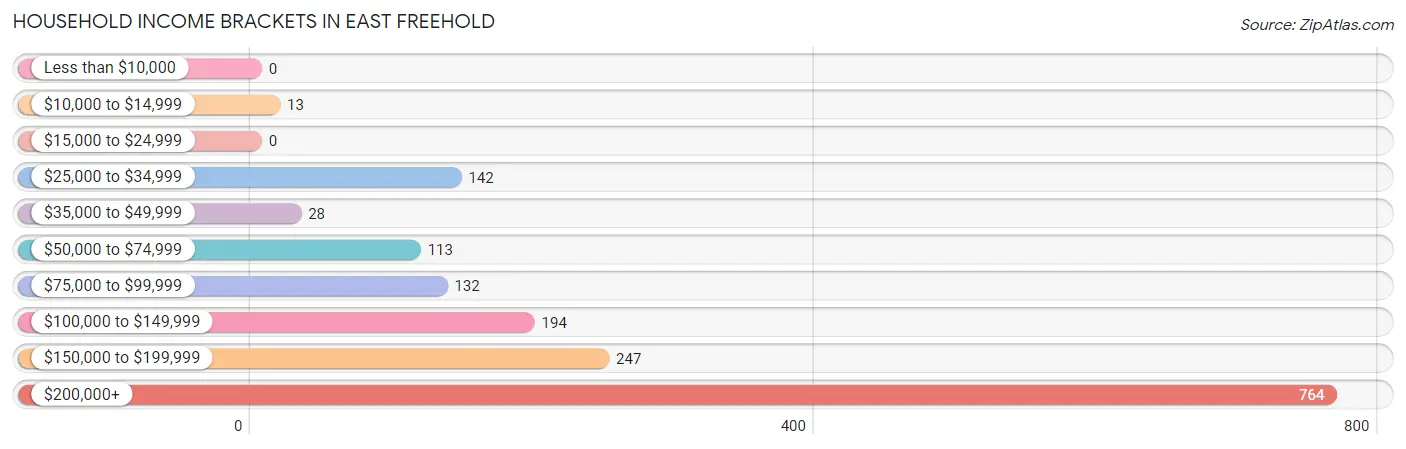
| Income Bracket | # Households | % Households |
| Less than $10,000 | 0 | 0.0% |
| $10,000 to $14,999 | 13 | 0.8% |
| $15,000 to $24,999 | 0 | 0.0% |
| $25,000 to $34,999 | 142 | 8.7% |
| $35,000 to $49,999 | 28 | 1.7% |
| $50,000 to $74,999 | 113 | 6.9% |
| $75,000 to $99,999 | 132 | 8.1% |
| $100,000 to $149,999 | 194 | 11.9% |
| $150,000 to $199,999 | 247 | 15.1% |
| $200,000+ | 764 | 46.8% |
Household Income by Householder Age in East Freehold
The median household income in East Freehold is $184,579, with the highest median household income of $204,559 found in the 45 to 64 years age bracket for the primary householder. A total of 1,016 households (62.2%) fall into this category.
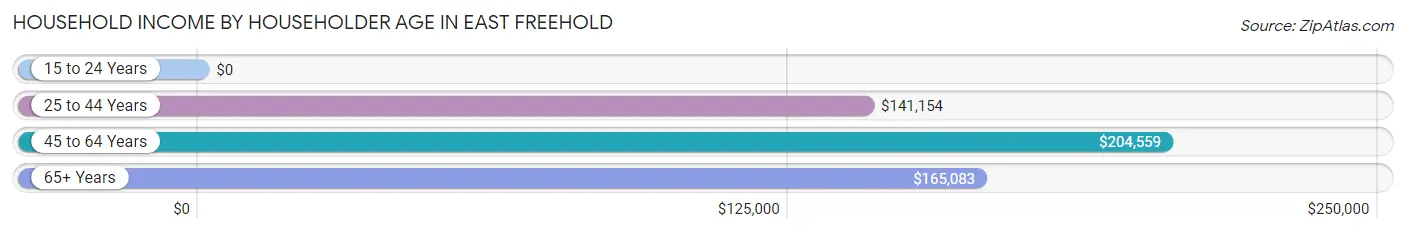
| Income Bracket | # Households | Median Income |
| 15 to 24 Years | 0 (0.0%) | $0 |
| 25 to 44 Years | 278 (17.0%) | $141,154 |
| 45 to 64 Years | 1,016 (62.2%) | $204,559 |
| 65+ Years | 339 (20.8%) | $165,083 |
| Total | 1,633 (100.0%) | $184,579 |
Poverty in East Freehold
Income Below Poverty by Sex and Age in East Freehold
With 10.8% poverty level for males and 8.3% for females among the residents of East Freehold, under 5 year old males and 5 year old females are the most vulnerable to poverty, with 188 males (58.6%) and 23 females (100.0%) in their respective age groups living below the poverty level.
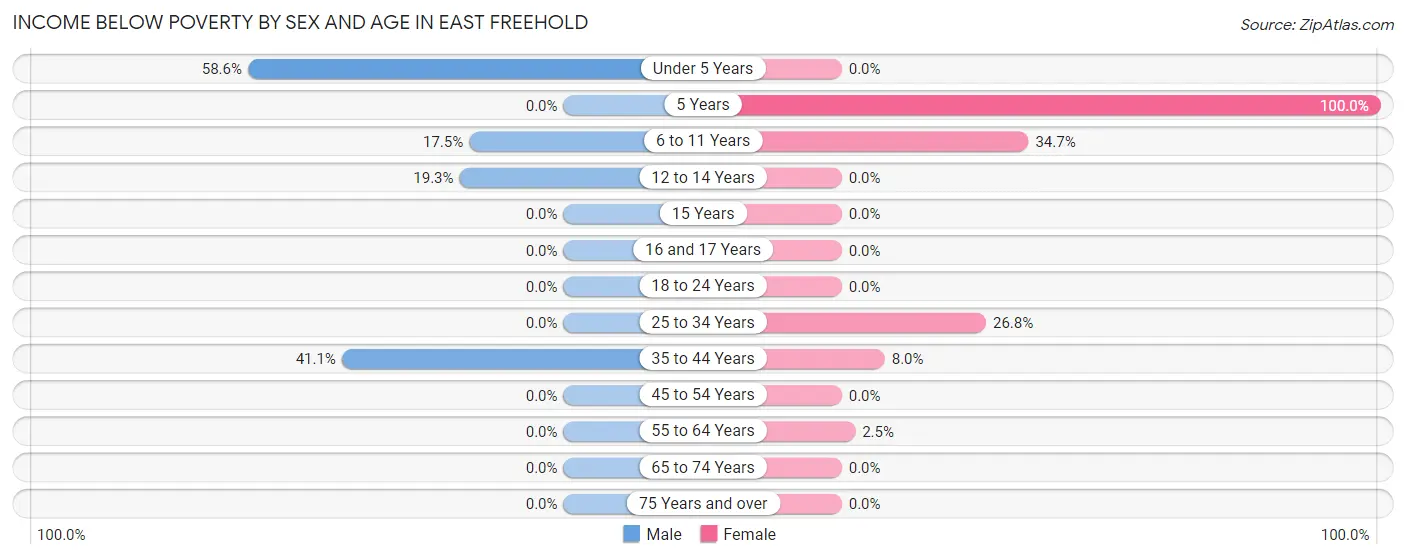
| Age Bracket | Male | Female |
| Under 5 Years | 188 (58.6%) | 0 (0.0%) |
| 5 Years | 0 (0.0%) | 23 (100.0%) |
| 6 to 11 Years | 21 (17.5%) | 70 (34.6%) |
| 12 to 14 Years | 22 (19.3%) | 0 (0.0%) |
| 15 Years | 0 (0.0%) | 0 (0.0%) |
| 16 and 17 Years | 0 (0.0%) | 0 (0.0%) |
| 18 to 24 Years | 0 (0.0%) | 0 (0.0%) |
| 25 to 34 Years | 0 (0.0%) | 68 (26.8%) |
| 35 to 44 Years | 72 (41.1%) | 21 (8.0%) |
| 45 to 54 Years | 0 (0.0%) | 0 (0.0%) |
| 55 to 64 Years | 0 (0.0%) | 13 (2.5%) |
| 65 to 74 Years | 0 (0.0%) | 0 (0.0%) |
| 75 Years and over | 0 (0.0%) | 0 (0.0%) |
| Total | 303 (10.8%) | 195 (8.3%) |
Income Above Poverty by Sex and Age in East Freehold
According to the poverty statistics in East Freehold, males aged 5 years and females aged under 5 years are the age groups that are most secure financially, with 100.0% of males and 100.0% of females in these age groups living above the poverty line.
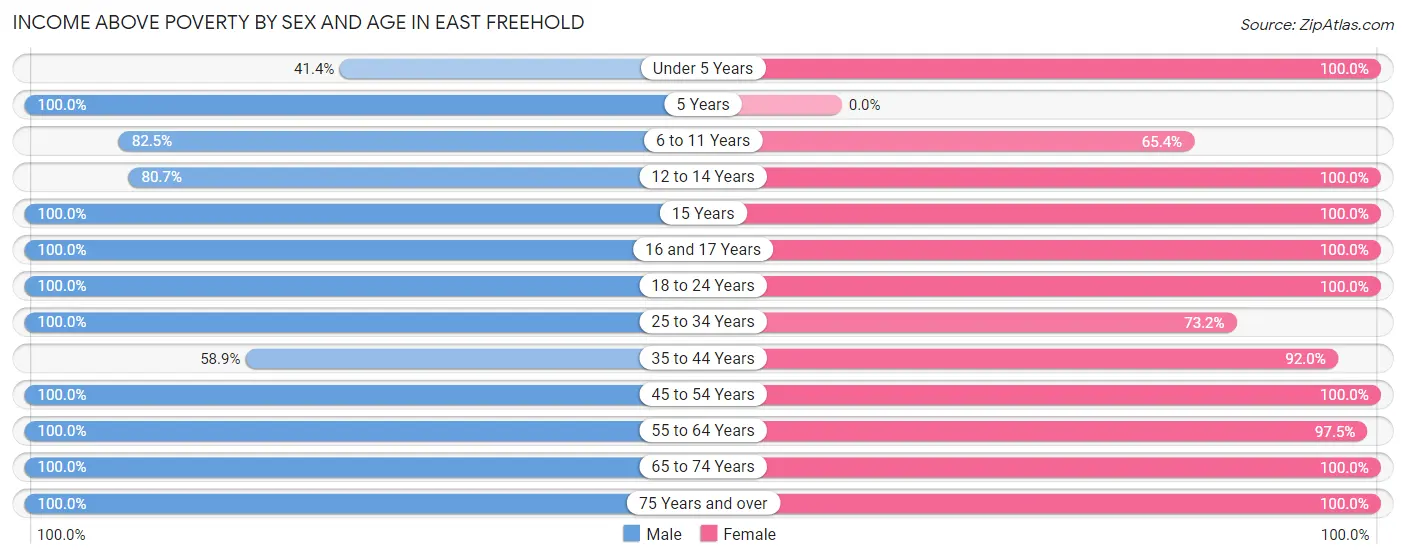
| Age Bracket | Male | Female |
| Under 5 Years | 133 (41.4%) | 66 (100.0%) |
| 5 Years | 11 (100.0%) | 0 (0.0%) |
| 6 to 11 Years | 99 (82.5%) | 132 (65.3%) |
| 12 to 14 Years | 92 (80.7%) | 102 (100.0%) |
| 15 Years | 26 (100.0%) | 95 (100.0%) |
| 16 and 17 Years | 103 (100.0%) | 56 (100.0%) |
| 18 to 24 Years | 445 (100.0%) | 80 (100.0%) |
| 25 to 34 Years | 258 (100.0%) | 186 (73.2%) |
| 35 to 44 Years | 103 (58.9%) | 242 (92.0%) |
| 45 to 54 Years | 561 (100.0%) | 313 (100.0%) |
| 55 to 64 Years | 474 (100.0%) | 510 (97.5%) |
| 65 to 74 Years | 106 (100.0%) | 232 (100.0%) |
| 75 Years and over | 82 (100.0%) | 145 (100.0%) |
| Total | 2,493 (89.2%) | 2,159 (91.7%) |
Income Below Poverty Among Married-Couple Families in East Freehold
The poverty statistics for married-couple families in East Freehold show that 5.8% or 72 of the total 1,240 families live below the poverty line. Families with 3 or 4 children have the highest poverty rate of 51.8%, comprising of 72 families. On the other hand, families with no children have the lowest poverty rate of 0.0%, which includes 0 families.
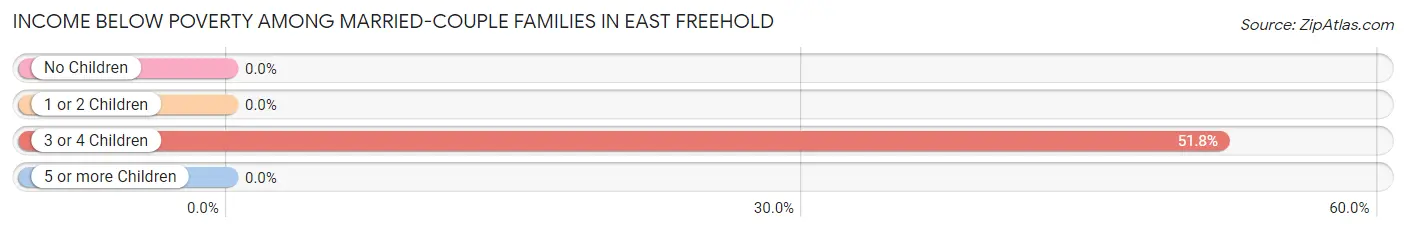
| Children | Above Poverty | Below Poverty |
| No Children | 599 (100.0%) | 0 (0.0%) |
| 1 or 2 Children | 502 (100.0%) | 0 (0.0%) |
| 3 or 4 Children | 67 (48.2%) | 72 (51.8%) |
| 5 or more Children | 0 (0.0%) | 0 (0.0%) |
| Total | 1,168 (94.2%) | 72 (5.8%) |
Income Below Poverty Among Single-Parent Households in East Freehold
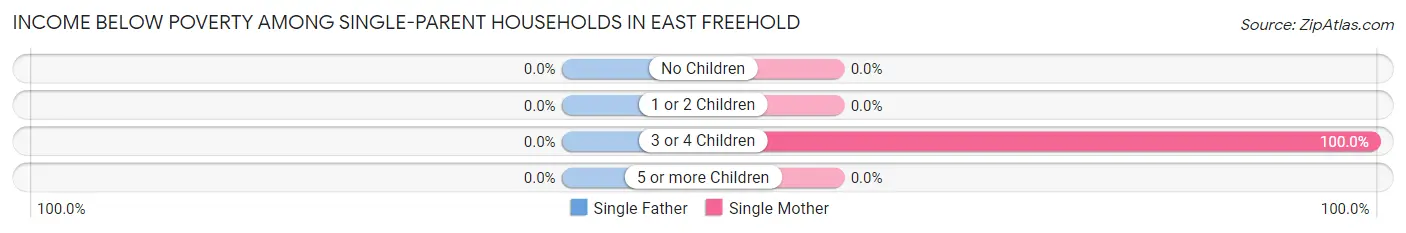
| Children | Single Father | Single Mother |
| No Children | 0 (0.0%) | 0 (0.0%) |
| 1 or 2 Children | 0 (0.0%) | 0 (0.0%) |
| 3 or 4 Children | 0 (0.0%) | 21 (100.0%) |
| 5 or more Children | 0 (0.0%) | 0 (0.0%) |
| Total | 0 (0.0%) | 21 (16.3%) |
Income Below Poverty Among Married-Couple vs Single-Parent Households in East Freehold
The poverty data for East Freehold shows that 72 of the married-couple family households (5.8%) and 21 of the single-parent households (15.7%) are living below the poverty level. Within the married-couple family households, those with 3 or 4 children have the highest poverty rate, with 72 households (51.8%) falling below the poverty line. Among the single-parent households, those with 3 or 4 children have the highest poverty rate, with 21 household (100.0%) living below poverty.
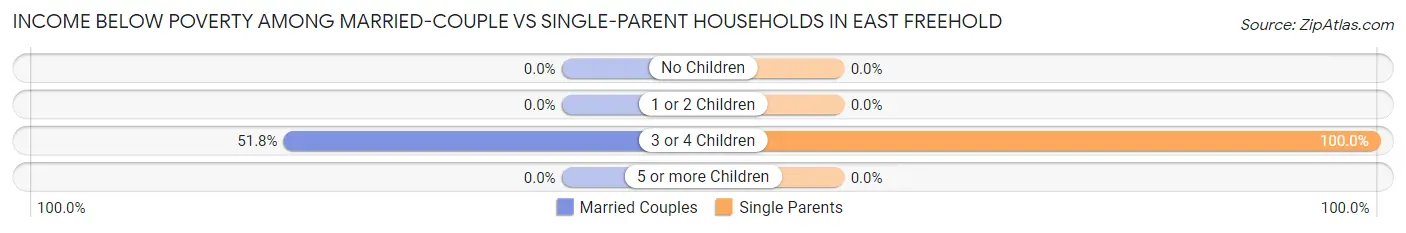
| Children | Married-Couple Families | Single-Parent Households |
| No Children | 0 (0.0%) | 0 (0.0%) |
| 1 or 2 Children | 0 (0.0%) | 0 (0.0%) |
| 3 or 4 Children | 72 (51.8%) | 21 (100.0%) |
| 5 or more Children | 0 (0.0%) | 0 (0.0%) |
| Total | 72 (5.8%) | 21 (15.7%) |
Race in East Freehold
The most populous races in East Freehold are White / Caucasian (4,620 | 89.7%), Hispanic or Latino (536 | 10.4%), and Asian (254 | 4.9%).
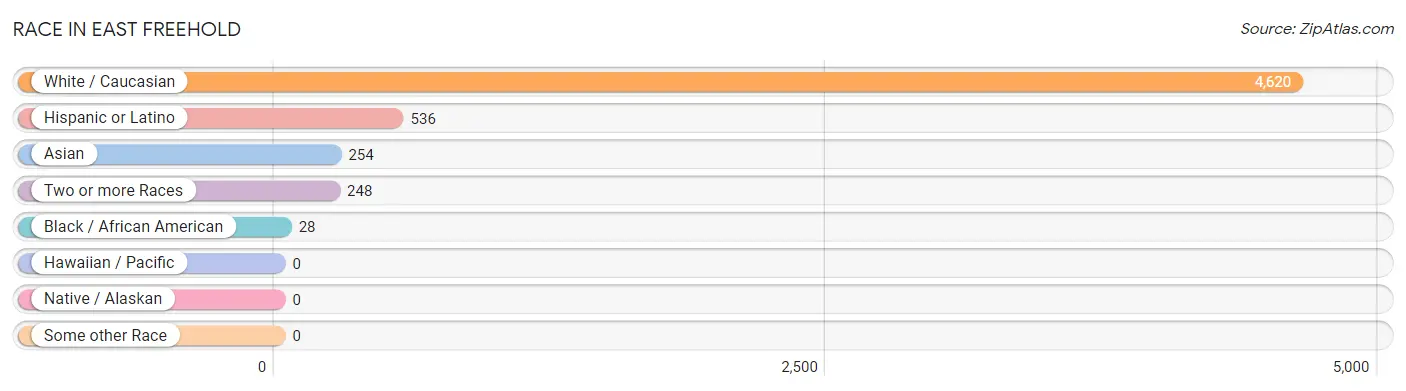
| Race | # Population | % Population |
| Asian | 254 | 4.9% |
| Black / African American | 28 | 0.5% |
| Hawaiian / Pacific | 0 | 0.0% |
| Hispanic or Latino | 536 | 10.4% |
| Native / Alaskan | 0 | 0.0% |
| White / Caucasian | 4,620 | 89.7% |
| Two or more Races | 248 | 4.8% |
| Some other Race | 0 | 0.0% |
| Total | 5,150 | 100.0% |
Ancestry in East Freehold
The most populous ancestries reported in East Freehold are Italian (1,582 | 30.7%), German (695 | 13.5%), Irish (620 | 12.0%), American (612 | 11.9%), and Dominican (404 | 7.8%), together accounting for 76.0% of all East Freehold residents.
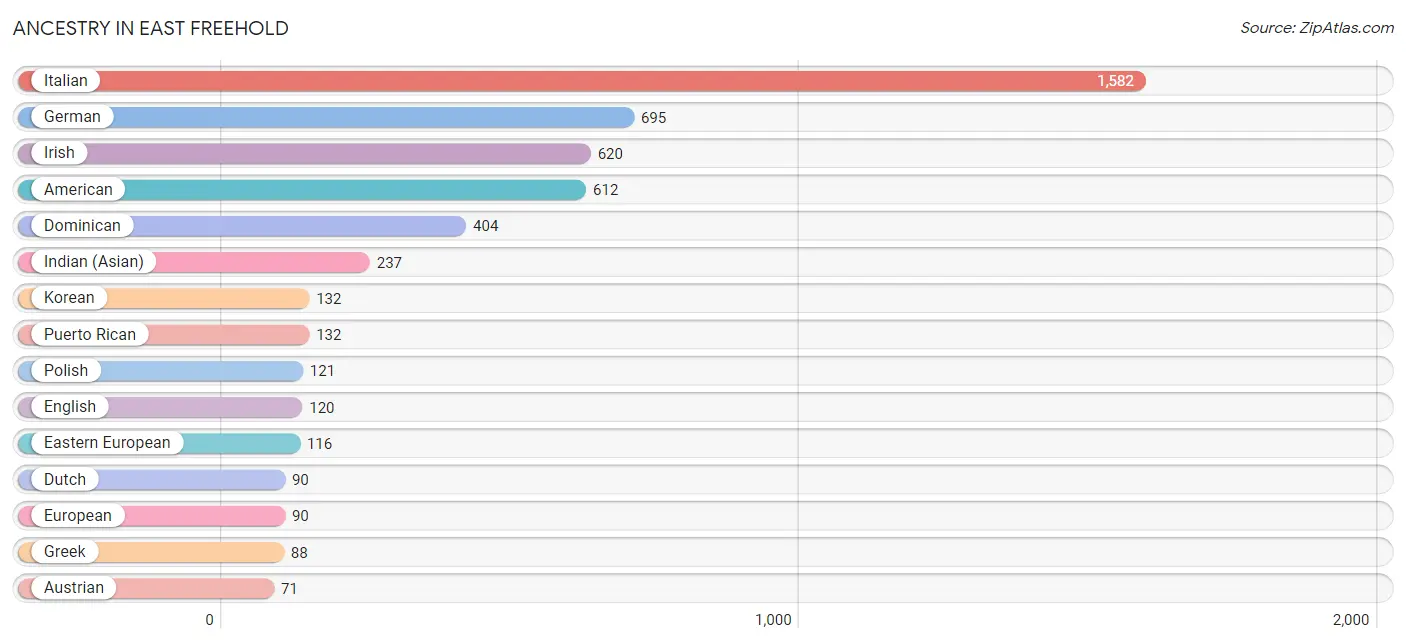
| Ancestry | # Population | % Population |
| African | 12 | 0.2% |
| American | 612 | 11.9% |
| Arab | 21 | 0.4% |
| Austrian | 71 | 1.4% |
| Blackfeet | 6 | 0.1% |
| British | 17 | 0.3% |
| Central American Indian | 37 | 0.7% |
| Delaware | 12 | 0.2% |
| Dominican | 404 | 7.8% |
| Dutch | 90 | 1.8% |
| Eastern European | 116 | 2.2% |
| English | 120 | 2.3% |
| European | 90 | 1.8% |
| French | 30 | 0.6% |
| French Canadian | 29 | 0.6% |
| German | 695 | 13.5% |
| Greek | 88 | 1.7% |
| Hungarian | 38 | 0.7% |
| Indian (Asian) | 237 | 4.6% |
| Irish | 620 | 12.0% |
| Israeli | 21 | 0.4% |
| Italian | 1,582 | 30.7% |
| Korean | 132 | 2.6% |
| Lebanese | 21 | 0.4% |
| Lithuanian | 12 | 0.2% |
| Northern European | 29 | 0.6% |
| Polish | 121 | 2.4% |
| Portuguese | 37 | 0.7% |
| Puerto Rican | 132 | 2.6% |
| Romanian | 13 | 0.3% |
| Russian | 30 | 0.6% |
| Slovak | 14 | 0.3% |
| Sri Lankan | 18 | 0.4% |
| Subsaharan African | 12 | 0.2% |
| Thai | 69 | 1.3% |
| Ukrainian | 45 | 0.9% |
| Welsh | 47 | 0.9% | View All 37 Rows |
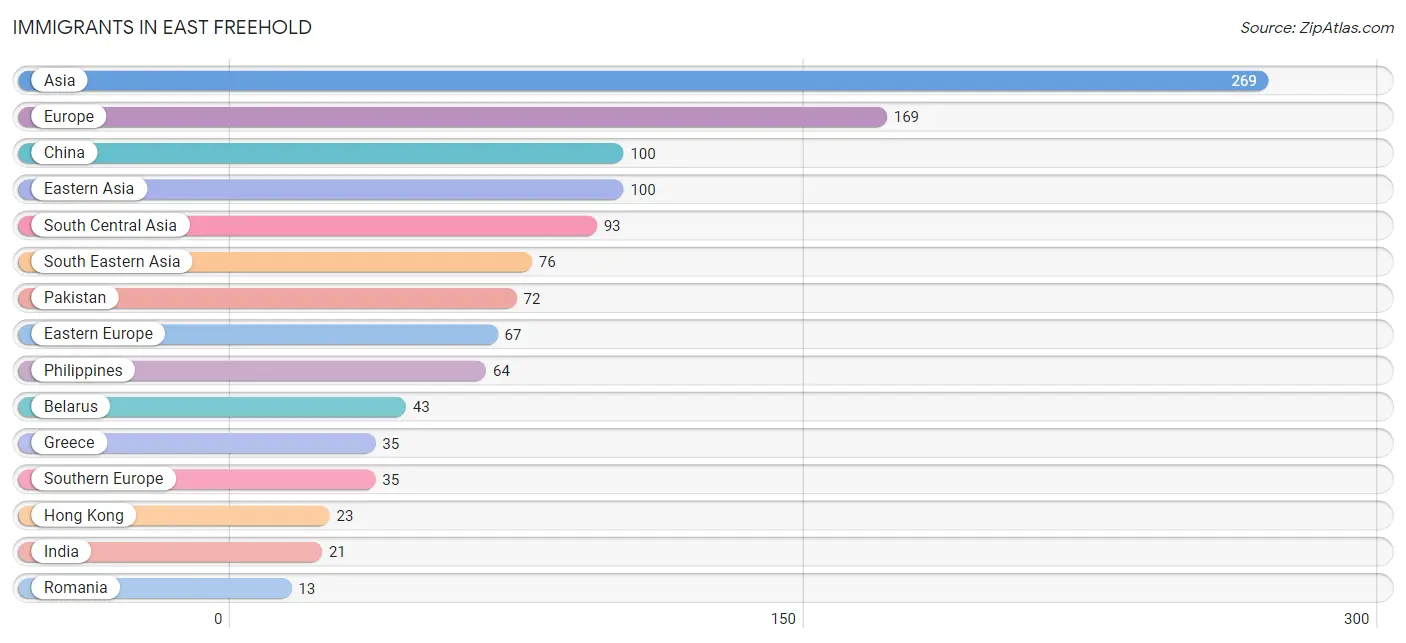
Immigrants in East Freehold
The most numerous immigrant groups reported in East Freehold came from Asia (269 | 5.2%), Europe (169 | 3.3%), China (100 | 1.9%), Eastern Asia (100 | 1.9%), and South Central Asia (93 | 1.8%), together accounting for 14.2% of all East Freehold residents.
| Immigration Origin | # Population | % Population |
| Africa | 8 | 0.2% |
| Asia | 269 | 5.2% |
| Belarus | 43 | 0.8% |
| China | 100 | 1.9% |
| Eastern Asia | 100 | 1.9% |
| Eastern Europe | 67 | 1.3% |
| Egypt | 8 | 0.2% |
| Europe | 169 | 3.3% |
| Greece | 35 | 0.7% |
| Hong Kong | 23 | 0.4% |
| India | 21 | 0.4% |
| Northern Africa | 8 | 0.2% |
| Pakistan | 72 | 1.4% |
| Philippines | 64 | 1.2% |
| Romania | 13 | 0.3% |
| South Central Asia | 93 | 1.8% |
| South Eastern Asia | 76 | 1.5% |
| Southern Europe | 35 | 0.7% |
| Ukraine | 11 | 0.2% |
| Vietnam | 12 | 0.2% | View All 20 Rows |
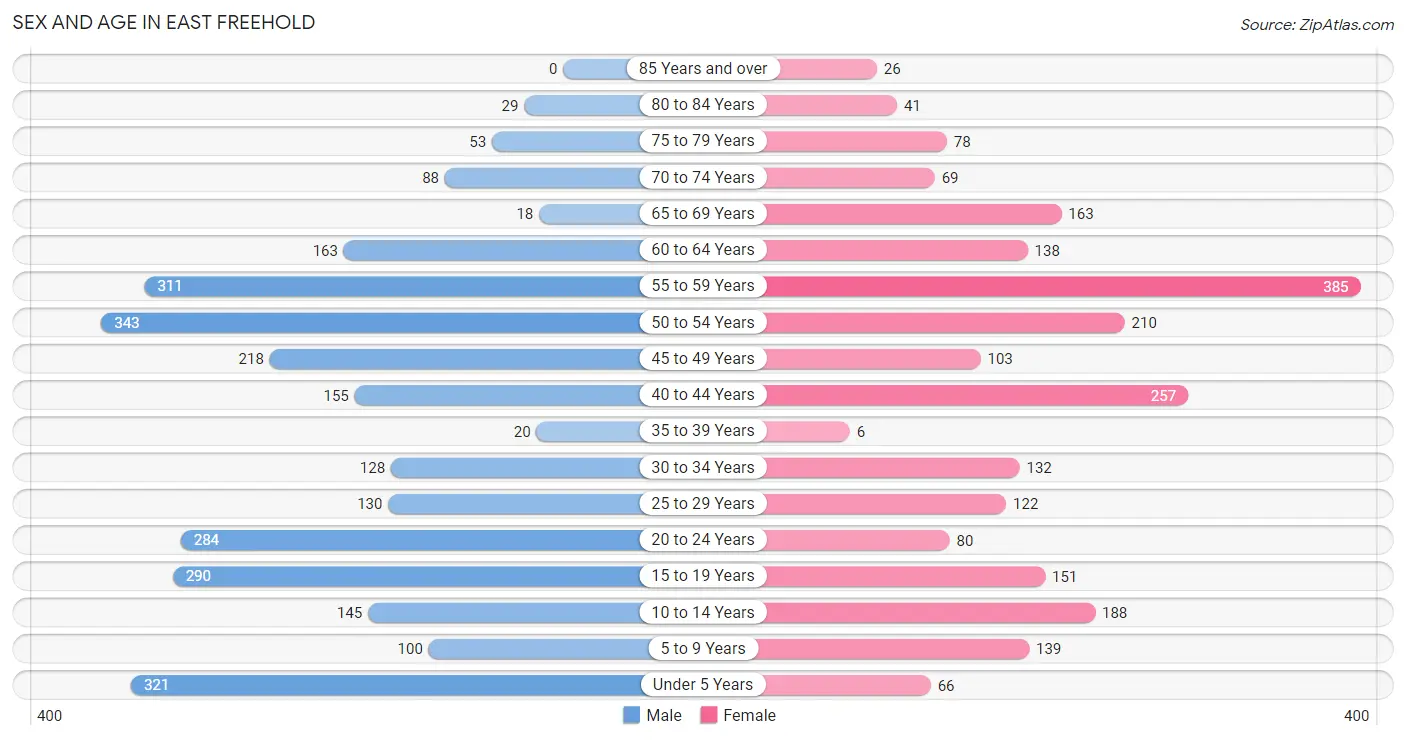
Sex and Age in East Freehold
Sex and Age in East Freehold
The most populous age groups in East Freehold are 50 to 54 Years (343 | 12.3%) for men and 55 to 59 Years (385 | 16.4%) for women.
| Age Bracket | Male | Female |
| Under 5 Years | 321 (11.5%) | 66 (2.8%) |
| 5 to 9 Years | 100 (3.6%) | 139 (5.9%) |
| 10 to 14 Years | 145 (5.2%) | 188 (8.0%) |
| 15 to 19 Years | 290 (10.4%) | 151 (6.4%) |
| 20 to 24 Years | 284 (10.2%) | 80 (3.4%) |
| 25 to 29 Years | 130 (4.6%) | 122 (5.2%) |
| 30 to 34 Years | 128 (4.6%) | 132 (5.6%) |
| 35 to 39 Years | 20 (0.7%) | 6 (0.3%) |
| 40 to 44 Years | 155 (5.5%) | 257 (10.9%) |
| 45 to 49 Years | 218 (7.8%) | 103 (4.4%) |
| 50 to 54 Years | 343 (12.3%) | 210 (8.9%) |
| 55 to 59 Years | 311 (11.1%) | 385 (16.4%) |
| 60 to 64 Years | 163 (5.8%) | 138 (5.9%) |
| 65 to 69 Years | 18 (0.6%) | 163 (6.9%) |
| 70 to 74 Years | 88 (3.2%) | 69 (2.9%) |
| 75 to 79 Years | 53 (1.9%) | 78 (3.3%) |
| 80 to 84 Years | 29 (1.0%) | 41 (1.7%) |
| 85 Years and over | 0 (0.0%) | 26 (1.1%) |
| Total | 2,796 (100.0%) | 2,354 (100.0%) |
Families and Households in East Freehold
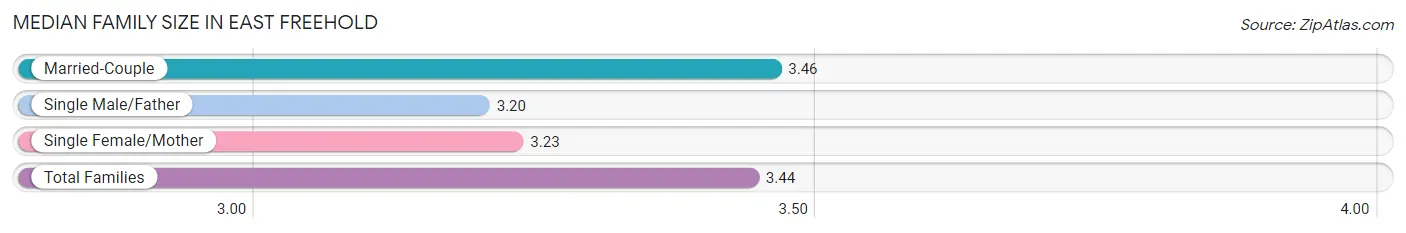
Median Family Size in East Freehold
The median family size in East Freehold is 3.44 persons per family, with married-couple families (1,240 | 90.2%) accounting for the largest median family size of 3.46 persons per family. On the other hand, single male/father families (5 | 0.4%) represent the smallest median family size with 3.20 persons per family.
| Family Type | # Families | Family Size |
| Married-Couple | 1,240 (90.2%) | 3.46 |
| Single Male/Father | 5 (0.4%) | 3.20 |
| Single Female/Mother | 129 (9.4%) | 3.23 |
| Total Families | 1,374 (100.0%) | 3.44 |
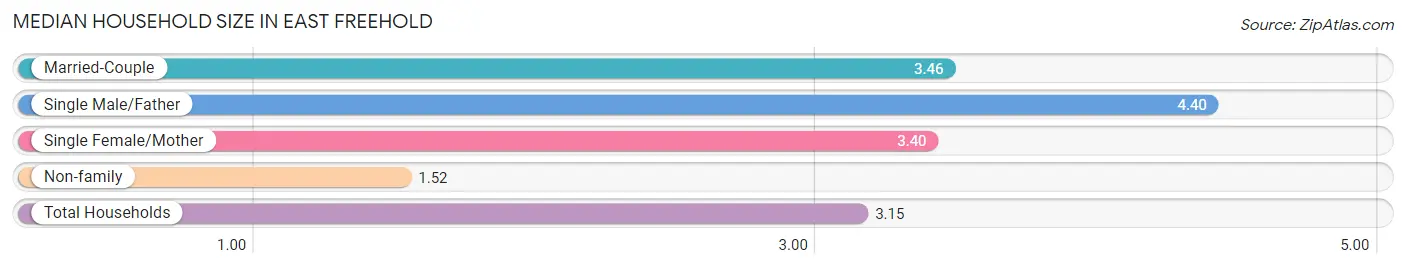
Median Household Size in East Freehold
The median household size in East Freehold is 3.15 persons per household, with single male/father households (5 | 0.3%) accounting for the largest median household size of 4.4 persons per household. non-family households (259 | 15.9%) represent the smallest median household size with 1.52 persons per household.
| Household Type | # Households | Household Size |
| Married-Couple | 1,240 (75.9%) | 3.46 |
| Single Male/Father | 5 (0.3%) | 4.40 |
| Single Female/Mother | 129 (7.9%) | 3.40 |
| Non-family | 259 (15.9%) | 1.52 |
| Total Households | 1,633 (100.0%) | 3.15 |
Household Size by Marriage Status in East Freehold
Out of a total of 1,633 households in East Freehold, 1,374 (84.1%) are family households, while 259 (15.9%) are nonfamily households. The most numerous type of family households are 3-person households, comprising 516, and the most common type of nonfamily households are 2-person households, comprising 131.
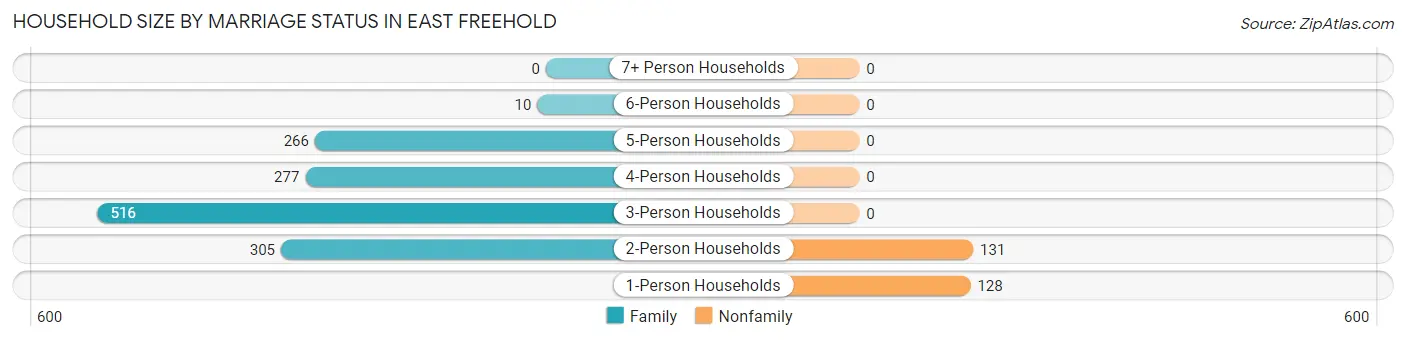
| Household Size | Family Households | Nonfamily Households |
| 1-Person Households | - | 128 (7.8%) |
| 2-Person Households | 305 (18.7%) | 131 (8.0%) |
| 3-Person Households | 516 (31.6%) | 0 (0.0%) |
| 4-Person Households | 277 (17.0%) | 0 (0.0%) |
| 5-Person Households | 266 (16.3%) | 0 (0.0%) |
| 6-Person Households | 10 (0.6%) | 0 (0.0%) |
| 7+ Person Households | 0 (0.0%) | 0 (0.0%) |
| Total | 1,374 (84.1%) | 259 (15.9%) |
Female Fertility in East Freehold
Fertility by Age in East Freehold
Average fertility rate in East Freehold is 16.0 births per 1,000 women. Women in the age bracket of 20 to 34 years have the highest fertility rate with 45.0 births per 1,000 women. Women in the age bracket of 20 to 34 years acount for 100.0% of all women with births.
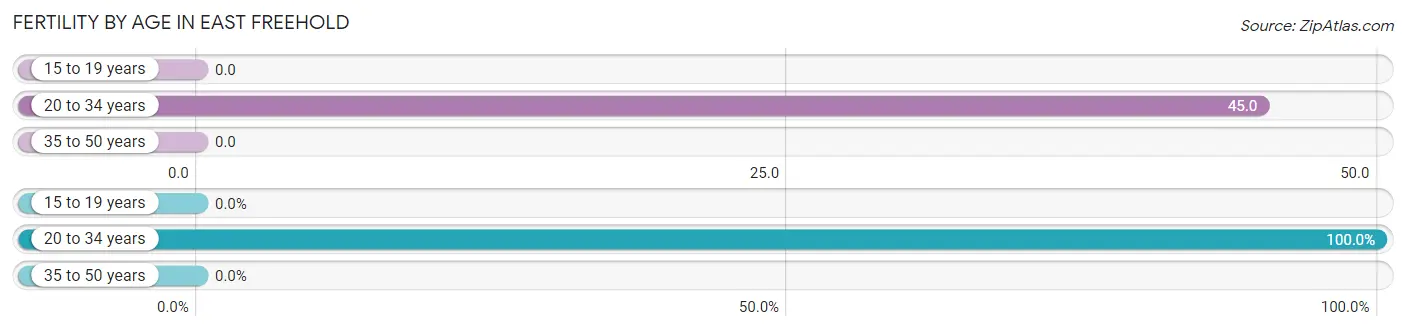
| Age Bracket | Women with Births | Births / 1,000 Women |
| 15 to 19 years | 0 (0.0%) | 0.0 |
| 20 to 34 years | 15 (100.0%) | 45.0 |
| 35 to 50 years | 0 (0.0%) | 0.0 |
| Total | 15 (100.0%) | 16.0 |
Fertility by Age by Marriage Status in East Freehold
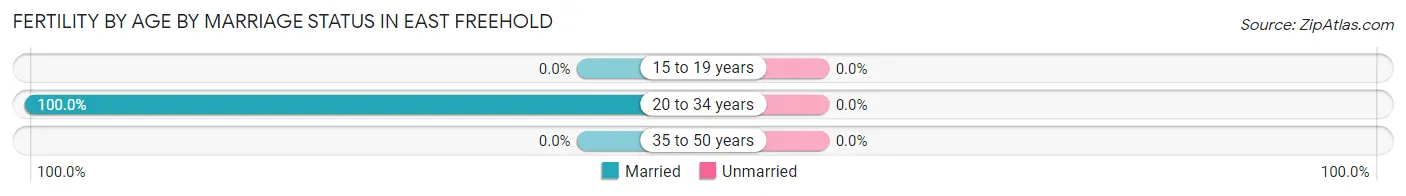
| Age Bracket | Married | Unmarried |
| 15 to 19 years | 0 (0.0%) | 0 (0.0%) |
| 20 to 34 years | 15 (100.0%) | 0 (0.0%) |
| 35 to 50 years | 0 (0.0%) | 0 (0.0%) |
| Total | 15 (100.0%) | 0 (0.0%) |
Fertility by Education in East Freehold
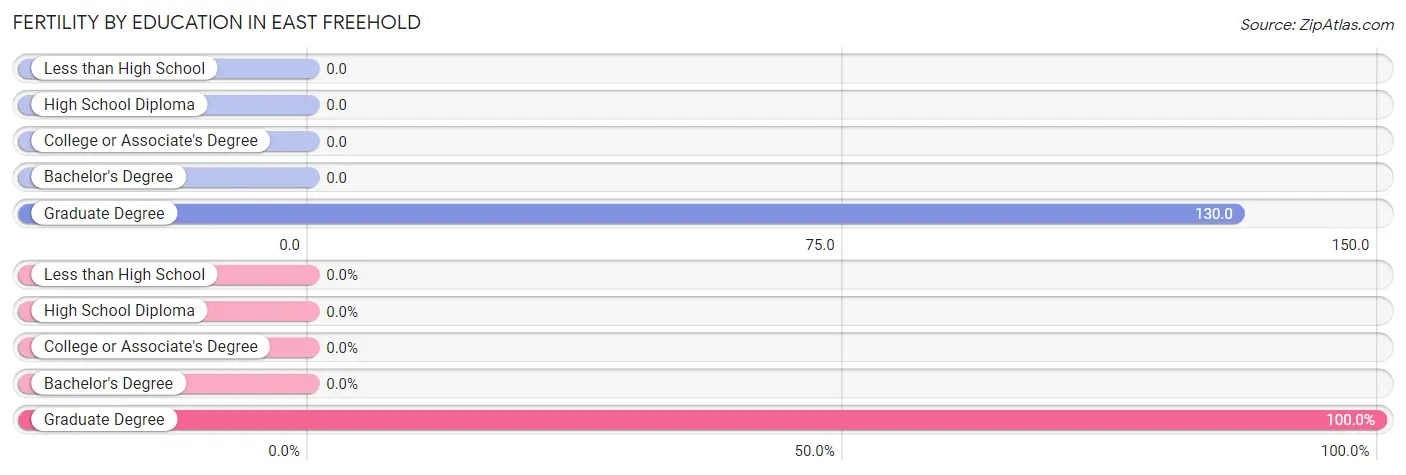
| Educational Attainment | Women with Births | Births / 1,000 Women |
| Less than High School | 0 (0.0%) | 0.0 |
| High School Diploma | 0 (0.0%) | 0.0 |
| College or Associate's Degree | 0 (0.0%) | 0.0 |
| Bachelor's Degree | 0 (0.0%) | 0.0 |
| Graduate Degree | 15 (100.0%) | 130.0 |
| Total | 15 (100.0%) | 16.0 |
Fertility by Education by Marriage Status in East Freehold
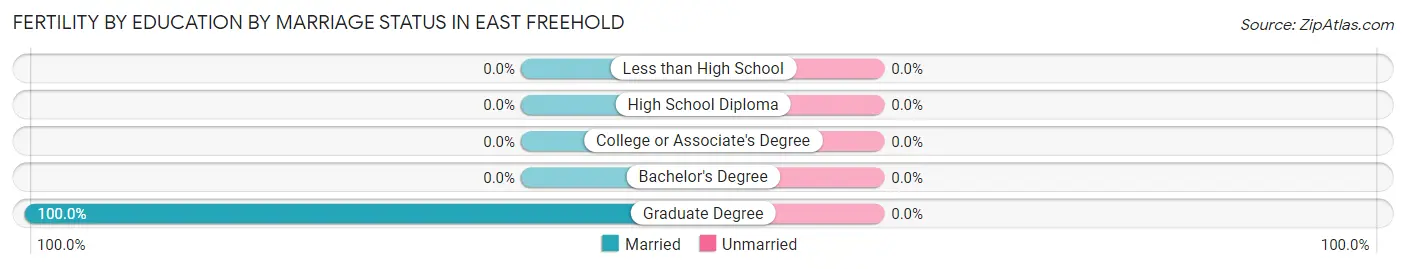
| Educational Attainment | Married | Unmarried |
| Less than High School | 0 (0.0%) | 0 (0.0%) |
| High School Diploma | 0 (0.0%) | 0 (0.0%) |
| College or Associate's Degree | 0 (0.0%) | 0 (0.0%) |
| Bachelor's Degree | 0 (0.0%) | 0 (0.0%) |
| Graduate Degree | 15 (100.0%) | 0 (0.0%) |
| Total | 15 (100.0%) | 0 (0.0%) |
Employment Characteristics in East Freehold
Employment by Class of Employer in East Freehold
Among the 2,886 employed individuals in East Freehold, private company employees (1,866 | 64.7%), local government employees (316 | 11.0%), and self-employed (incorporated) (233 | 8.1%) make up the most common classes of employment.
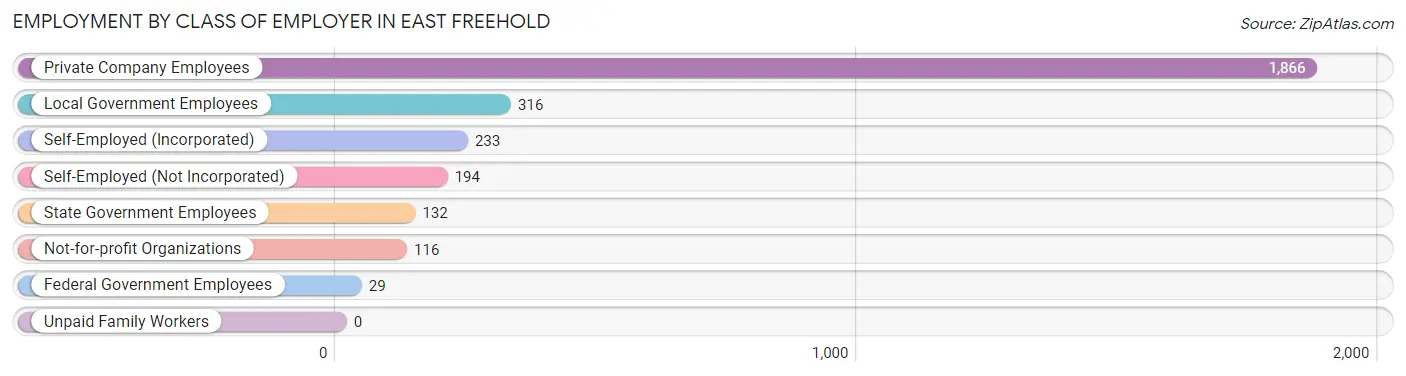
| Employer Class | # Employees | % Employees |
| Private Company Employees | 1,866 | 64.7% |
| Self-Employed (Incorporated) | 233 | 8.1% |
| Self-Employed (Not Incorporated) | 194 | 6.7% |
| Not-for-profit Organizations | 116 | 4.0% |
| Local Government Employees | 316 | 11.0% |
| State Government Employees | 132 | 4.6% |
| Federal Government Employees | 29 | 1.0% |
| Unpaid Family Workers | 0 | 0.0% |
| Total | 2,886 | 100.0% |
Employment Status by Age in East Freehold
According to the labor force statistics for East Freehold, out of the total population over 16 years of age (4,070), 76.1% or 3,097 individuals are in the labor force, with 6.0% or 186 of them unemployed. The age group with the highest labor force participation rate is 20 to 24 years, with 100.0% or 364 individuals in the labor force. Within the labor force, the 16 to 19 years age range has the highest percentage of unemployed individuals, with 28.3% or 53 of them being unemployed.
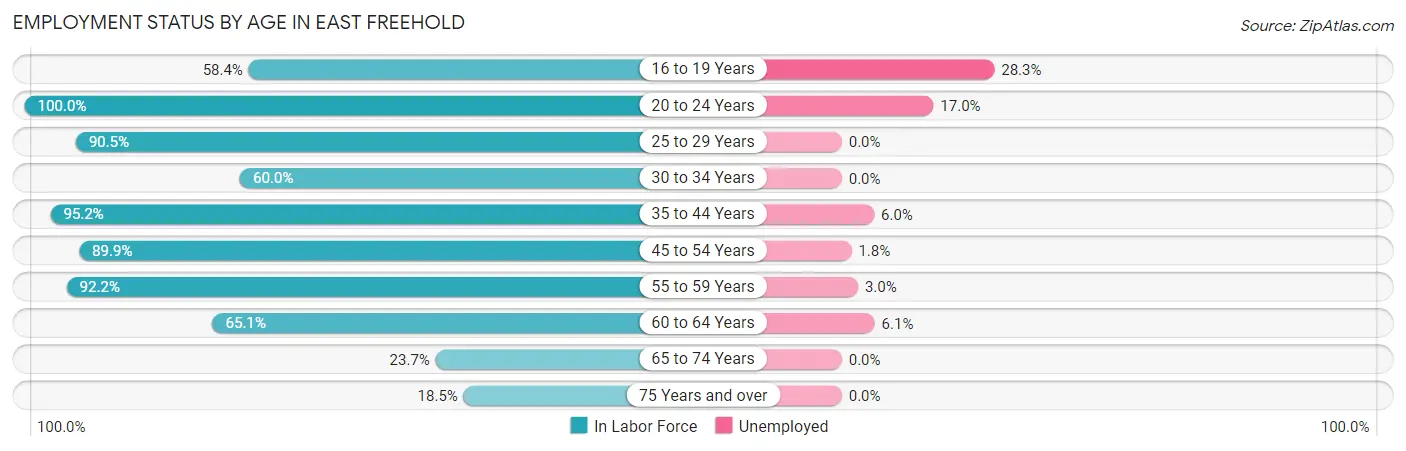
| Age Bracket | In Labor Force | Unemployed |
| 16 to 19 Years | 187 (58.4%) | 53 (28.3%) |
| 20 to 24 Years | 364 (100.0%) | 62 (17.0%) |
| 25 to 29 Years | 228 (90.5%) | 0 (0.0%) |
| 30 to 34 Years | 156 (60.0%) | 0 (0.0%) |
| 35 to 44 Years | 417 (95.2%) | 25 (6.0%) |
| 45 to 54 Years | 786 (89.9%) | 14 (1.8%) |
| 55 to 59 Years | 642 (92.2%) | 19 (3.0%) |
| 60 to 64 Years | 196 (65.1%) | 12 (6.1%) |
| 65 to 74 Years | 80 (23.7%) | 0 (0.0%) |
| 75 Years and over | 42 (18.5%) | 0 (0.0%) |
| Total | 3,097 (76.1%) | 186 (6.0%) |
Employment Status by Educational Attainment in East Freehold
According to labor force statistics for East Freehold, 86.0% of individuals (2,426) out of the total population between 25 and 64 years of age (2,821) are in the labor force, with 2.9% or 70 of them being unemployed. The group with the highest labor force participation rate are those with the educational attainment of bachelor's degree or higher, with 93.9% or 1,741 individuals in the labor force. Within the labor force, individuals with high school diploma education have the highest percentage of unemployment, with 29.3% or 51 of them being unemployed.
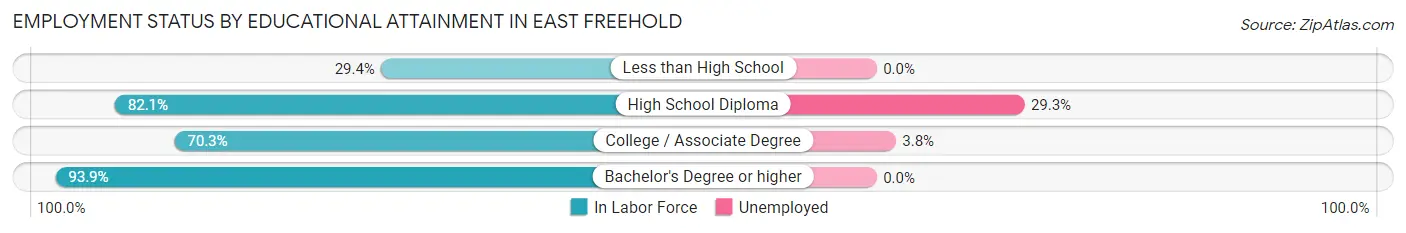
| Educational Attainment | In Labor Force | Unemployed |
| Less than High School | 15 (29.4%) | 0 (0.0%) |
| High School Diploma | 174 (82.1%) | 62 (29.3%) |
| College / Associate Degree | 495 (70.3%) | 27 (3.8%) |
| Bachelor's Degree or higher | 1,741 (93.9%) | 0 (0.0%) |
| Total | 2,426 (86.0%) | 82 (2.9%) |
Employment Occupations by Sex in East Freehold
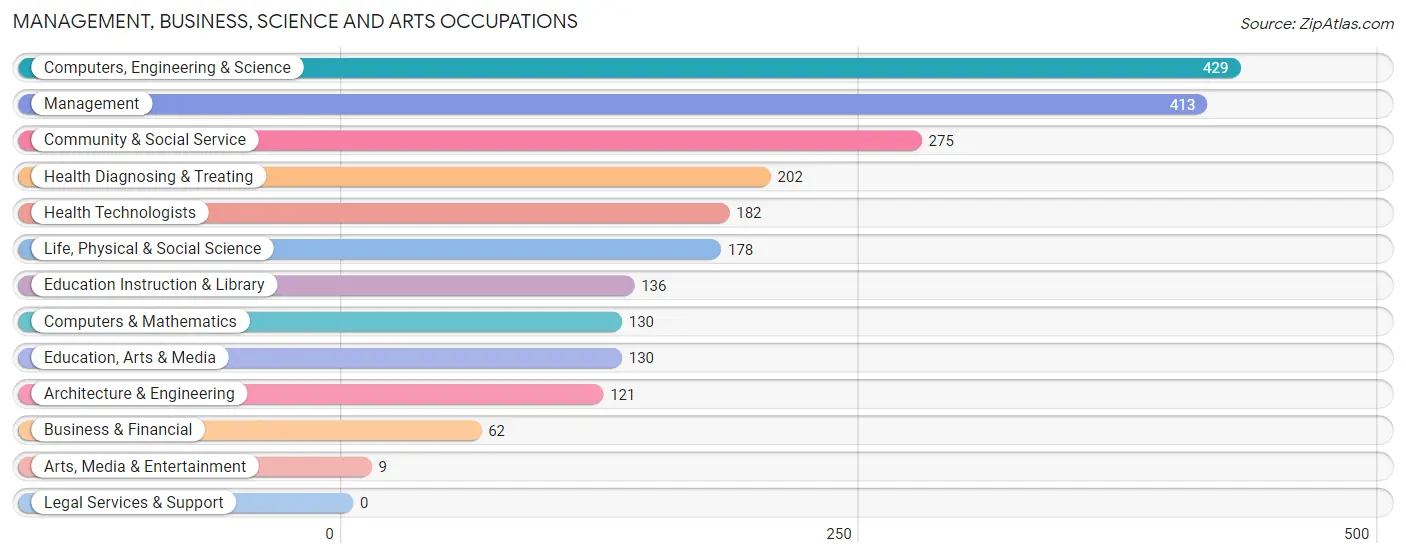
Management, Business, Science and Arts Occupations
The most common Management, Business, Science and Arts occupations in East Freehold are Computers, Engineering & Science (429 | 14.7%), Management (413 | 14.2%), Community & Social Service (275 | 9.4%), Health Diagnosing & Treating (202 | 6.9%), and Health Technologists (182 | 6.2%).
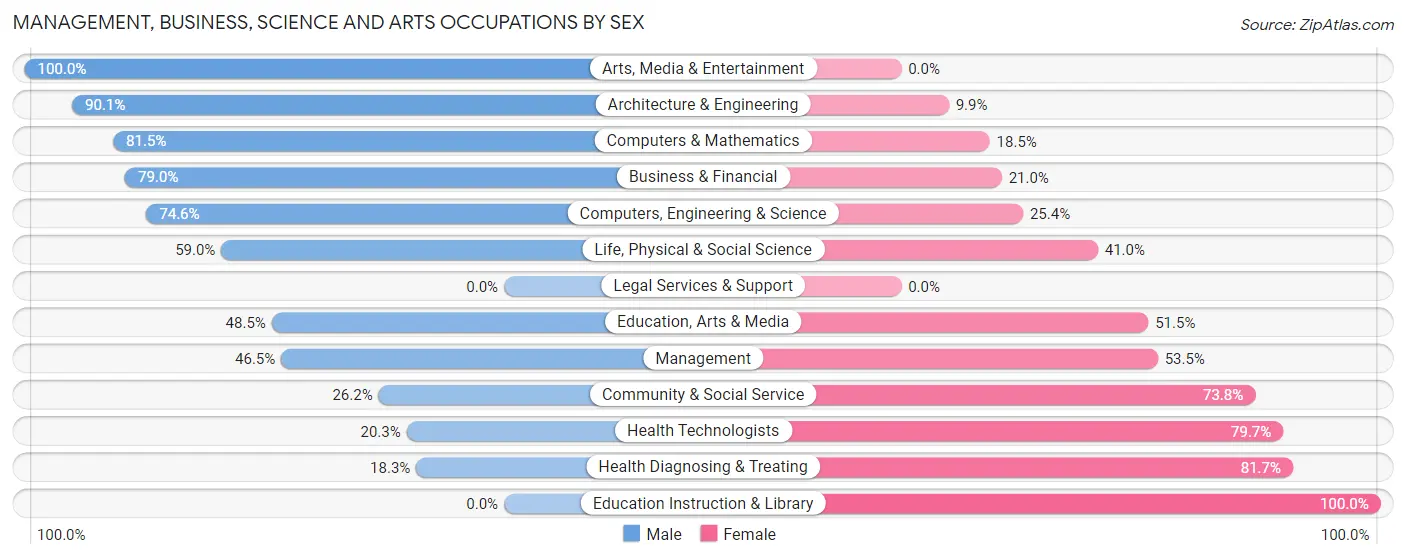
Management, Business, Science and Arts Occupations by Sex
Within the Management, Business, Science and Arts occupations in East Freehold, the most male-oriented occupations are Arts, Media & Entertainment (100.0%), Architecture & Engineering (90.1%), and Computers & Mathematics (81.5%), while the most female-oriented occupations are Education Instruction & Library (100.0%), Health Diagnosing & Treating (81.7%), and Health Technologists (79.7%).
| Occupation | Male | Female |
| Management | 192 (46.5%) | 221 (53.5%) |
| Business & Financial | 49 (79.0%) | 13 (21.0%) |
| Computers, Engineering & Science | 320 (74.6%) | 109 (25.4%) |
| Computers & Mathematics | 106 (81.5%) | 24 (18.5%) |
| Architecture & Engineering | 109 (90.1%) | 12 (9.9%) |
| Life, Physical & Social Science | 105 (59.0%) | 73 (41.0%) |
| Community & Social Service | 72 (26.2%) | 203 (73.8%) |
| Education, Arts & Media | 63 (48.5%) | 67 (51.5%) |
| Legal Services & Support | 0 (0.0%) | 0 (0.0%) |
| Education Instruction & Library | 0 (0.0%) | 136 (100.0%) |
| Arts, Media & Entertainment | 9 (100.0%) | 0 (0.0%) |
| Health Diagnosing & Treating | 37 (18.3%) | 165 (81.7%) |
| Health Technologists | 37 (20.3%) | 145 (79.7%) |
| Total (Category) | 670 (48.5%) | 711 (51.5%) |
| Total (Overall) | 1,682 (57.7%) | 1,231 (42.3%) |
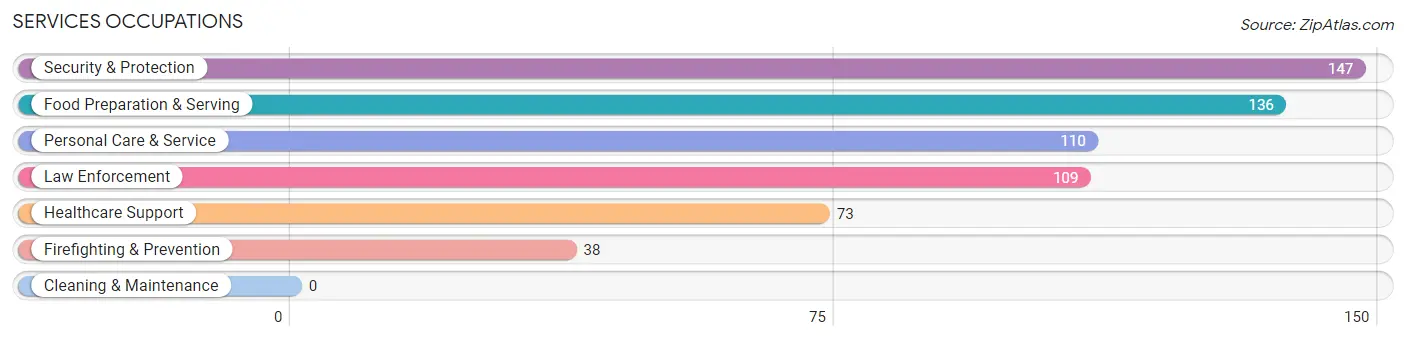
Services Occupations
The most common Services occupations in East Freehold are Security & Protection (147 | 5.1%), Food Preparation & Serving (136 | 4.7%), Personal Care & Service (110 | 3.8%), Law Enforcement (109 | 3.7%), and Healthcare Support (73 | 2.5%).
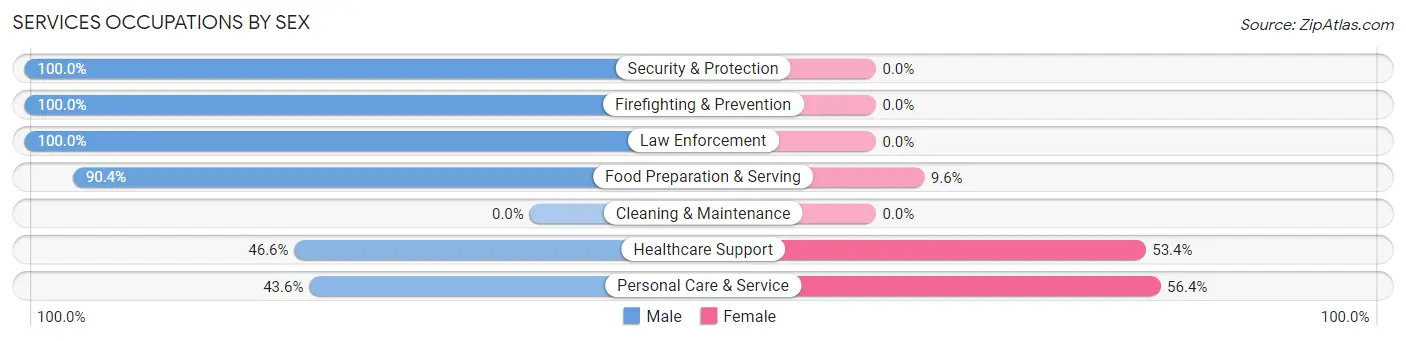
Services Occupations by Sex
Within the Services occupations in East Freehold, the most male-oriented occupations are Security & Protection (100.0%), Firefighting & Prevention (100.0%), and Law Enforcement (100.0%), while the most female-oriented occupations are Personal Care & Service (56.4%), Healthcare Support (53.4%), and Food Preparation & Serving (9.6%).
| Occupation | Male | Female |
| Healthcare Support | 34 (46.6%) | 39 (53.4%) |
| Security & Protection | 147 (100.0%) | 0 (0.0%) |
| Firefighting & Prevention | 38 (100.0%) | 0 (0.0%) |
| Law Enforcement | 109 (100.0%) | 0 (0.0%) |
| Food Preparation & Serving | 123 (90.4%) | 13 (9.6%) |
| Cleaning & Maintenance | 0 (0.0%) | 0 (0.0%) |
| Personal Care & Service | 48 (43.6%) | 62 (56.4%) |
| Total (Category) | 352 (75.5%) | 114 (24.5%) |
| Total (Overall) | 1,682 (57.7%) | 1,231 (42.3%) |
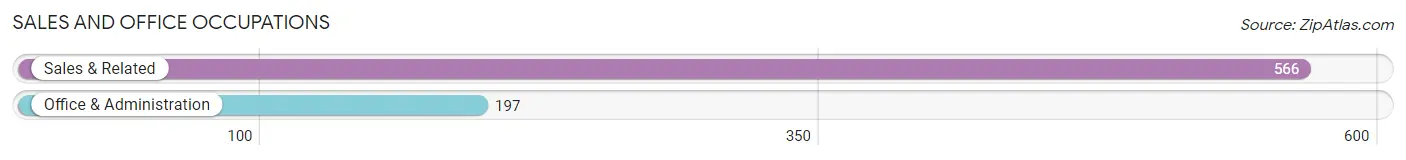
Sales and Office Occupations
The most common Sales and Office occupations in East Freehold are Sales & Related (566 | 19.4%), and Office & Administration (197 | 6.8%).
Sales and Office Occupations by Sex
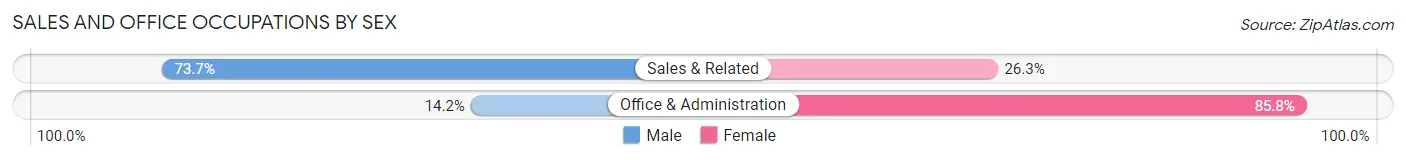
| Occupation | Male | Female |
| Sales & Related | 417 (73.7%) | 149 (26.3%) |
| Office & Administration | 28 (14.2%) | 169 (85.8%) |
| Total (Category) | 445 (58.3%) | 318 (41.7%) |
| Total (Overall) | 1,682 (57.7%) | 1,231 (42.3%) |
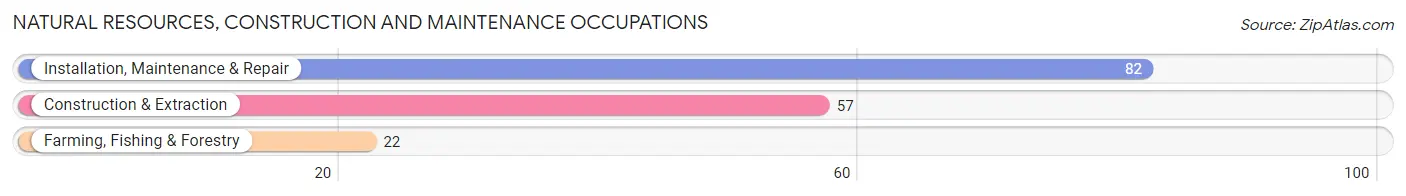
Natural Resources, Construction and Maintenance Occupations
The most common Natural Resources, Construction and Maintenance occupations in East Freehold are Installation, Maintenance & Repair (82 | 2.8%), Construction & Extraction (57 | 2.0%), and Farming, Fishing & Forestry (22 | 0.8%).
Natural Resources, Construction and Maintenance Occupations by Sex
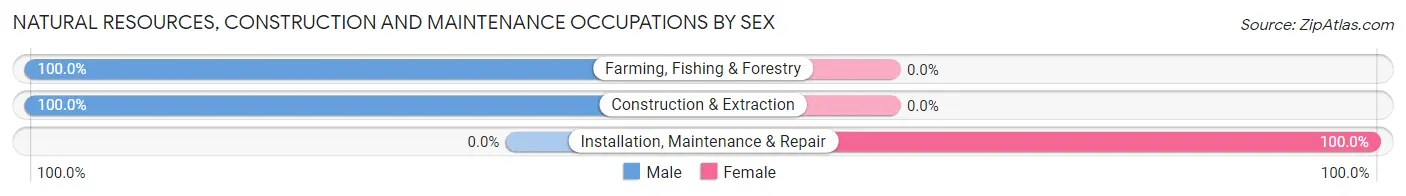
| Occupation | Male | Female |
| Farming, Fishing & Forestry | 22 (100.0%) | 0 (0.0%) |
| Construction & Extraction | 57 (100.0%) | 0 (0.0%) |
| Installation, Maintenance & Repair | 0 (0.0%) | 82 (100.0%) |
| Total (Category) | 79 (49.1%) | 82 (50.9%) |
| Total (Overall) | 1,682 (57.7%) | 1,231 (42.3%) |
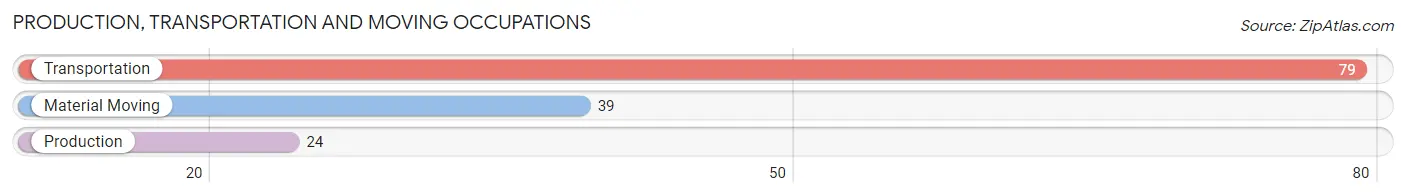
Production, Transportation and Moving Occupations
The most common Production, Transportation and Moving occupations in East Freehold are Transportation (79 | 2.7%), Material Moving (39 | 1.3%), and Production (24 | 0.8%).
Production, Transportation and Moving Occupations by Sex
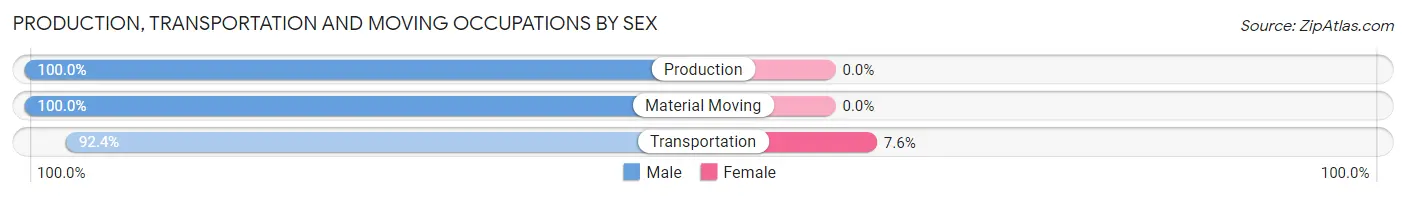
| Occupation | Male | Female |
| Production | 24 (100.0%) | 0 (0.0%) |
| Transportation | 73 (92.4%) | 6 (7.6%) |
| Material Moving | 39 (100.0%) | 0 (0.0%) |
| Total (Category) | 136 (95.8%) | 6 (4.2%) |
| Total (Overall) | 1,682 (57.7%) | 1,231 (42.3%) |
Employment Industries by Sex in East Freehold
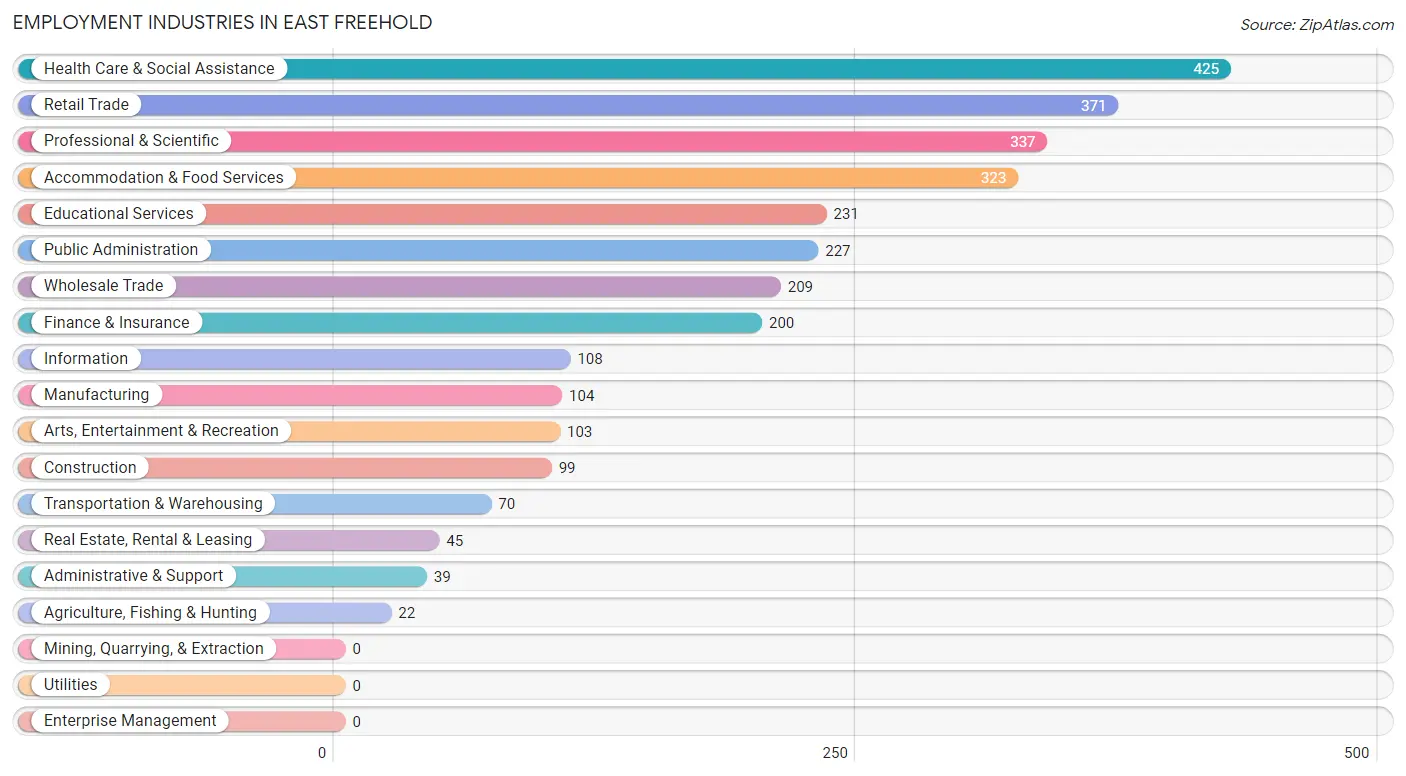
Employment Industries in East Freehold
The major employment industries in East Freehold include Health Care & Social Assistance (425 | 14.6%), Retail Trade (371 | 12.7%), Professional & Scientific (337 | 11.6%), Accommodation & Food Services (323 | 11.1%), and Educational Services (231 | 7.9%).
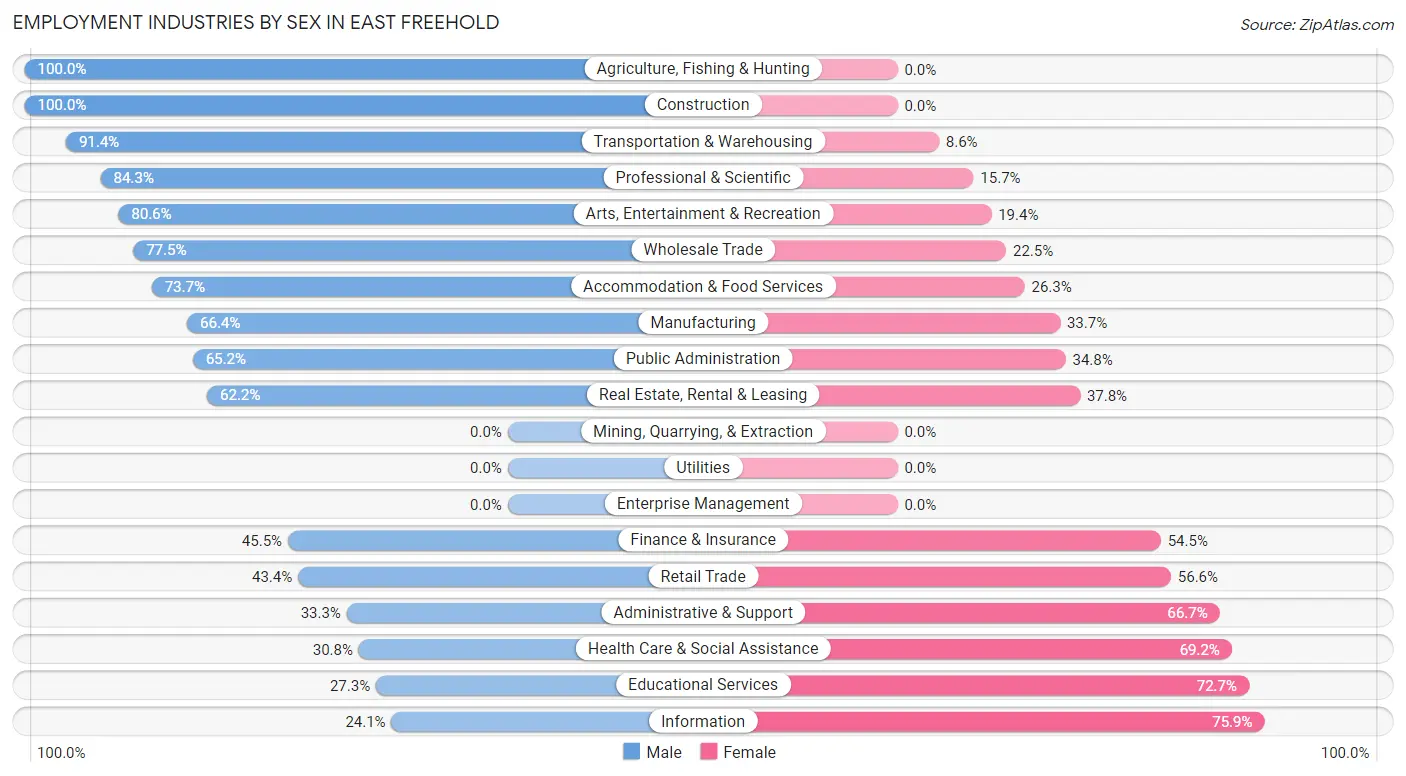
Employment Industries by Sex in East Freehold
The East Freehold industries that see more men than women are Agriculture, Fishing & Hunting (100.0%), Construction (100.0%), and Transportation & Warehousing (91.4%), whereas the industries that tend to have a higher number of women are Information (75.9%), Educational Services (72.7%), and Health Care & Social Assistance (69.2%).
| Industry | Male | Female |
| Agriculture, Fishing & Hunting | 22 (100.0%) | 0 (0.0%) |
| Mining, Quarrying, & Extraction | 0 (0.0%) | 0 (0.0%) |
| Construction | 99 (100.0%) | 0 (0.0%) |
| Manufacturing | 69 (66.3%) | 35 (33.7%) |
| Wholesale Trade | 162 (77.5%) | 47 (22.5%) |
| Retail Trade | 161 (43.4%) | 210 (56.6%) |
| Transportation & Warehousing | 64 (91.4%) | 6 (8.6%) |
| Utilities | 0 (0.0%) | 0 (0.0%) |
| Information | 26 (24.1%) | 82 (75.9%) |
| Finance & Insurance | 91 (45.5%) | 109 (54.5%) |
| Real Estate, Rental & Leasing | 28 (62.2%) | 17 (37.8%) |
| Professional & Scientific | 284 (84.3%) | 53 (15.7%) |
| Enterprise Management | 0 (0.0%) | 0 (0.0%) |
| Administrative & Support | 13 (33.3%) | 26 (66.7%) |
| Educational Services | 63 (27.3%) | 168 (72.7%) |
| Health Care & Social Assistance | 131 (30.8%) | 294 (69.2%) |
| Arts, Entertainment & Recreation | 83 (80.6%) | 20 (19.4%) |
| Accommodation & Food Services | 238 (73.7%) | 85 (26.3%) |
| Public Administration | 148 (65.2%) | 79 (34.8%) |
| Total | 1,682 (57.7%) | 1,231 (42.3%) |
Education in East Freehold
School Enrollment in East Freehold
The most common levels of schooling among the 1,516 students in East Freehold are high school (342 | 22.6%), nursery / preschool (296 | 19.5%), and middle school (271 | 17.9%).

| School Level | # Students | % Students |
| Nursery / Preschool | 296 | 19.5% |
| Kindergarten | 63 | 4.2% |
| Elementary School | 176 | 11.6% |
| Middle School | 271 | 17.9% |
| High School | 342 | 22.6% |
| College / Undergraduate | 228 | 15.0% |
| Graduate / Professional | 140 | 9.2% |
| Total | 1,516 | 100.0% |
School Enrollment by Age by Funding Source in East Freehold
Out of a total of 1,516 students who are enrolled in schools in East Freehold, 493 (32.5%) attend a private institution, while the remaining 1,023 (67.5%) are enrolled in public schools. The age group of 3 to 4 year olds has the highest likelihood of being enrolled in private schools, with 296 (100.0% in the age bracket) enrolled. Conversely, the age group of 10 to 14 year olds has the lowest likelihood of being enrolled in a private school, with 333 (100.0% in the age bracket) attending a public institution.
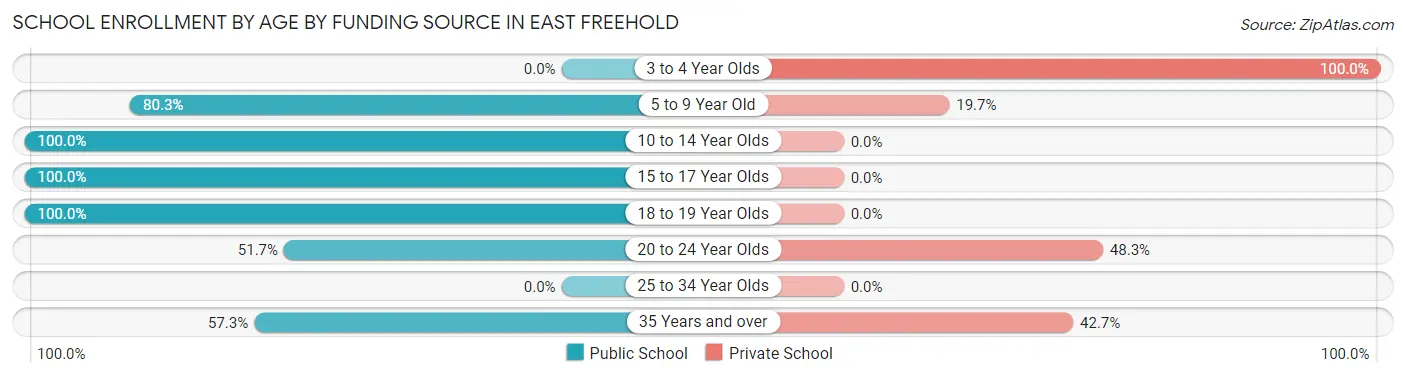
| Age Bracket | Public School | Private School |
| 3 to 4 Year Olds | 0 (0.0%) | 296 (100.0%) |
| 5 to 9 Year Old | 192 (80.3%) | 47 (19.7%) |
| 10 to 14 Year Olds | 333 (100.0%) | 0 (0.0%) |
| 15 to 17 Year Olds | 280 (100.0%) | 0 (0.0%) |
| 18 to 19 Year Olds | 46 (100.0%) | 0 (0.0%) |
| 20 to 24 Year Olds | 106 (51.7%) | 99 (48.3%) |
| 25 to 34 Year Olds | 0 (0.0%) | 0 (0.0%) |
| 35 Years and over | 67 (57.3%) | 50 (42.7%) |
| Total | 1,023 (67.5%) | 493 (32.5%) |
Educational Attainment by Field of Study in East Freehold
Business (538 | 23.5%), science & technology (298 | 13.0%), psychology (199 | 8.7%), arts & humanities (180 | 7.9%), and bio, nature & agricultural (156 | 6.8%) are the most common fields of study among 2,290 individuals in East Freehold who have obtained a bachelor's degree or higher.
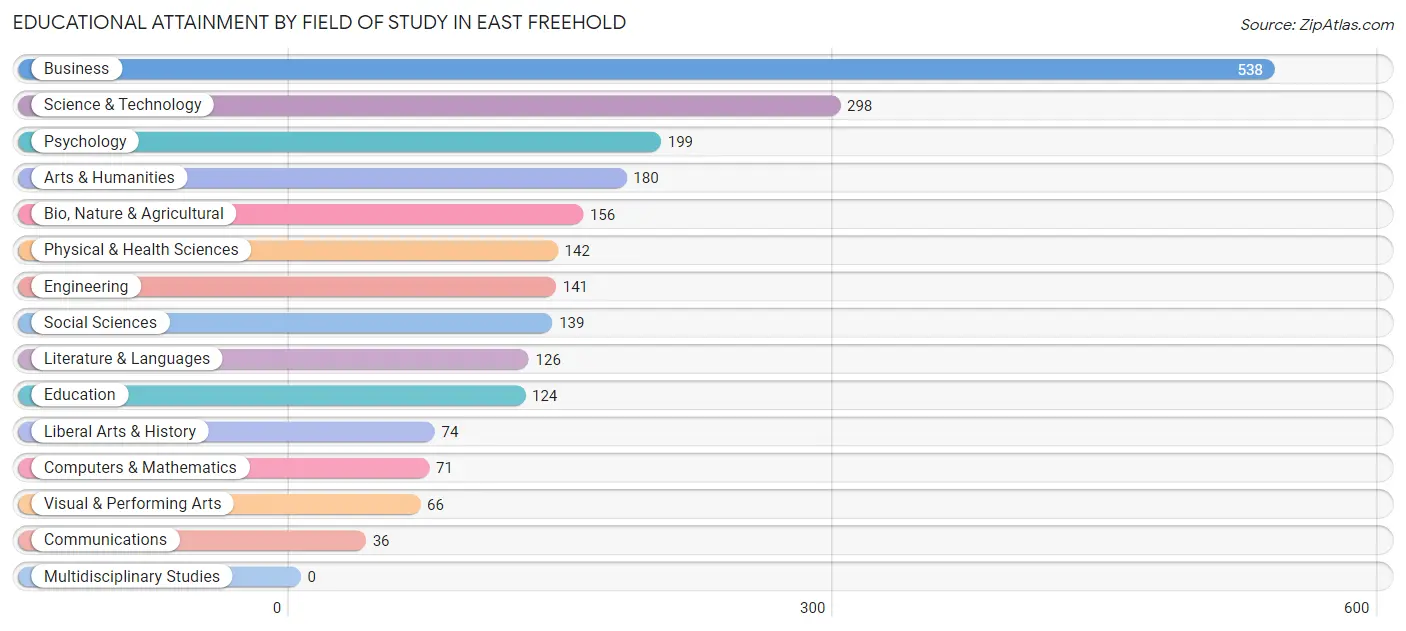
| Field of Study | # Graduates | % Graduates |
| Computers & Mathematics | 71 | 3.1% |
| Bio, Nature & Agricultural | 156 | 6.8% |
| Physical & Health Sciences | 142 | 6.2% |
| Psychology | 199 | 8.7% |
| Social Sciences | 139 | 6.1% |
| Engineering | 141 | 6.2% |
| Multidisciplinary Studies | 0 | 0.0% |
| Science & Technology | 298 | 13.0% |
| Business | 538 | 23.5% |
| Education | 124 | 5.4% |
| Literature & Languages | 126 | 5.5% |
| Liberal Arts & History | 74 | 3.2% |
| Visual & Performing Arts | 66 | 2.9% |
| Communications | 36 | 1.6% |
| Arts & Humanities | 180 | 7.9% |
| Total | 2,290 | 100.0% |
Transportation & Commute in East Freehold
Vehicle Availability by Sex in East Freehold
The most prevalent vehicle ownership categories in East Freehold are males with 3 vehicles (677, accounting for 40.3%) and females with 3 vehicles (444, making up 56.2%).
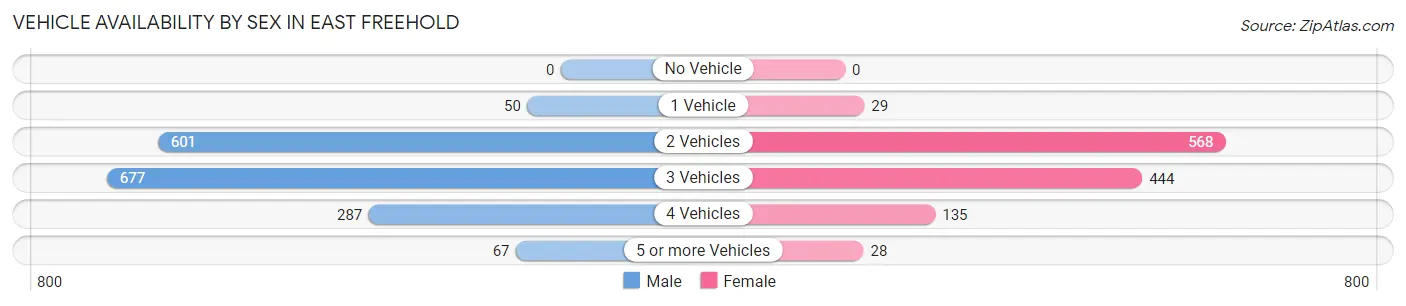
| Vehicles Available | Male | Female |
| No Vehicle | 0 (0.0%) | 0 (0.0%) |
| 1 Vehicle | 50 (3.0%) | 29 (2.4%) |
| 2 Vehicles | 601 (35.7%) | 568 (47.2%) |
| 3 Vehicles | 677 (40.3%) | 444 (36.9%) |
| 4 Vehicles | 287 (17.1%) | 135 (11.2%) |
| 5 or more Vehicles | 67 (4.0%) | 28 (2.3%) |
| Total | 1,682 (100.0%) | 1,204 (100.0%) |
Commute Time in East Freehold
The most frequently occuring commute durations in East Freehold are 45 to 59 minutes (368 commuters, 15.0%), 90 or more minutes (353 commuters, 14.4%), and 20 to 24 minutes (349 commuters, 14.2%).
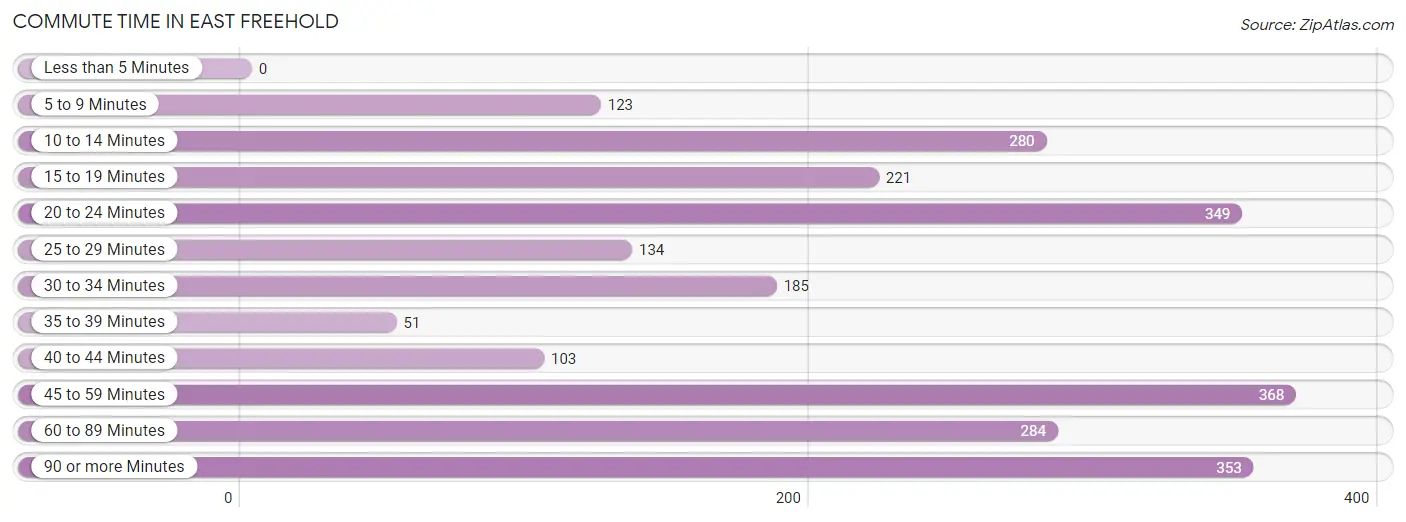
| Commute Time | # Commuters | % Commuters |
| Less than 5 Minutes | 0 | 0.0% |
| 5 to 9 Minutes | 123 | 5.0% |
| 10 to 14 Minutes | 280 | 11.4% |
| 15 to 19 Minutes | 221 | 9.0% |
| 20 to 24 Minutes | 349 | 14.2% |
| 25 to 29 Minutes | 134 | 5.5% |
| 30 to 34 Minutes | 185 | 7.5% |
| 35 to 39 Minutes | 51 | 2.1% |
| 40 to 44 Minutes | 103 | 4.2% |
| 45 to 59 Minutes | 368 | 15.0% |
| 60 to 89 Minutes | 284 | 11.6% |
| 90 or more Minutes | 353 | 14.4% |
Commute Time by Sex in East Freehold
The most common commute times in East Freehold are 45 to 59 minutes (321 commuters, 22.9%) for males and 10 to 14 minutes (194 commuters, 18.5%) for females.
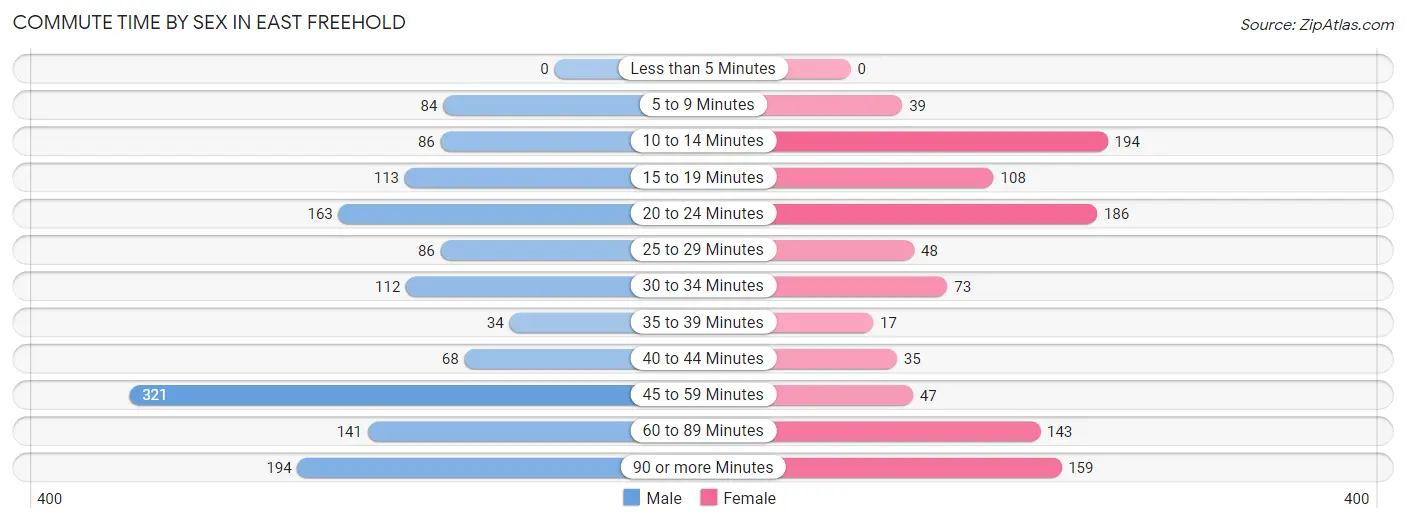
| Commute Time | Male | Female |
| Less than 5 Minutes | 0 (0.0%) | 0 (0.0%) |
| 5 to 9 Minutes | 84 (6.0%) | 39 (3.7%) |
| 10 to 14 Minutes | 86 (6.1%) | 194 (18.5%) |
| 15 to 19 Minutes | 113 (8.1%) | 108 (10.3%) |
| 20 to 24 Minutes | 163 (11.6%) | 186 (17.7%) |
| 25 to 29 Minutes | 86 (6.1%) | 48 (4.6%) |
| 30 to 34 Minutes | 112 (8.0%) | 73 (7.0%) |
| 35 to 39 Minutes | 34 (2.4%) | 17 (1.6%) |
| 40 to 44 Minutes | 68 (4.9%) | 35 (3.3%) |
| 45 to 59 Minutes | 321 (22.9%) | 47 (4.5%) |
| 60 to 89 Minutes | 141 (10.1%) | 143 (13.6%) |
| 90 or more Minutes | 194 (13.8%) | 159 (15.2%) |
Time of Departure to Work by Sex in East Freehold
The most frequent times of departure to work in East Freehold are 5:00 AM to 5:29 AM (197, 14.1%) for males and 8:00 AM to 8:29 AM (263, 25.1%) for females.
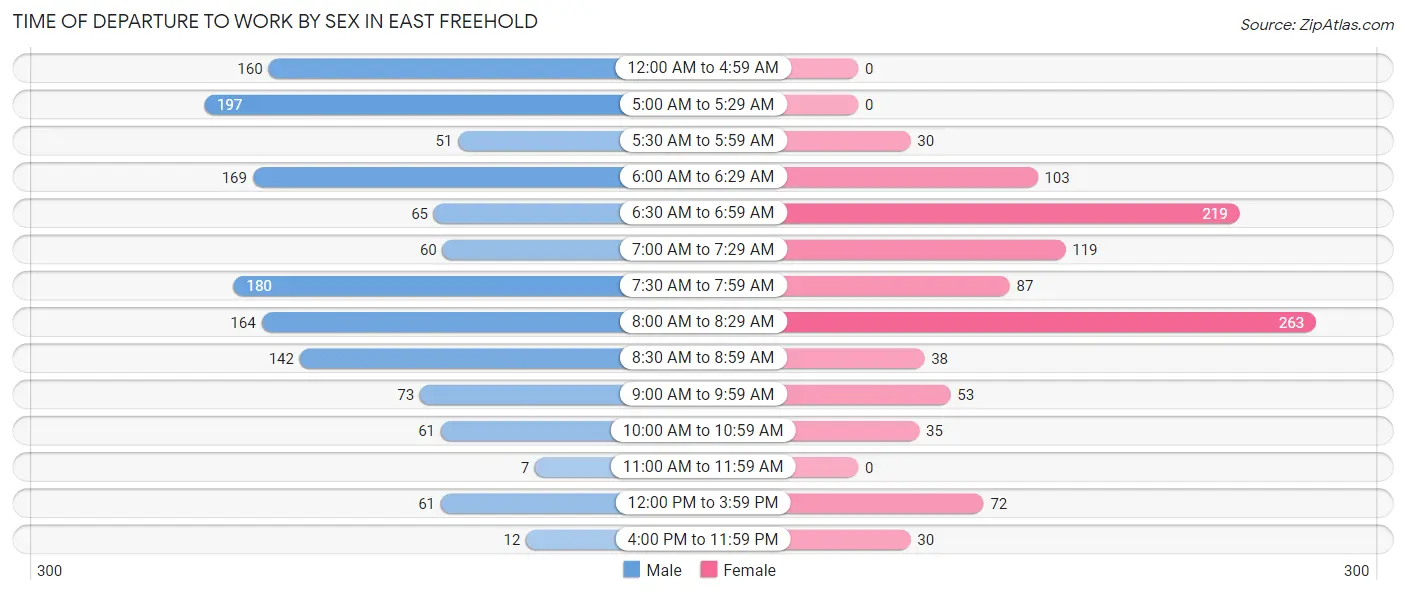
| Time of Departure | Male | Female |
| 12:00 AM to 4:59 AM | 160 (11.4%) | 0 (0.0%) |
| 5:00 AM to 5:29 AM | 197 (14.1%) | 0 (0.0%) |
| 5:30 AM to 5:59 AM | 51 (3.6%) | 30 (2.9%) |
| 6:00 AM to 6:29 AM | 169 (12.0%) | 103 (9.8%) |
| 6:30 AM to 6:59 AM | 65 (4.6%) | 219 (20.9%) |
| 7:00 AM to 7:29 AM | 60 (4.3%) | 119 (11.3%) |
| 7:30 AM to 7:59 AM | 180 (12.8%) | 87 (8.3%) |
| 8:00 AM to 8:29 AM | 164 (11.7%) | 263 (25.1%) |
| 8:30 AM to 8:59 AM | 142 (10.1%) | 38 (3.6%) |
| 9:00 AM to 9:59 AM | 73 (5.2%) | 53 (5.1%) |
| 10:00 AM to 10:59 AM | 61 (4.3%) | 35 (3.3%) |
| 11:00 AM to 11:59 AM | 7 (0.5%) | 0 (0.0%) |
| 12:00 PM to 3:59 PM | 61 (4.3%) | 72 (6.9%) |
| 4:00 PM to 11:59 PM | 12 (0.9%) | 30 (2.9%) |
| Total | 1,402 (100.0%) | 1,049 (100.0%) |
Housing Occupancy in East Freehold
Occupancy by Ownership in East Freehold
Of the total 1,633 dwellings in East Freehold, owner-occupied units account for 1,491 (91.3%), while renter-occupied units make up 142 (8.7%).
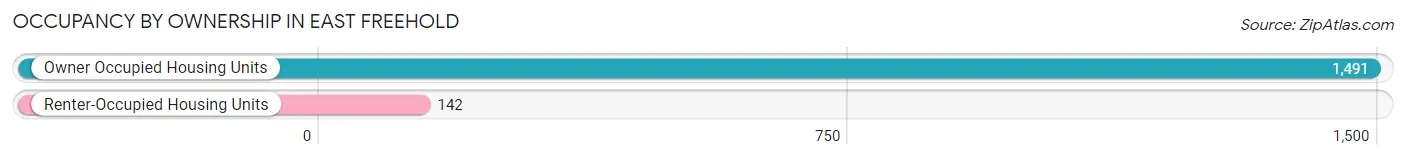
| Occupancy | # Housing Units | % Housing Units |
| Owner Occupied Housing Units | 1,491 | 91.3% |
| Renter-Occupied Housing Units | 142 | 8.7% |
| Total Occupied Housing Units | 1,633 | 100.0% |
Occupancy by Household Size in East Freehold
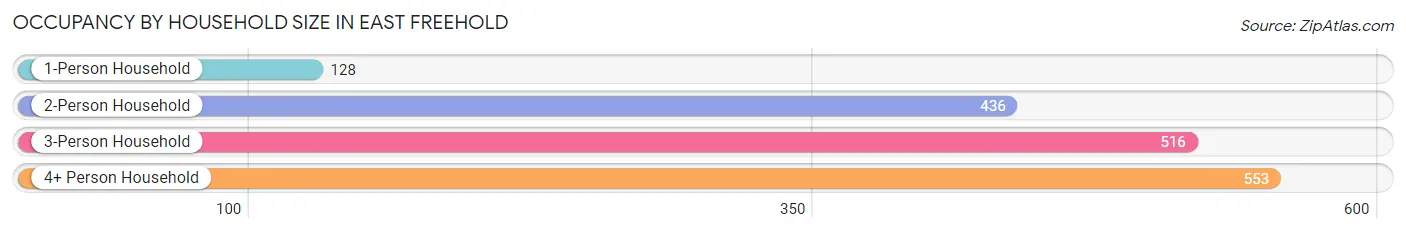
| Household Size | # Housing Units | % Housing Units |
| 1-Person Household | 128 | 7.8% |
| 2-Person Household | 436 | 26.7% |
| 3-Person Household | 516 | 31.6% |
| 4+ Person Household | 553 | 33.9% |
| Total Housing Units | 1,633 | 100.0% |
Occupancy by Ownership by Household Size in East Freehold
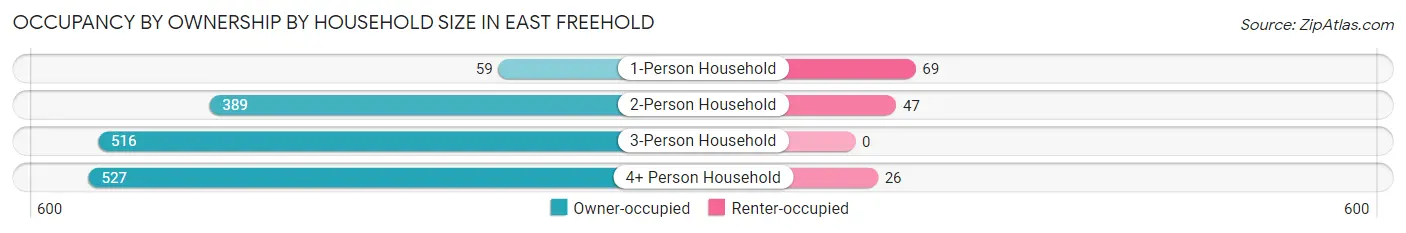
| Household Size | Owner-occupied | Renter-occupied |
| 1-Person Household | 59 (46.1%) | 69 (53.9%) |
| 2-Person Household | 389 (89.2%) | 47 (10.8%) |
| 3-Person Household | 516 (100.0%) | 0 (0.0%) |
| 4+ Person Household | 527 (95.3%) | 26 (4.7%) |
| Total Housing Units | 1,491 (91.3%) | 142 (8.7%) |
Occupancy by Educational Attainment in East Freehold
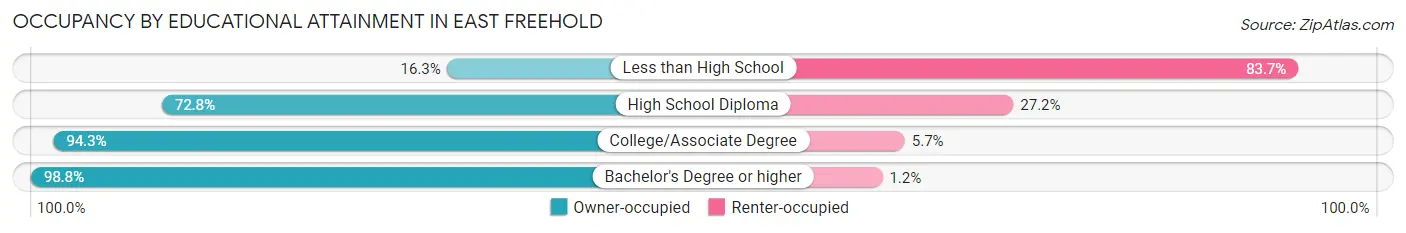
| Household Size | Owner-occupied | Renter-occupied |
| Less than High School | 8 (16.3%) | 41 (83.7%) |
| High School Diploma | 182 (72.8%) | 68 (27.2%) |
| College/Associate Degree | 348 (94.3%) | 21 (5.7%) |
| Bachelor's Degree or higher | 953 (98.8%) | 12 (1.2%) |
Occupancy by Age of Householder in East Freehold
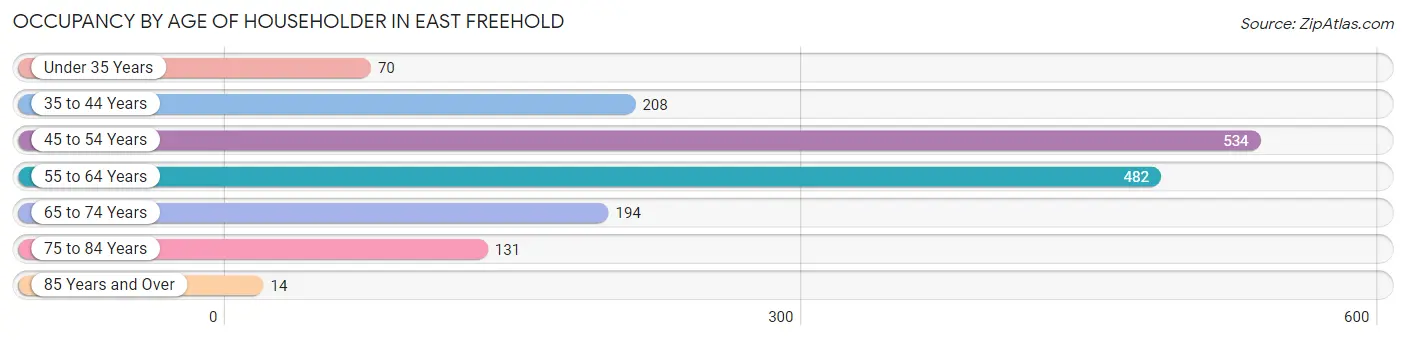
| Age Bracket | # Households | % Households |
| Under 35 Years | 70 | 4.3% |
| 35 to 44 Years | 208 | 12.7% |
| 45 to 54 Years | 534 | 32.7% |
| 55 to 64 Years | 482 | 29.5% |
| 65 to 74 Years | 194 | 11.9% |
| 75 to 84 Years | 131 | 8.0% |
| 85 Years and Over | 14 | 0.9% |
| Total | 1,633 | 100.0% |
Housing Finances in East Freehold
Median Income by Occupancy in East Freehold
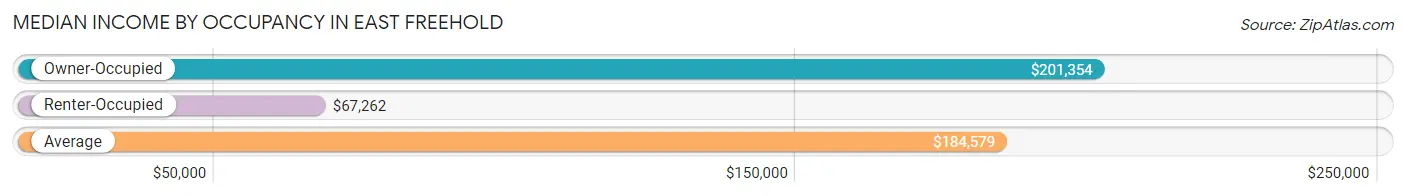
| Occupancy Type | # Households | Median Income |
| Owner-Occupied | 1,491 (91.3%) | $201,354 |
| Renter-Occupied | 142 (8.7%) | $67,262 |
| Average | 1,633 (100.0%) | $184,579 |
Occupancy by Householder Income Bracket in East Freehold
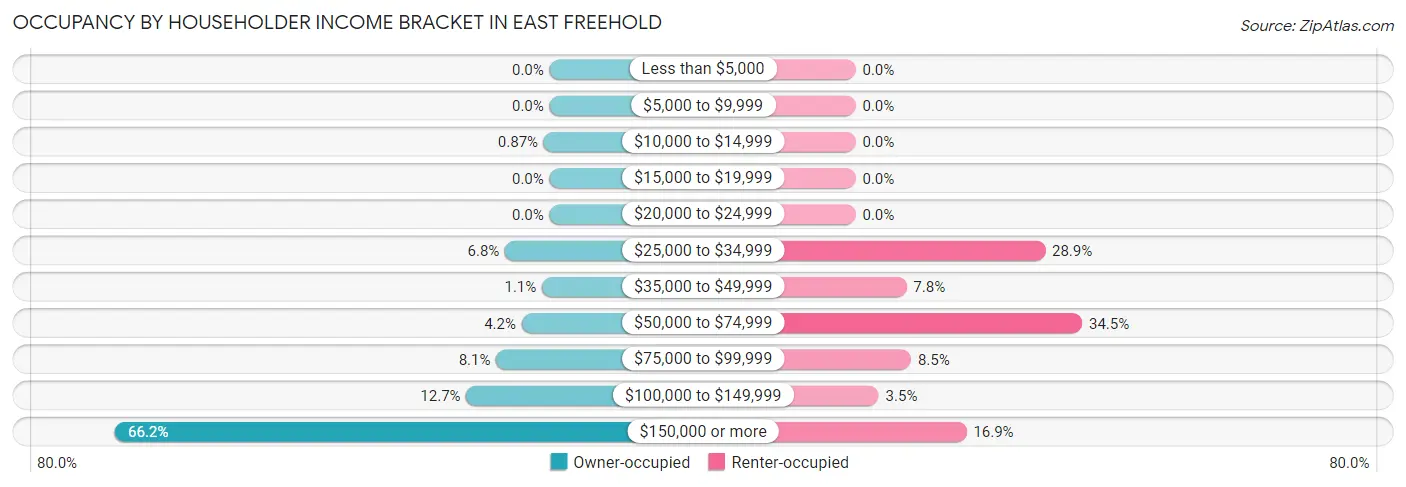
| Income Bracket | Owner-occupied | Renter-occupied |
| Less than $5,000 | 0 (0.0%) | 0 (0.0%) |
| $5,000 to $9,999 | 0 (0.0%) | 0 (0.0%) |
| $10,000 to $14,999 | 13 (0.9%) | 0 (0.0%) |
| $15,000 to $19,999 | 0 (0.0%) | 0 (0.0%) |
| $20,000 to $24,999 | 0 (0.0%) | 0 (0.0%) |
| $25,000 to $34,999 | 101 (6.8%) | 41 (28.9%) |
| $35,000 to $49,999 | 17 (1.1%) | 11 (7.7%) |
| $50,000 to $74,999 | 63 (4.2%) | 49 (34.5%) |
| $75,000 to $99,999 | 121 (8.1%) | 12 (8.5%) |
| $100,000 to $149,999 | 189 (12.7%) | 5 (3.5%) |
| $150,000 or more | 987 (66.2%) | 24 (16.9%) |
| Total | 1,491 (100.0%) | 142 (100.0%) |
Monthly Housing Cost Tiers in East Freehold
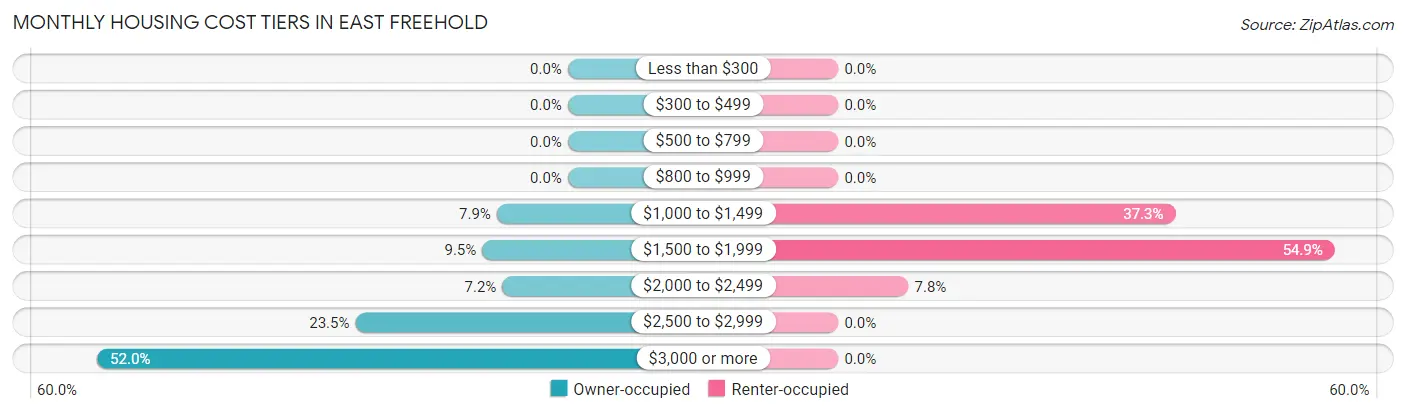
| Monthly Cost | Owner-occupied | Renter-occupied |
| Less than $300 | 0 (0.0%) | 0 (0.0%) |
| $300 to $499 | 0 (0.0%) | 0 (0.0%) |
| $500 to $799 | 0 (0.0%) | 0 (0.0%) |
| $800 to $999 | 0 (0.0%) | 0 (0.0%) |
| $1,000 to $1,499 | 117 (7.9%) | 53 (37.3%) |
| $1,500 to $1,999 | 141 (9.5%) | 78 (54.9%) |
| $2,000 to $2,499 | 108 (7.2%) | 11 (7.7%) |
| $2,500 to $2,999 | 350 (23.5%) | 0 (0.0%) |
| $3,000 or more | 775 (52.0%) | 0 (0.0%) |
| Total | 1,491 (100.0%) | 142 (100.0%) |
Physical Housing Characteristics in East Freehold
Housing Structures in East Freehold
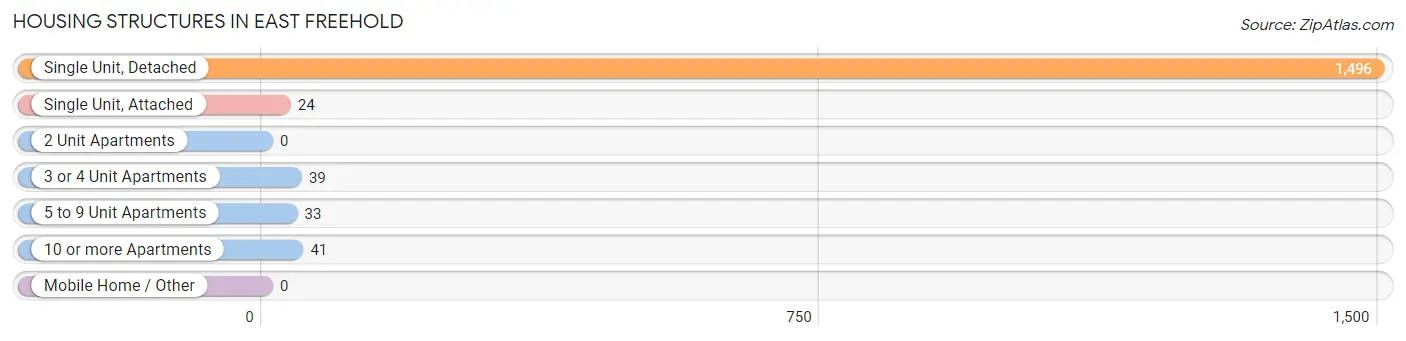
| Structure Type | # Housing Units | % Housing Units |
| Single Unit, Detached | 1,496 | 91.6% |
| Single Unit, Attached | 24 | 1.5% |
| 2 Unit Apartments | 0 | 0.0% |
| 3 or 4 Unit Apartments | 39 | 2.4% |
| 5 to 9 Unit Apartments | 33 | 2.0% |
| 10 or more Apartments | 41 | 2.5% |
| Mobile Home / Other | 0 | 0.0% |
| Total | 1,633 | 100.0% |
Housing Structures by Occupancy in East Freehold
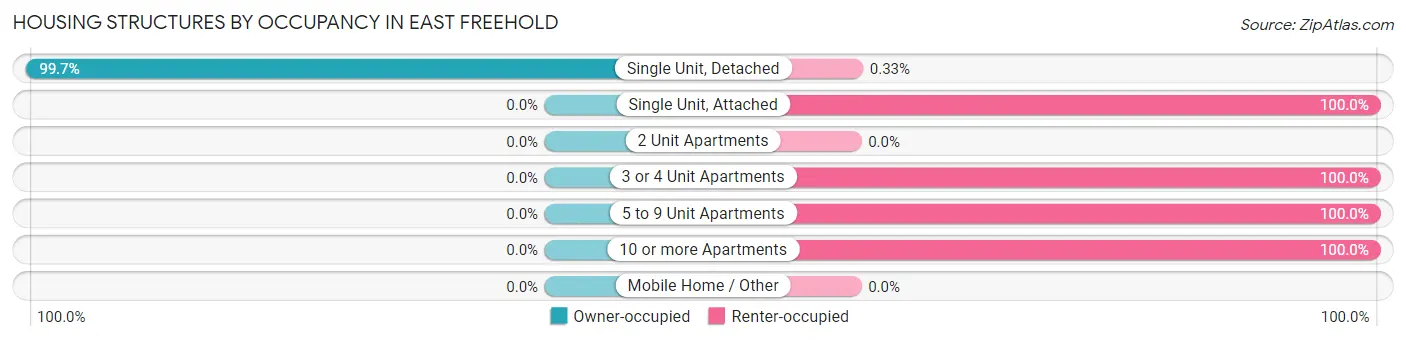
| Structure Type | Owner-occupied | Renter-occupied |
| Single Unit, Detached | 1,491 (99.7%) | 5 (0.3%) |
| Single Unit, Attached | 0 (0.0%) | 24 (100.0%) |
| 2 Unit Apartments | 0 (0.0%) | 0 (0.0%) |
| 3 or 4 Unit Apartments | 0 (0.0%) | 39 (100.0%) |
| 5 to 9 Unit Apartments | 0 (0.0%) | 33 (100.0%) |
| 10 or more Apartments | 0 (0.0%) | 41 (100.0%) |
| Mobile Home / Other | 0 (0.0%) | 0 (0.0%) |
| Total | 1,491 (91.3%) | 142 (8.7%) |
Housing Structures by Number of Rooms in East Freehold
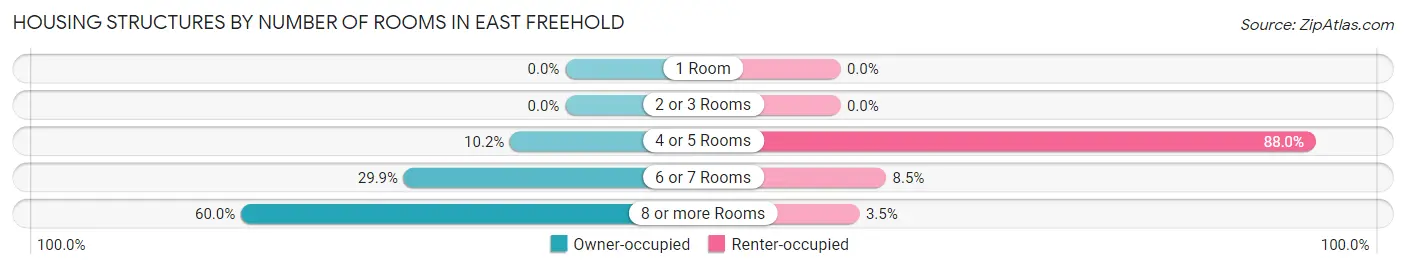
| Number of Rooms | Owner-occupied | Renter-occupied |
| 1 Room | 0 (0.0%) | 0 (0.0%) |
| 2 or 3 Rooms | 0 (0.0%) | 0 (0.0%) |
| 4 or 5 Rooms | 152 (10.2%) | 125 (88.0%) |
| 6 or 7 Rooms | 445 (29.8%) | 12 (8.5%) |
| 8 or more Rooms | 894 (60.0%) | 5 (3.5%) |
| Total | 1,491 (100.0%) | 142 (100.0%) |
Housing Structure by Heating Type in East Freehold
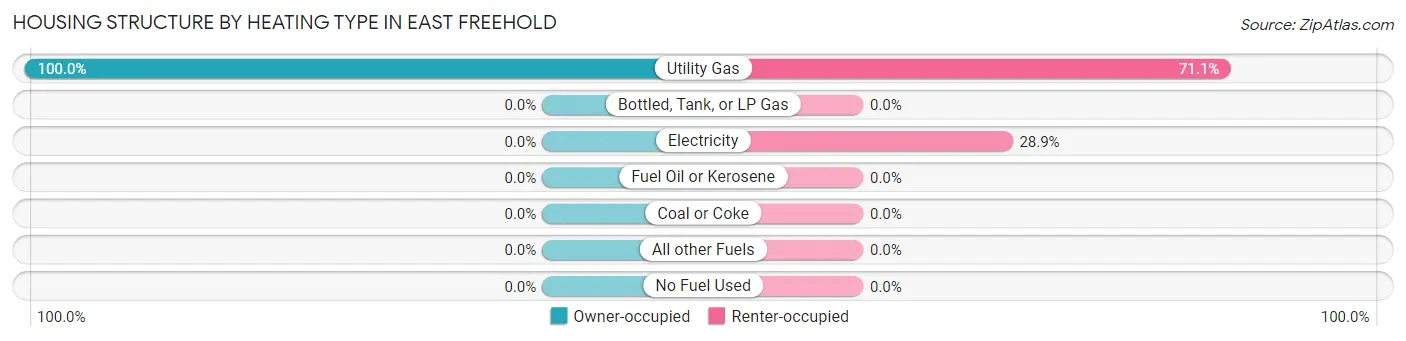
| Heating Type | Owner-occupied | Renter-occupied |
| Utility Gas | 1,491 (100.0%) | 101 (71.1%) |
| Bottled, Tank, or LP Gas | 0 (0.0%) | 0 (0.0%) |
| Electricity | 0 (0.0%) | 41 (28.9%) |
| Fuel Oil or Kerosene | 0 (0.0%) | 0 (0.0%) |
| Coal or Coke | 0 (0.0%) | 0 (0.0%) |
| All other Fuels | 0 (0.0%) | 0 (0.0%) |
| No Fuel Used | 0 (0.0%) | 0 (0.0%) |
| Total | 1,491 (100.0%) | 142 (100.0%) |
Household Vehicle Usage in East Freehold
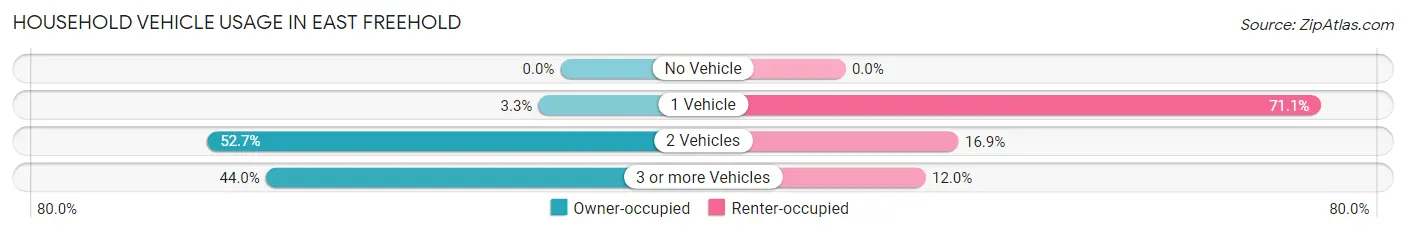
| Vehicles per Household | Owner-occupied | Renter-occupied |
| No Vehicle | 0 (0.0%) | 0 (0.0%) |
| 1 Vehicle | 49 (3.3%) | 101 (71.1%) |
| 2 Vehicles | 786 (52.7%) | 24 (16.9%) |
| 3 or more Vehicles | 656 (44.0%) | 17 (12.0%) |
| Total | 1,491 (100.0%) | 142 (100.0%) |
Real Estate & Mortgages in East Freehold
Real Estate and Mortgage Overview in East Freehold
| Characteristic | Without Mortgage | With Mortgage |
| Housing Units | 279 | 1,212 |
| Median Property Value | $607,300 | $585,900 |
| Median Household Income | $245,341 | $761 |
| Monthly Housing Costs | $1,501 | $775 |
| Real Estate Taxes | $10,001 | $0 |
Property Value by Mortgage Status in East Freehold
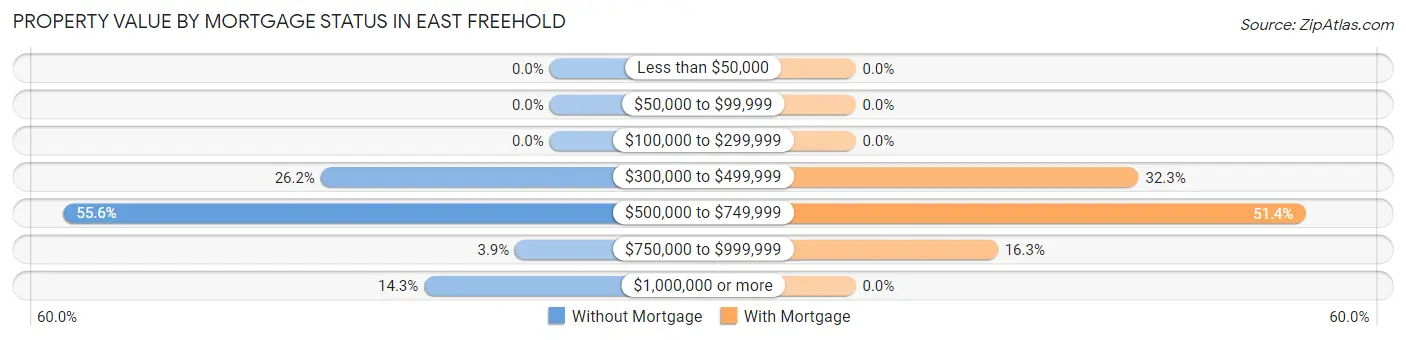
| Property Value | Without Mortgage | With Mortgage |
| Less than $50,000 | 0 (0.0%) | 0 (0.0%) |
| $50,000 to $99,999 | 0 (0.0%) | 0 (0.0%) |
| $100,000 to $299,999 | 0 (0.0%) | 0 (0.0%) |
| $300,000 to $499,999 | 73 (26.2%) | 392 (32.3%) |
| $500,000 to $749,999 | 155 (55.6%) | 623 (51.4%) |
| $750,000 to $999,999 | 11 (3.9%) | 197 (16.3%) |
| $1,000,000 or more | 40 (14.3%) | 0 (0.0%) |
| Total | 279 (100.0%) | 1,212 (100.0%) |
Household Income by Mortgage Status in East Freehold
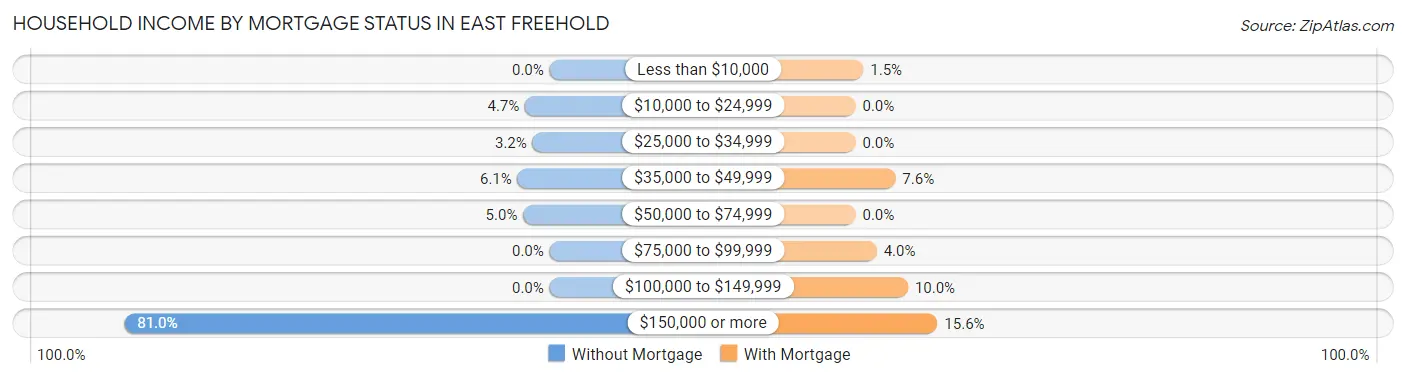
| Household Income | Without Mortgage | With Mortgage |
| Less than $10,000 | 0 (0.0%) | 18 (1.5%) |
| $10,000 to $24,999 | 13 (4.7%) | 0 (0.0%) |
| $25,000 to $34,999 | 9 (3.2%) | 0 (0.0%) |
| $35,000 to $49,999 | 17 (6.1%) | 92 (7.6%) |
| $50,000 to $74,999 | 14 (5.0%) | 0 (0.0%) |
| $75,000 to $99,999 | 0 (0.0%) | 49 (4.0%) |
| $100,000 to $149,999 | 0 (0.0%) | 121 (10.0%) |
| $150,000 or more | 226 (81.0%) | 189 (15.6%) |
| Total | 279 (100.0%) | 1,212 (100.0%) |
Property Value to Household Income Ratio in East Freehold
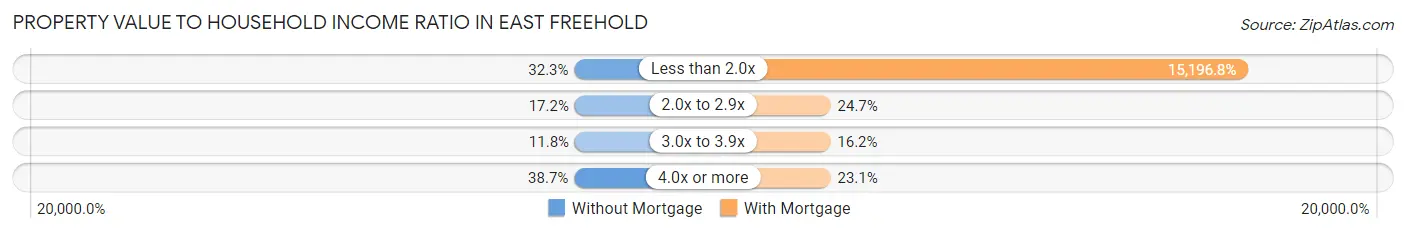
| Value-to-Income Ratio | Without Mortgage | With Mortgage |
| Less than 2.0x | 90 (32.3%) | 184,185 (15,196.8%) |
| 2.0x to 2.9x | 48 (17.2%) | 299 (24.7%) |
| 3.0x to 3.9x | 33 (11.8%) | 196 (16.2%) |
| 4.0x or more | 108 (38.7%) | 280 (23.1%) |
| Total | 279 (100.0%) | 1,212 (100.0%) |
Real Estate Taxes by Mortgage Status in East Freehold
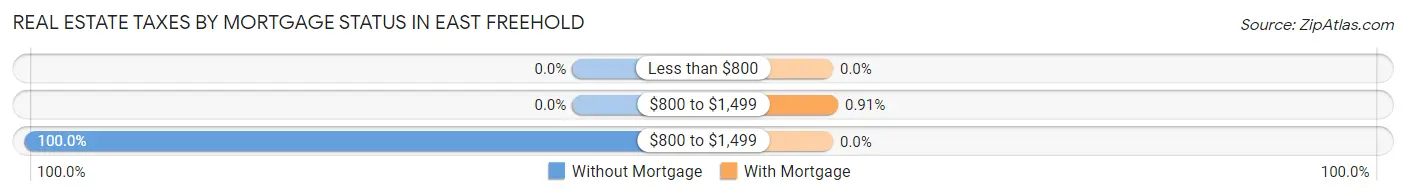
| Property Taxes | Without Mortgage | With Mortgage |
| Less than $800 | 0 (0.0%) | 0 (0.0%) |
| $800 to $1,499 | 0 (0.0%) | 11 (0.9%) |
| $800 to $1,499 | 279 (100.0%) | 0 (0.0%) |
| Total | 279 (100.0%) | 1,212 (100.0%) |
Health & Disability in East Freehold
Health Insurance Coverage by Age in East Freehold
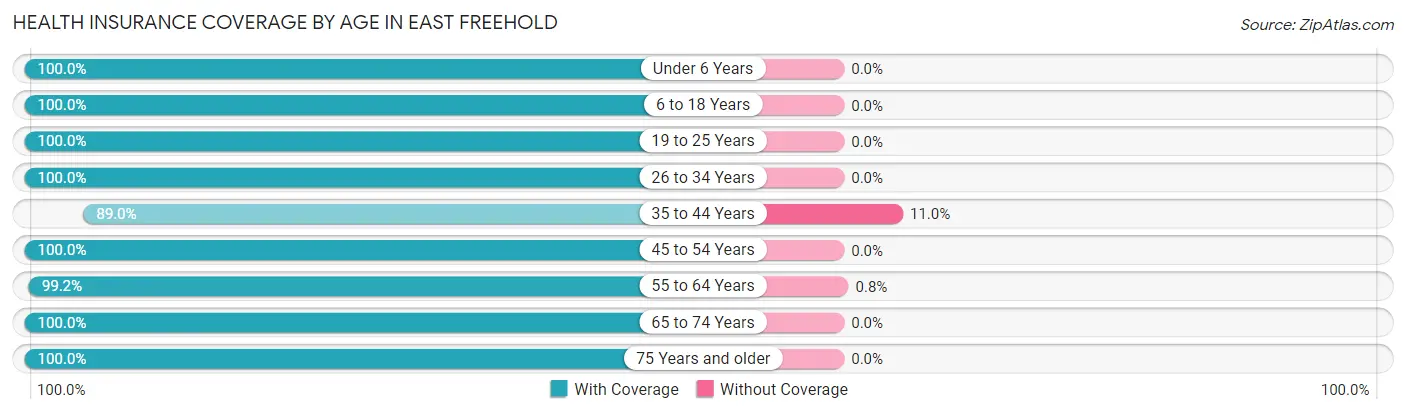
| Age Bracket | With Coverage | Without Coverage |
| Under 6 Years | 421 (100.0%) | 0 (0.0%) |
| 6 to 18 Years | 818 (100.0%) | 0 (0.0%) |
| 19 to 25 Years | 617 (100.0%) | 0 (0.0%) |
| 26 to 34 Years | 420 (100.0%) | 0 (0.0%) |
| 35 to 44 Years | 390 (89.0%) | 48 (11.0%) |
| 45 to 54 Years | 874 (100.0%) | 0 (0.0%) |
| 55 to 64 Years | 989 (99.2%) | 8 (0.8%) |
| 65 to 74 Years | 338 (100.0%) | 0 (0.0%) |
| 75 Years and older | 227 (100.0%) | 0 (0.0%) |
| Total | 5,094 (98.9%) | 56 (1.1%) |
Health Insurance Coverage by Citizenship Status in East Freehold
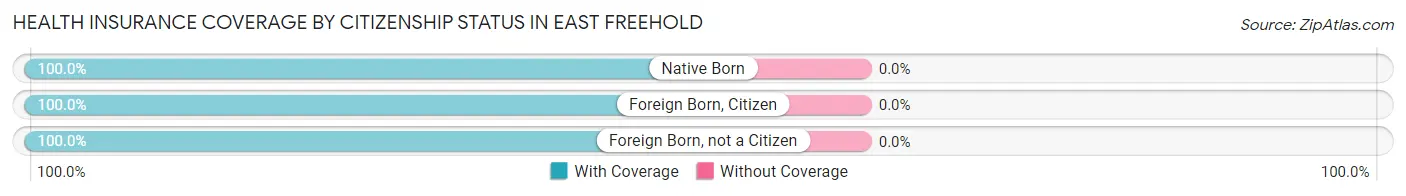
| Citizenship Status | With Coverage | Without Coverage |
| Native Born | 421 (100.0%) | 0 (0.0%) |
| Foreign Born, Citizen | 818 (100.0%) | 0 (0.0%) |
| Foreign Born, not a Citizen | 617 (100.0%) | 0 (0.0%) |
Health Insurance Coverage by Household Income in East Freehold
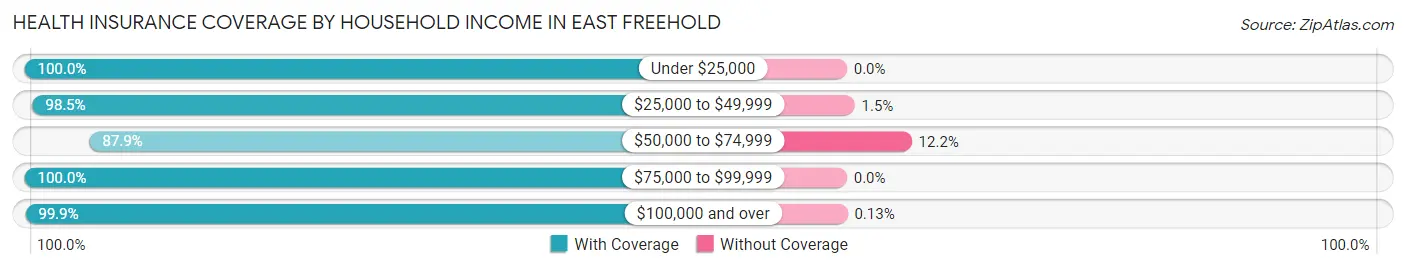
| Household Income | With Coverage | Without Coverage |
| Under $25,000 | 13 (100.0%) | 0 (0.0%) |
| $25,000 to $49,999 | 539 (98.5%) | 8 (1.5%) |
| $50,000 to $74,999 | 311 (87.8%) | 43 (12.1%) |
| $75,000 to $99,999 | 454 (100.0%) | 0 (0.0%) |
| $100,000 and over | 3,777 (99.9%) | 5 (0.1%) |
Public vs Private Health Insurance Coverage by Age in East Freehold
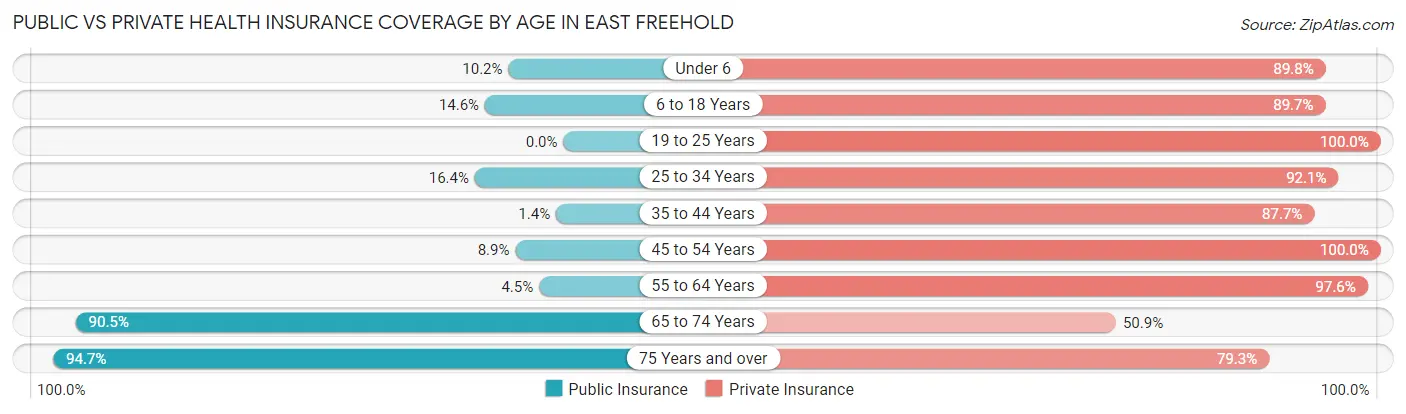
| Age Bracket | Public Insurance | Private Insurance |
| Under 6 | 43 (10.2%) | 378 (89.8%) |
| 6 to 18 Years | 119 (14.5%) | 734 (89.7%) |
| 19 to 25 Years | 0 (0.0%) | 617 (100.0%) |
| 25 to 34 Years | 69 (16.4%) | 387 (92.1%) |
| 35 to 44 Years | 6 (1.4%) | 384 (87.7%) |
| 45 to 54 Years | 78 (8.9%) | 874 (100.0%) |
| 55 to 64 Years | 45 (4.5%) | 973 (97.6%) |
| 65 to 74 Years | 306 (90.5%) | 172 (50.9%) |
| 75 Years and over | 215 (94.7%) | 180 (79.3%) |
| Total | 881 (17.1%) | 4,699 (91.2%) |
Disability Status by Sex by Age in East Freehold
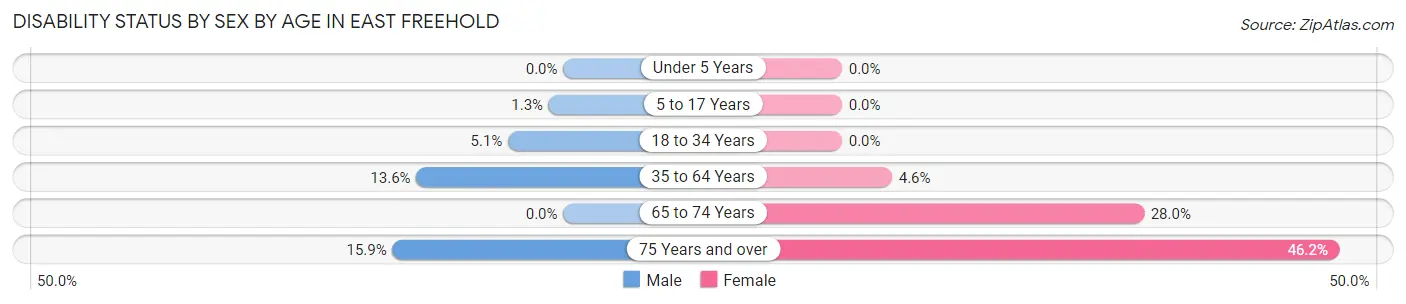
| Age Bracket | Male | Female |
| Under 5 Years | 0 (0.0%) | 0 (0.0%) |
| 5 to 17 Years | 5 (1.3%) | 0 (0.0%) |
| 18 to 34 Years | 36 (5.1%) | 0 (0.0%) |
| 35 to 64 Years | 165 (13.6%) | 51 (4.6%) |
| 65 to 74 Years | 0 (0.0%) | 65 (28.0%) |
| 75 Years and over | 13 (15.9%) | 67 (46.2%) |
Disability Class by Sex by Age in East Freehold
Disability Class: Hearing Difficulty
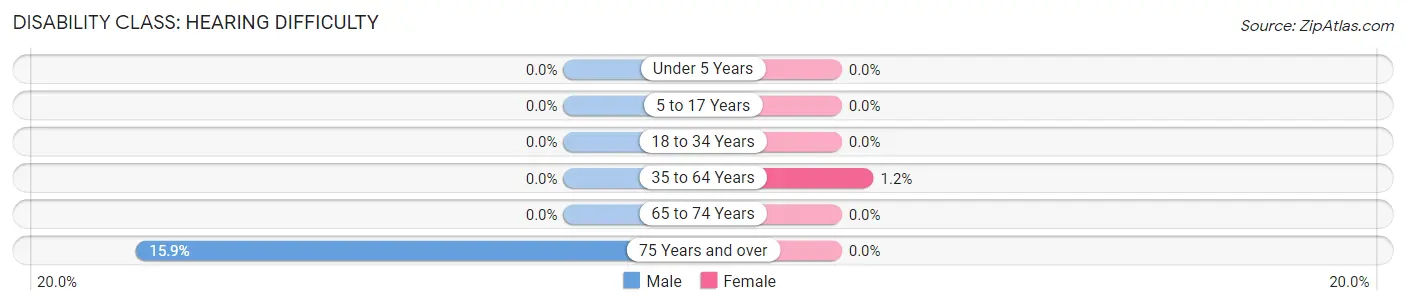
| Age Bracket | Male | Female |
| Under 5 Years | 0 (0.0%) | 0 (0.0%) |
| 5 to 17 Years | 0 (0.0%) | 0 (0.0%) |
| 18 to 34 Years | 0 (0.0%) | 0 (0.0%) |
| 35 to 64 Years | 0 (0.0%) | 13 (1.2%) |
| 65 to 74 Years | 0 (0.0%) | 0 (0.0%) |
| 75 Years and over | 13 (15.9%) | 0 (0.0%) |
Disability Class: Vision Difficulty
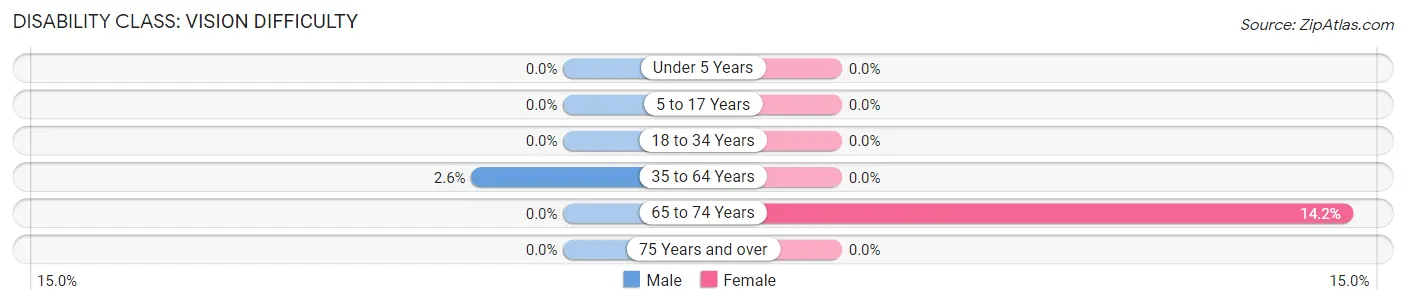
| Age Bracket | Male | Female |
| Under 5 Years | 0 (0.0%) | 0 (0.0%) |
| 5 to 17 Years | 0 (0.0%) | 0 (0.0%) |
| 18 to 34 Years | 0 (0.0%) | 0 (0.0%) |
| 35 to 64 Years | 31 (2.6%) | 0 (0.0%) |
| 65 to 74 Years | 0 (0.0%) | 33 (14.2%) |
| 75 Years and over | 0 (0.0%) | 0 (0.0%) |
Disability Class: Cognitive Difficulty
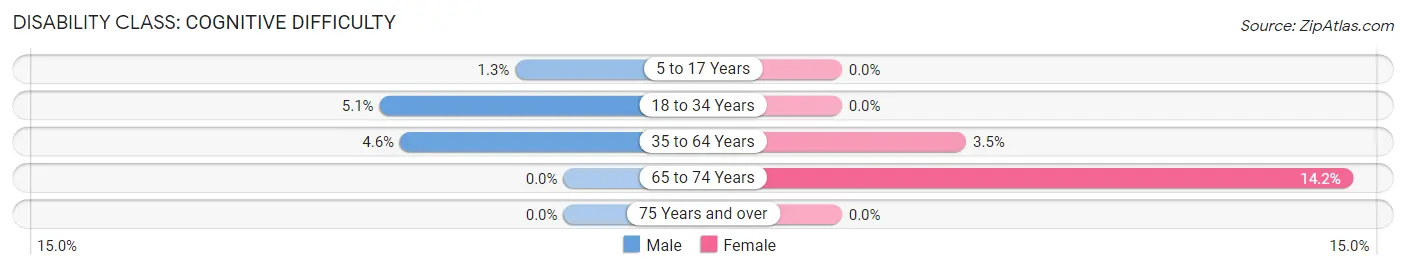
| Age Bracket | Male | Female |
| 5 to 17 Years | 5 (1.3%) | 0 (0.0%) |
| 18 to 34 Years | 36 (5.1%) | 0 (0.0%) |
| 35 to 64 Years | 55 (4.5%) | 38 (3.5%) |
| 65 to 74 Years | 0 (0.0%) | 33 (14.2%) |
| 75 Years and over | 0 (0.0%) | 0 (0.0%) |
Disability Class: Ambulatory Difficulty
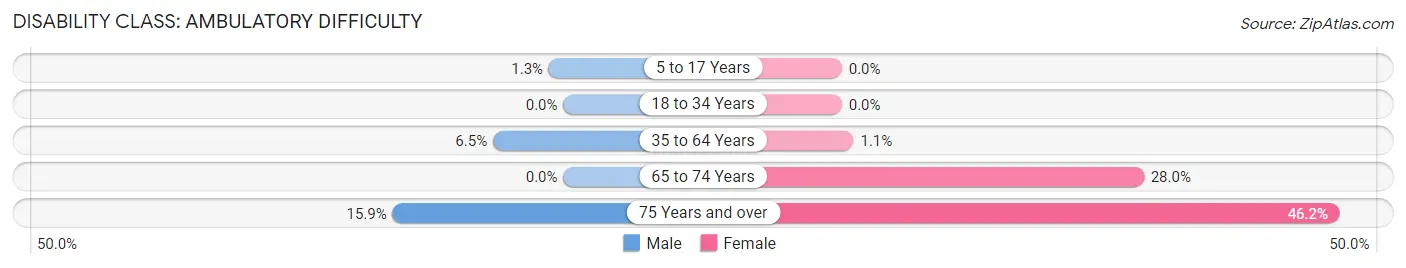
| Age Bracket | Male | Female |
| 5 to 17 Years | 5 (1.3%) | 0 (0.0%) |
| 18 to 34 Years | 0 (0.0%) | 0 (0.0%) |
| 35 to 64 Years | 79 (6.5%) | 12 (1.1%) |
| 65 to 74 Years | 0 (0.0%) | 65 (28.0%) |
| 75 Years and over | 13 (15.9%) | 67 (46.2%) |
Disability Class: Self-Care Difficulty
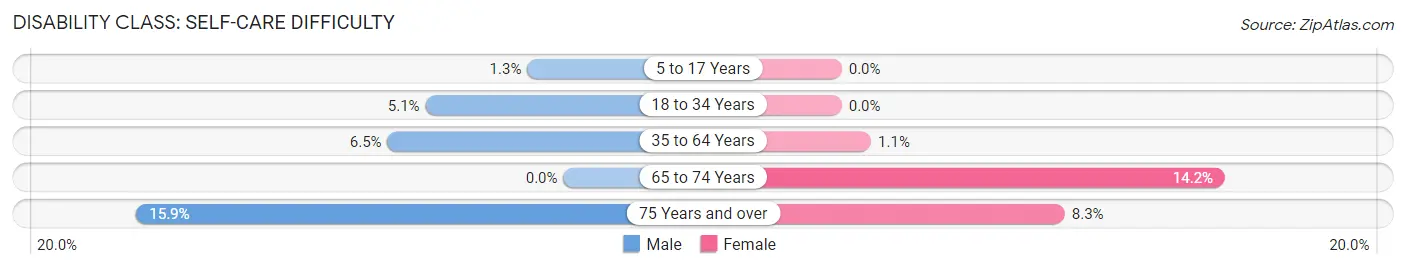
| Age Bracket | Male | Female |
| 5 to 17 Years | 5 (1.3%) | 0 (0.0%) |
| 18 to 34 Years | 36 (5.1%) | 0 (0.0%) |
| 35 to 64 Years | 79 (6.5%) | 12 (1.1%) |
| 65 to 74 Years | 0 (0.0%) | 33 (14.2%) |
| 75 Years and over | 13 (15.9%) | 12 (8.3%) |
Technology Access in East Freehold
Computing Device Access in East Freehold
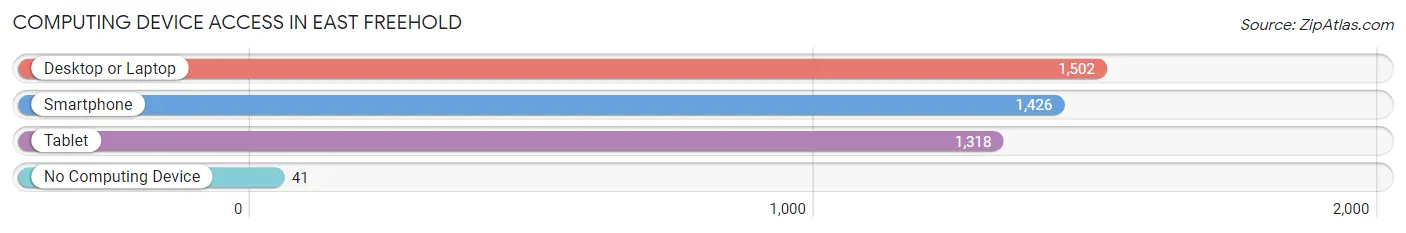
| Device Type | # Households | % Households |
| Desktop or Laptop | 1,502 | 92.0% |
| Smartphone | 1,426 | 87.3% |
| Tablet | 1,318 | 80.7% |
| No Computing Device | 41 | 2.5% |
| Total | 1,633 | 100.0% |
Internet Access in East Freehold
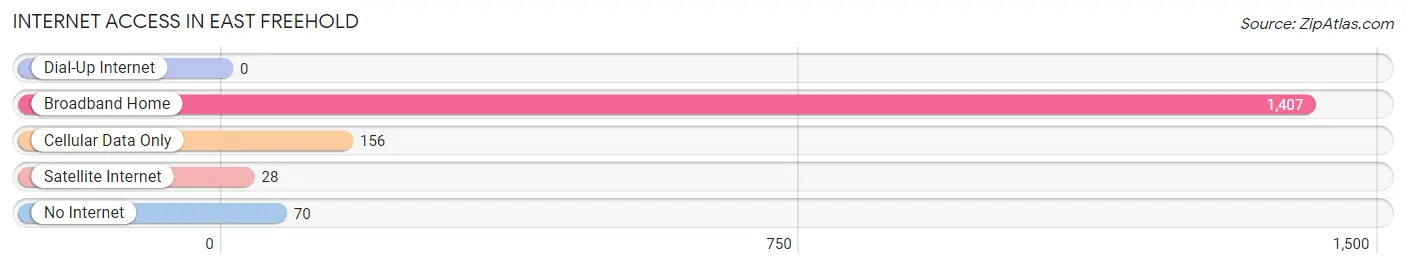
| Internet Type | # Households | % Households |
| Dial-Up Internet | 0 | 0.0% |
| Broadband Home | 1,407 | 86.2% |
| Cellular Data Only | 156 | 9.6% |
| Satellite Internet | 28 | 1.7% |
| No Internet | 70 | 4.3% |
| Total | 1,633 | 100.0% |
East Freehold Summary
Freehold Township is a township located in Monmouth County, New Jersey. It is the county seat of Monmouth County and is located in the heart of the Jersey Shore. The township is home to a population of over 36,000 people, making it the largest municipality in the county.
History
Freehold Township was first settled in 1693 by a group of Dutch and English settlers. The area was originally part of Monmouth County, which was created in 1683. The township was officially incorporated in 1798 and was named after the town of Freehold in England.
The area was a major agricultural center in the 18th and 19th centuries, with many farms and orchards. The township was also home to several mills, including a grist mill, a saw mill, and a paper mill.
In the late 19th century, the area began to experience rapid growth due to the development of the railroad. The railroad allowed for the transportation of goods and people to and from the area, which led to an increase in population and economic activity.
Geography
Freehold Township is located in the heart of the Jersey Shore, approximately 40 miles south of New York City. The township is bordered by Howell Township to the north, Manalapan Township to the east, Marlboro Township to the south, and Millstone Township to the west.
The township is located in the Raritan Valley, which is a low-lying area between the Atlantic Ocean and the Appalachian Mountains. The area is characterized by rolling hills and valleys, with the highest point in the township being the summit of Mount Mitchell, which is located in the western part of the township.
The township is home to several bodies of water, including the Manasquan River, the Metedeconk River, and the Swimming River. The township also contains several parks, including the Freehold Township Park, the Manasquan River Park, and the Monmouth Battlefield State Park.
Economy
Freehold Township is home to a diverse economy, with a variety of industries represented. The township is home to several large employers, including CentraState Medical Center, Freehold Raceway, and the Freehold Raceway Mall.
The township is also home to several smaller businesses, including restaurants, retail stores, and professional services. The township is also home to several technology companies, including the software company, Apptio.
Demographics
As of the 2010 census, the population of Freehold Township was 36,184. The racial makeup of the township was 79.3% White, 11.2% African American, 0.3% Native American, 4.2% Asian, and 4.9% from other races. Hispanic or Latino of any race were 8.7% of the population.
The median household income in the township was $76,837, and the median family income was $90,917. The per capita income was $32,945. About 4.3% of families and 5.7% of the population were below the poverty line.
Freehold Township is home to a variety of religious denominations, including Roman Catholic, Protestant, Jewish, and Muslim. The township is also home to several private schools, including the Freehold Township High School, the Freehold Township Middle School, and the Freehold Township Elementary School.
Common Questions
What is Per Capita Income in East Freehold?
Per Capita income in East Freehold is $61,385.
What is the Median Family Income in East Freehold?
Median Family Income in East Freehold is $191,957.
What is the Median Household income in East Freehold?
Median Household Income in East Freehold is $184,579.
What is Income or Wage Gap in East Freehold?
Income or Wage Gap in East Freehold is 14.5%.
Women in East Freehold earn 85.5 cents for every dollar earned by a man.
What is Inequality or Gini Index in East Freehold?
Inequality or Gini Index in East Freehold is 0.34.
What is the Total Population of East Freehold?
Total Population of East Freehold is 5,150.
What is the Total Male Population of East Freehold?
Total Male Population of East Freehold is 2,796.
What is the Total Female Population of East Freehold?
Total Female Population of East Freehold is 2,354.
What is the Ratio of Males per 100 Females in East Freehold?
There are 118.78 Males per 100 Females in East Freehold.
What is the Ratio of Females per 100 Males in East Freehold?
There are 84.19 Females per 100 Males in East Freehold.
What is the Median Population Age in East Freehold?
Median Population Age in East Freehold is 43.4 Years.
What is the Average Family Size in East Freehold
Average Family Size in East Freehold is 3.4 People.
What is the Average Household Size in East Freehold
Average Household Size in East Freehold is 3.1 People.
How Large is the Labor Force in East Freehold?
There are 3,097 People in the Labor Forcein in East Freehold.
What is the Percentage of People in the Labor Force in East Freehold?
76.1% of People are in the Labor Force in East Freehold.
What is the Unemployment Rate in East Freehold?
Unemployment Rate in East Freehold is 6.0%.