Cities with the Largest Austrian Community in New Jersey
RELATED REPORTS & OPTIONS
Austrian
New Jersey
Compare Cities
Map of Cities with the Largest Austrian Community in New Jersey
0
500
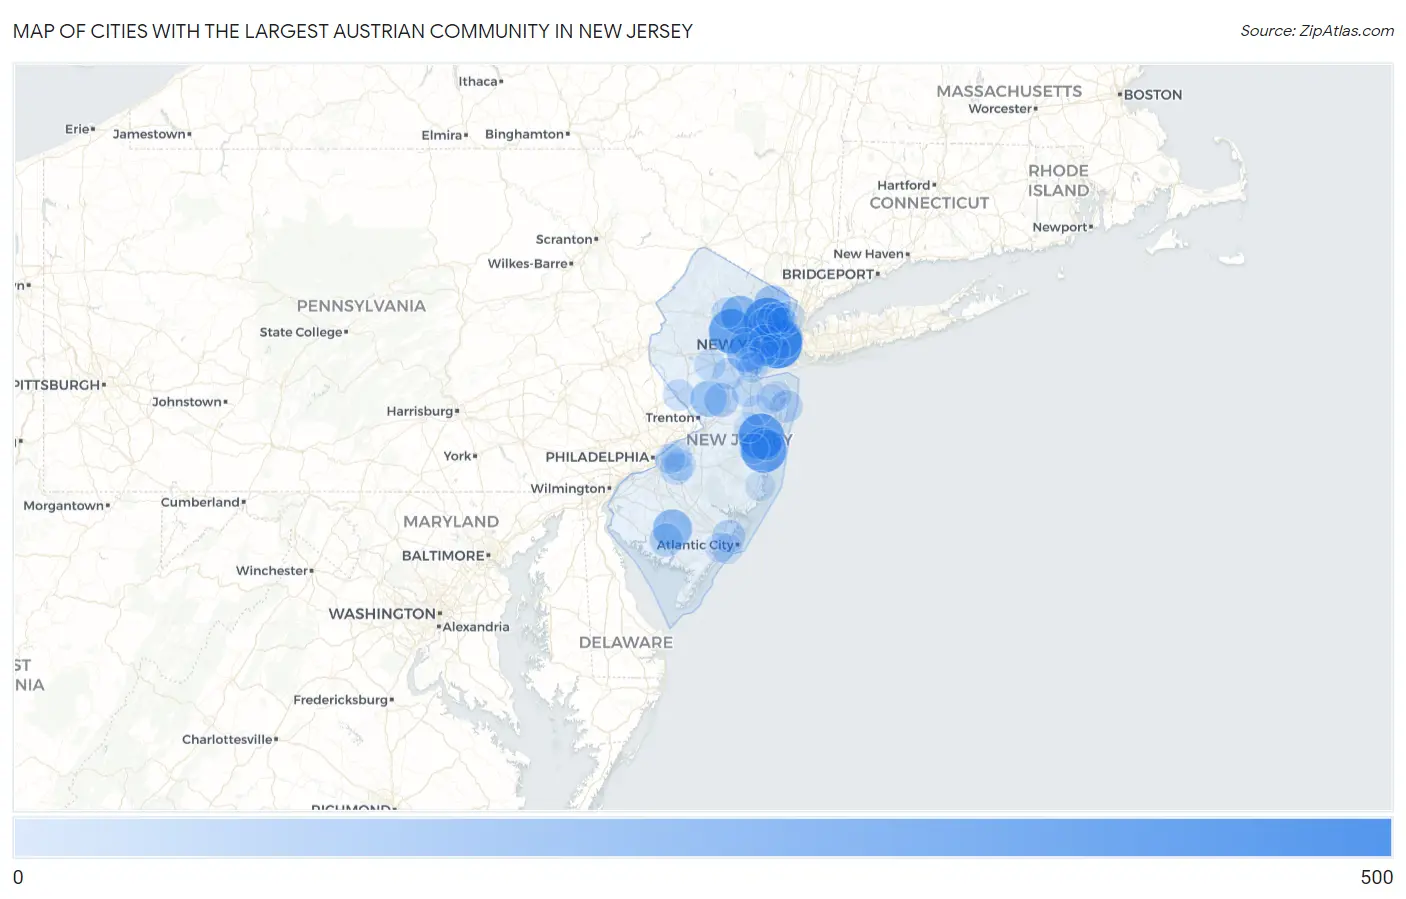
Cities with the Largest Austrian Community in New Jersey
| City | Austrian | vs State | vs National | |
| 1. | Jersey City | 418 | 29,232 (1.43%)#1 | 616,016 (0.07%)#109 |
| 2. | Paramus Borough | 387 | 29,232 (1.32%)#2 | 616,016 (0.06%)#124 |
| 3. | Clifton | 371 | 29,232 (1.27%)#3 | 616,016 (0.06%)#138 |
| 4. | Lakewood | 345 | 29,232 (1.18%)#4 | 616,016 (0.06%)#164 |
| 5. | Toms River | 340 | 29,232 (1.16%)#5 | 616,016 (0.06%)#168 |
| 6. | Morristown | 325 | 29,232 (1.11%)#6 | 616,016 (0.05%)#179 |
| 7. | Ramsey Borough | 292 | 29,232 (1.00%)#7 | 616,016 (0.05%)#218 |
| 8. | Hoboken | 241 | 29,232 (0.82%)#8 | 616,016 (0.04%)#323 |
| 9. | Fair Lawn Borough | 238 | 29,232 (0.81%)#9 | 616,016 (0.04%)#332 |
| 10. | Woodcliff Lake Borough | 225 | 29,232 (0.77%)#10 | 616,016 (0.04%)#362 |
| 11. | Vineland | 221 | 29,232 (0.76%)#11 | 616,016 (0.04%)#375 |
| 12. | Boonton | 221 | 29,232 (0.76%)#12 | 616,016 (0.04%)#376 |
| 13. | Westfield | 214 | 29,232 (0.73%)#13 | 616,016 (0.03%)#398 |
| 14. | Tenafly Borough | 188 | 29,232 (0.64%)#14 | 616,016 (0.03%)#479 |
| 15. | Passaic | 181 | 29,232 (0.62%)#15 | 616,016 (0.03%)#495 |
| 16. | Ridgewood | 178 | 29,232 (0.61%)#16 | 616,016 (0.03%)#507 |
| 17. | Princeton | 173 | 29,232 (0.59%)#17 | 616,016 (0.03%)#527 |
| 18. | Cedar Knolls | 173 | 29,232 (0.59%)#18 | 616,016 (0.03%)#530 |
| 19. | Fort Lee Borough | 171 | 29,232 (0.58%)#19 | 616,016 (0.03%)#536 |
| 20. | Hillsborough | 155 | 29,232 (0.53%)#20 | 616,016 (0.03%)#605 |
| 21. | Point Pleasant Borough | 153 | 29,232 (0.52%)#21 | 616,016 (0.02%)#616 |
| 22. | Eatontown Borough | 151 | 29,232 (0.52%)#22 | 616,016 (0.02%)#631 |
| 23. | Little Ferry Borough | 142 | 29,232 (0.49%)#23 | 616,016 (0.02%)#685 |
| 24. | Oakland Borough | 138 | 29,232 (0.47%)#24 | 616,016 (0.02%)#709 |
| 25. | Princeton Meadows | 135 | 29,232 (0.46%)#25 | 616,016 (0.02%)#719 |
| 26. | Westmont | 131 | 29,232 (0.45%)#26 | 616,016 (0.02%)#736 |
| 27. | Linden | 128 | 29,232 (0.44%)#27 | 616,016 (0.02%)#753 |
| 28. | Sayreville Borough | 125 | 29,232 (0.43%)#28 | 616,016 (0.02%)#780 |
| 29. | Sicklerville | 123 | 29,232 (0.42%)#29 | 616,016 (0.02%)#794 |
| 30. | Franklin Lakes Borough | 123 | 29,232 (0.42%)#30 | 616,016 (0.02%)#796 |
| 31. | Metuchen Borough | 122 | 29,232 (0.42%)#31 | 616,016 (0.02%)#807 |
| 32. | Pine Brook | 121 | 29,232 (0.41%)#32 | 616,016 (0.02%)#820 |
| 33. | Millville | 119 | 29,232 (0.41%)#33 | 616,016 (0.02%)#835 |
| 34. | Hillsdale Borough | 117 | 29,232 (0.40%)#34 | 616,016 (0.02%)#853 |
| 35. | Brookdale | 114 | 29,232 (0.39%)#35 | 616,016 (0.02%)#873 |
| 36. | Absecon | 113 | 29,232 (0.39%)#36 | 616,016 (0.02%)#884 |
| 37. | Bernardsville Borough | 113 | 29,232 (0.39%)#37 | 616,016 (0.02%)#886 |
| 38. | Haddon Heights Borough | 110 | 29,232 (0.38%)#38 | 616,016 (0.02%)#912 |
| 39. | Clearbrook | 110 | 29,232 (0.38%)#39 | 616,016 (0.02%)#914 |
| 40. | Cresskill Borough | 107 | 29,232 (0.37%)#40 | 616,016 (0.02%)#943 |
| 41. | Newark | 106 | 29,232 (0.36%)#41 | 616,016 (0.02%)#946 |
| 42. | Long Branch | 104 | 29,232 (0.36%)#42 | 616,016 (0.02%)#977 |
| 43. | Highland Park Borough | 104 | 29,232 (0.36%)#43 | 616,016 (0.02%)#981 |
| 44. | Englewood | 100 | 29,232 (0.34%)#44 | 616,016 (0.02%)#1,023 |
| 45. | Springdale | 100 | 29,232 (0.34%)#45 | 616,016 (0.02%)#1,033 |
| 46. | Middlesex Borough | 100 | 29,232 (0.34%)#46 | 616,016 (0.02%)#1,034 |
| 47. | Pompton Plains | 98 | 29,232 (0.34%)#47 | 616,016 (0.02%)#1,058 |
| 48. | Hawthorne Borough | 96 | 29,232 (0.33%)#48 | 616,016 (0.02%)#1,081 |
| 49. | Haddonfield Borough | 90 | 29,232 (0.31%)#49 | 616,016 (0.01%)#1,144 |
| 50. | Bayonne | 88 | 29,232 (0.30%)#50 | 616,016 (0.01%)#1,172 |
| 51. | Somerset | 88 | 29,232 (0.30%)#51 | 616,016 (0.01%)#1,176 |
| 52. | Glen Rock Borough | 87 | 29,232 (0.30%)#52 | 616,016 (0.01%)#1,194 |
| 53. | Upper Saddle River Borough | 86 | 29,232 (0.29%)#53 | 616,016 (0.01%)#1,211 |
| 54. | Summit | 85 | 29,232 (0.29%)#54 | 616,016 (0.01%)#1,220 |
| 55. | Demarest Borough | 85 | 29,232 (0.29%)#55 | 616,016 (0.01%)#1,223 |
| 56. | Lambertville | 85 | 29,232 (0.29%)#56 | 616,016 (0.01%)#1,224 |
| 57. | Old Bridge | 84 | 29,232 (0.29%)#57 | 616,016 (0.01%)#1,231 |
| 58. | Marlton | 84 | 29,232 (0.29%)#58 | 616,016 (0.01%)#1,237 |
| 59. | Ringwood Borough | 82 | 29,232 (0.28%)#59 | 616,016 (0.01%)#1,275 |
| 60. | Moorestown Lenola | 80 | 29,232 (0.27%)#60 | 616,016 (0.01%)#1,301 |
| 61. | Bradley Gardens | 80 | 29,232 (0.27%)#61 | 616,016 (0.01%)#1,302 |
| 62. | Rumson Borough | 80 | 29,232 (0.27%)#62 | 616,016 (0.01%)#1,306 |
| 63. | South River Borough | 79 | 29,232 (0.27%)#63 | 616,016 (0.01%)#1,321 |
| 64. | Pines Lake | 79 | 29,232 (0.27%)#64 | 616,016 (0.01%)#1,325 |
| 65. | Westwood Borough | 76 | 29,232 (0.26%)#65 | 616,016 (0.01%)#1,374 |
| 66. | Flanders | 76 | 29,232 (0.26%)#66 | 616,016 (0.01%)#1,376 |
| 67. | Bloomingdale Borough | 76 | 29,232 (0.26%)#67 | 616,016 (0.01%)#1,377 |
| 68. | Somerville Borough | 75 | 29,232 (0.26%)#68 | 616,016 (0.01%)#1,386 |
| 69. | White Meadow Lake | 75 | 29,232 (0.26%)#69 | 616,016 (0.01%)#1,387 |
| 70. | Leisure Village East | 73 | 29,232 (0.25%)#70 | 616,016 (0.01%)#1,432 |
| 71. | Bergenfield Borough | 72 | 29,232 (0.25%)#71 | 616,016 (0.01%)#1,441 |
| 72. | South Plainfield Borough | 71 | 29,232 (0.24%)#72 | 616,016 (0.01%)#1,457 |
| 73. | East Freehold | 71 | 29,232 (0.24%)#73 | 616,016 (0.01%)#1,464 |
| 74. | Stonebridge | 70 | 29,232 (0.24%)#74 | 616,016 (0.01%)#1,486 |
| 75. | Caldwell Borough | 69 | 29,232 (0.24%)#75 | 616,016 (0.01%)#1,509 |
| 76. | Glen Ridge Borough | 69 | 29,232 (0.24%)#76 | 616,016 (0.01%)#1,511 |
| 77. | Fairview | 69 | 29,232 (0.24%)#77 | 616,016 (0.01%)#1,515 |
| 78. | Garfield | 68 | 29,232 (0.23%)#78 | 616,016 (0.01%)#1,520 |
| 79. | Dunellen Borough | 68 | 29,232 (0.23%)#79 | 616,016 (0.01%)#1,528 |
| 80. | Margate City | 67 | 29,232 (0.23%)#80 | 616,016 (0.01%)#1,560 |
| 81. | Hackensack | 66 | 29,232 (0.23%)#81 | 616,016 (0.01%)#1,565 |
| 82. | Glassboro Borough | 65 | 29,232 (0.22%)#82 | 616,016 (0.01%)#1,596 |
| 83. | Kinnelon Borough | 65 | 29,232 (0.22%)#83 | 616,016 (0.01%)#1,603 |
| 84. | Cherry Hill Mall | 63 | 29,232 (0.22%)#84 | 616,016 (0.01%)#1,651 |
| 85. | East Rutherford Borough | 63 | 29,232 (0.22%)#85 | 616,016 (0.01%)#1,655 |
| 86. | Woodbridge | 62 | 29,232 (0.21%)#86 | 616,016 (0.01%)#1,673 |
| 87. | Ridgefield Park | 62 | 29,232 (0.21%)#87 | 616,016 (0.01%)#1,682 |
| 88. | Linwood | 62 | 29,232 (0.21%)#88 | 616,016 (0.01%)#1,692 |
| 89. | Bogota Borough | 61 | 29,232 (0.21%)#89 | 616,016 (0.01%)#1,712 |
| 90. | Point Pleasant Beach Borough | 61 | 29,232 (0.21%)#90 | 616,016 (0.01%)#1,716 |
| 91. | Leisure Village West | 61 | 29,232 (0.21%)#91 | 616,016 (0.01%)#1,718 |
| 92. | Monmouth Beach Borough | 61 | 29,232 (0.21%)#92 | 616,016 (0.01%)#1,720 |
| 93. | Elizabeth | 60 | 29,232 (0.21%)#93 | 616,016 (0.01%)#1,722 |
| 94. | Lake Hopatcong | 60 | 29,232 (0.21%)#94 | 616,016 (0.01%)#1,740 |
| 95. | Montvale Borough | 60 | 29,232 (0.21%)#95 | 616,016 (0.01%)#1,741 |
| 96. | Lincroft | 60 | 29,232 (0.21%)#96 | 616,016 (0.01%)#1,742 |
| 97. | Barnegat | 60 | 29,232 (0.21%)#97 | 616,016 (0.01%)#1,744 |
| 98. | Vista Center | 60 | 29,232 (0.21%)#98 | 616,016 (0.01%)#1,746 |
| 99. | Colonia | 58 | 29,232 (0.20%)#99 | 616,016 (0.01%)#1,784 |
| 100. | North Caldwell Borough | 57 | 29,232 (0.19%)#100 | 616,016 (0.01%)#1,823 |
Common Questions
What are the Top 10 Cities with the Largest Austrian Community in New Jersey?
Top 10 Cities with the Largest Austrian Community in New Jersey are:
#1
418
#2
371
#3
345
#4
340
#5
325
#6
241
#7
221
#8
221
#9
214
#10
181
What city has the Largest Austrian Community in New Jersey?
Jersey City has the Largest Austrian Community in New Jersey with 418.
What is the Total Austrian Population in the State of New Jersey?
Total Austrian Population in New Jersey is 29,232.
What is the Total Austrian Population in the United States?
Total Austrian Population in the United States is 616,016.