Cities with the Largest Blackfeet Community in New Jersey
RELATED REPORTS & OPTIONS
Blackfeet
New Jersey
Compare Cities
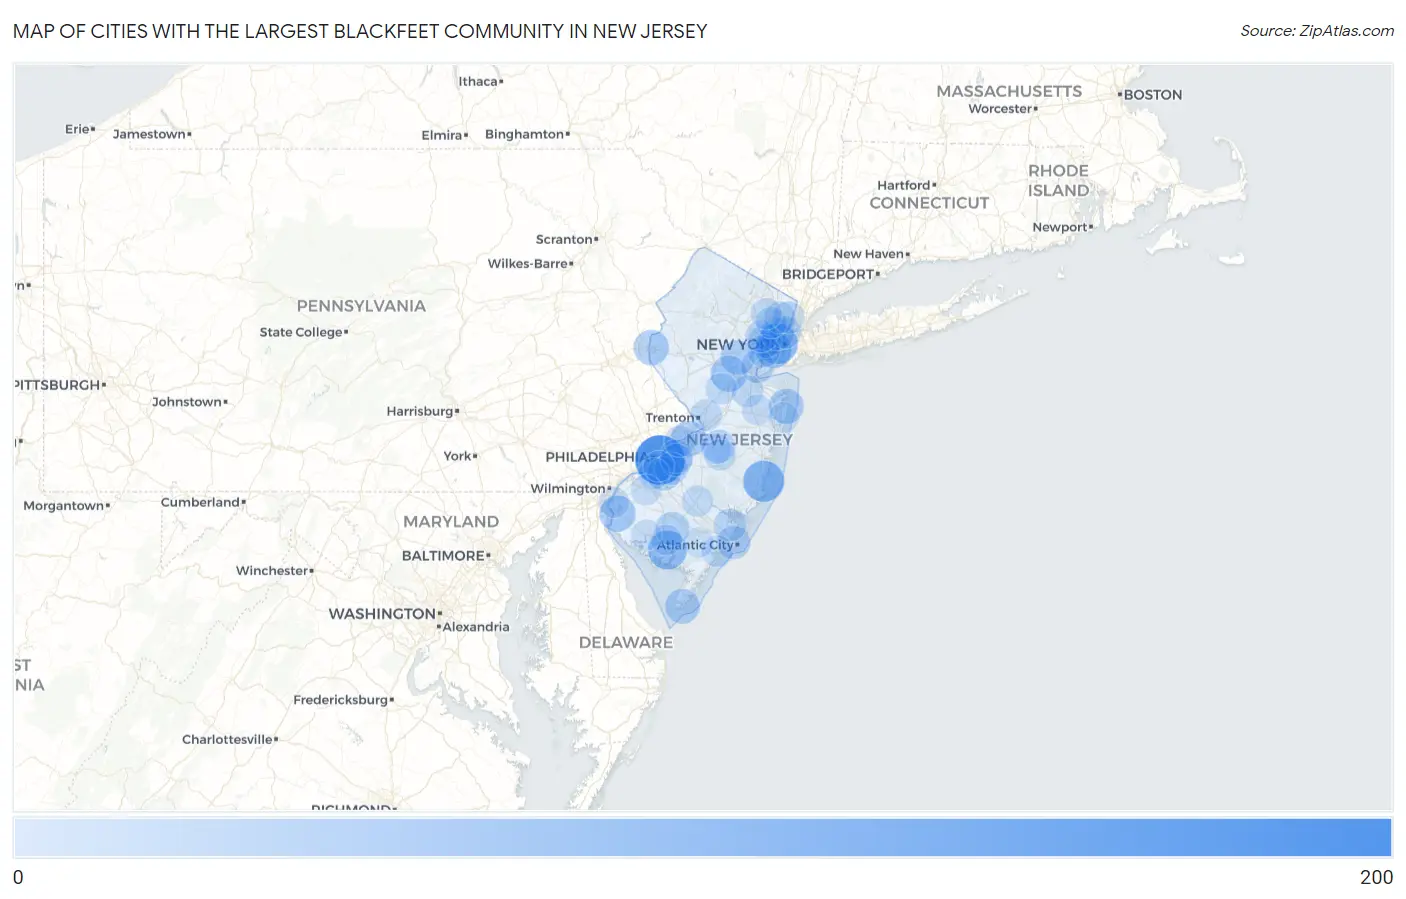
Map of Cities with the Largest Blackfeet Community in New Jersey
0
200
Cities with the Largest Blackfeet Community in New Jersey
| City | Blackfeet | vs State | vs National | |
| 1. | Camden | 187 | 2,701(6.92%)#1 | 203,870(0.09%)#157 |
| 2. | Jamesburg Borough | 110 | 2,701(4.07%)#2 | 203,870(0.05%)#304 |
| 3. | Waretown | 104 | 2,701(3.85%)#3 | 203,870(0.05%)#321 |
| 4. | Jersey City | 99 | 2,701(3.67%)#4 | 203,870(0.05%)#333 |
| 5. | Tinton Falls Borough | 96 | 2,701(3.55%)#5 | 203,870(0.05%)#353 |
| 6. | Laurel Lake | 83 | 2,701(3.07%)#6 | 203,870(0.04%)#418 |
| 7. | Oak Ridge | 68 | 2,701(2.52%)#7 | 203,870(0.03%)#523 |
| 8. | Bayonne | 59 | 2,701(2.18%)#8 | 203,870(0.03%)#588 |
| 9. | Salem | 56 | 2,701(2.07%)#9 | 203,870(0.03%)#633 |
| 10. | Somerset | 55 | 2,701(2.04%)#10 | 203,870(0.03%)#642 |
| 11. | Burlington | 52 | 2,701(1.93%)#11 | 203,870(0.03%)#688 |
| 12. | New Milford Borough | 50 | 2,701(1.85%)#12 | 203,870(0.02%)#721 |
| 13. | Phillipsburg | 49 | 2,701(1.81%)#13 | 203,870(0.02%)#738 |
| 14. | Long Branch | 46 | 2,701(1.70%)#14 | 203,870(0.02%)#774 |
| 15. | Haledon Borough | 43 | 2,701(1.59%)#15 | 203,870(0.02%)#830 |
| 16. | Cape May | 43 | 2,701(1.59%)#16 | 203,870(0.02%)#835 |
| 17. | Plainfield | 39 | 2,701(1.44%)#17 | 203,870(0.02%)#902 |
| 18. | Hopatcong Borough | 39 | 2,701(1.44%)#18 | 203,870(0.02%)#910 |
| 19. | Vineland | 36 | 2,701(1.33%)#19 | 203,870(0.02%)#978 |
| 20. | Glendora | 32 | 2,701(1.18%)#20 | 203,870(0.02%)#1,085 |
| 21. | Newark | 31 | 2,701(1.15%)#21 | 203,870(0.02%)#1,090 |
| 22. | Atlantic City | 30 | 2,701(1.11%)#22 | 203,870(0.01%)#1,121 |
| 23. | Moorestown Lenola | 29 | 2,701(1.07%)#23 | 203,870(0.01%)#1,149 |
| 24. | Port Reading | 28 | 2,701(1.04%)#24 | 203,870(0.01%)#1,181 |
| 25. | Netcong Borough | 28 | 2,701(1.04%)#25 | 203,870(0.01%)#1,182 |
| 26. | Metuchen Borough | 27 | 2,701(1.00%)#26 | 203,870(0.01%)#1,202 |
| 27. | Mcguire Afb | 26 | 2,701(0.96%)#27 | 203,870(0.01%)#1,245 |
| 28. | Glassboro Borough | 25 | 2,701(0.93%)#28 | 203,870(0.01%)#1,274 |
| 29. | Secaucus | 25 | 2,701(0.93%)#29 | 203,870(0.01%)#1,276 |
| 30. | Sicklerville | 24 | 2,701(0.89%)#30 | 203,870(0.01%)#1,296 |
| 31. | Ashland | 24 | 2,701(0.89%)#31 | 203,870(0.01%)#1,313 |
| 32. | Smithville | 23 | 2,701(0.85%)#32 | 203,870(0.01%)#1,353 |
| 33. | Guttenberg | 21 | 2,701(0.78%)#33 | 203,870(0.01%)#1,438 |
| 34. | Oceanport Borough | 21 | 2,701(0.78%)#34 | 203,870(0.01%)#1,442 |
| 35. | Elizabeth | 20 | 2,701(0.74%)#35 | 203,870(0.01%)#1,453 |
| 36. | Ramblewood | 20 | 2,701(0.74%)#36 | 203,870(0.01%)#1,483 |
| 37. | Englewood | 18 | 2,701(0.67%)#37 | 203,870(0.01%)#1,576 |
| 38. | East Orange | 16 | 2,701(0.59%)#38 | 203,870(0.01%)#1,685 |
| 39. | Old Bridge | 16 | 2,701(0.59%)#39 | 203,870(0.01%)#1,695 |
| 40. | Mercerville | 16 | 2,701(0.59%)#40 | 203,870(0.01%)#1,705 |
| 41. | Island Heights Borough | 15 | 2,701(0.56%)#41 | 203,870(0.01%)#1,807 |
| 42. | Hackensack | 14 | 2,701(0.52%)#42 | 203,870(0.01%)#1,837 |
| 43. | Westmont | 14 | 2,701(0.52%)#43 | 203,870(0.01%)#1,862 |
| 44. | Somers Point | 13 | 2,701(0.48%)#44 | 203,870(0.01%)#1,934 |
| 45. | Passaic | 12 | 2,701(0.44%)#45 | 203,870(0.01%)#1,976 |
| 46. | Ramsey Borough | 12 | 2,701(0.44%)#46 | 203,870(0.01%)#2,011 |
| 47. | Kendall Park | 12 | 2,701(0.44%)#47 | 203,870(0.01%)#2,015 |
| 48. | Hightstown Borough | 12 | 2,701(0.44%)#48 | 203,870(0.01%)#2,031 |
| 49. | Manville Borough | 11 | 2,701(0.41%)#49 | 203,870(0.01%)#2,115 |
| 50. | Beverly | 11 | 2,701(0.41%)#50 | 203,870(0.01%)#2,154 |
| 51. | Paterson | 10 | 2,701(0.37%)#51 | 203,870(0.00%)#2,190 |
| 52. | Browns Mills | 10 | 2,701(0.37%)#52 | 203,870(0.00%)#2,242 |
| 53. | Kinnelon Borough | 10 | 2,701(0.37%)#53 | 203,870(0.00%)#2,243 |
| 54. | Woodbury | 10 | 2,701(0.37%)#54 | 203,870(0.00%)#2,244 |
| 55. | Audubon Borough | 10 | 2,701(0.37%)#55 | 203,870(0.00%)#2,247 |
| 56. | Lindenwold Borough | 9 | 2,701(0.33%)#56 | 203,870(0.00%)#2,342 |
| 57. | Fairview Borough | 9 | 2,701(0.33%)#57 | 203,870(0.00%)#2,356 |
| 58. | Hammonton | 9 | 2,701(0.33%)#58 | 203,870(0.00%)#2,358 |
| 59. | South Toms River Borough | 9 | 2,701(0.33%)#59 | 203,870(0.00%)#2,391 |
| 60. | Bergenfield Borough | 8 | 2,701(0.30%)#60 | 203,870(0.00%)#2,464 |
| 61. | Roselle Borough | 8 | 2,701(0.30%)#61 | 203,870(0.00%)#2,475 |
| 62. | Fieldsboro Borough | 8 | 2,701(0.30%)#62 | 203,870(0.00%)#2,578 |
| 63. | Richland | 8 | 2,701(0.30%)#63 | 203,870(0.00%)#2,584 |
| 64. | Mullica Hill | 7 | 2,701(0.26%)#64 | 203,870(0.00%)#2,677 |
| 65. | Millville | 6 | 2,701(0.22%)#65 | 203,870(0.00%)#2,756 |
| 66. | Bridgeton | 6 | 2,701(0.22%)#66 | 203,870(0.00%)#2,757 |
| 67. | Pennsville | 6 | 2,701(0.22%)#67 | 203,870(0.00%)#2,778 |
| 68. | East Freehold | 6 | 2,701(0.22%)#68 | 203,870(0.00%)#2,805 |
| 69. | Gloucester City | 5 | 2,701(0.19%)#69 | 203,870(0.00%)#2,944 |
| 70. | Fort Dix | 5 | 2,701(0.19%)#70 | 203,870(0.00%)#2,955 |
| 71. | Allenhurst Borough | 5 | 2,701(0.19%)#71 | 203,870(0.00%)#3,045 |
| 72. | Oakland Borough | 3 | 2,701(0.11%)#72 | 203,870(0.00%)#3,294 |
| 73. | Caldwell Borough | 3 | 2,701(0.11%)#73 | 203,870(0.00%)#3,305 |
| 74. | Franklin Borough | 3 | 2,701(0.11%)#74 | 203,870(0.00%)#3,323 |
| 75. | Asbury Park | 2 | 2,701(0.07%)#75 | 203,870(0.00%)#3,506 |
| 76. | Gouldtown | 2 | 2,701(0.07%)#76 | 203,870(0.00%)#3,569 |
| 77. | Rainbow Lakes | 2 | 2,701(0.07%)#77 | 203,870(0.00%)#3,602 |
| 78. | Ogdensburg Borough | 1 | 2,701(0.04%)#78 | 203,870(0.00%)#3,815 |
| 79. | Estell Manor | 1 | 2,701(0.04%)#79 | 203,870(0.00%)#3,828 |
Common Questions
What are the Top 10 Cities with the Largest Blackfeet Community in New Jersey?
Top 10 Cities with the Largest Blackfeet Community in New Jersey are:
#1
187
#2
104
#3
99
#4
83
#5
59
#6
56
#7
55
#8
52
#9
49
#10
46
What city has the Largest Blackfeet Community in New Jersey?
Camden has the Largest Blackfeet Community in New Jersey with 187.
What is the Total Blackfeet Population in the State of New Jersey?
Total Blackfeet Population in New Jersey is 2,701.
What is the Total Blackfeet Population in the United States?
Total Blackfeet Population in the United States is 203,870.