Cities with the Highest Percentage of Immigrants from Poland in New Jersey
RELATED REPORTS & OPTIONS
Poland
New Jersey
Compare Cities
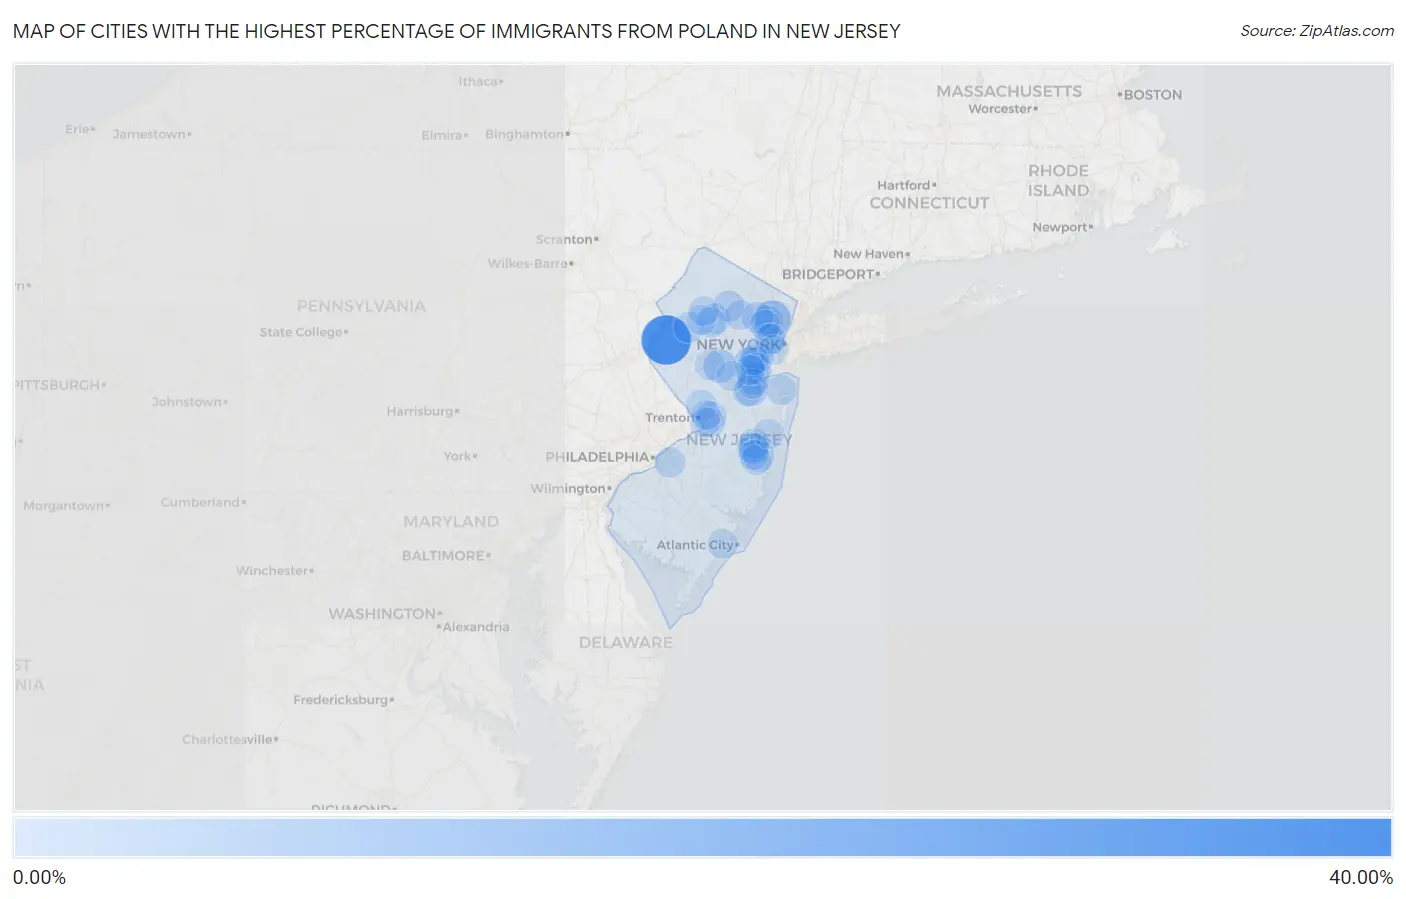
Map of Cities with the Highest Percentage of Immigrants from Poland in New Jersey
0.00%
40.00%
Cities with the Highest Percentage of Immigrants from Poland in New Jersey
| City | Poland | vs State | vs National | |
| 1. | Broadway | 32.43% | 0.53%(+31.9)#1 | 0.12%(+32.3)#2 |
| 2. | Wallington Borough | 24.82% | 0.53%(+24.3)#2 | 0.12%(+24.7)#3 |
| 3. | Garfield | 11.25% | 0.53%(+10.7)#3 | 0.12%(+11.1)#13 |
| 4. | Richland | 10.04% | 0.53%(+9.51)#4 | 0.12%(+9.92)#17 |
| 5. | Tavistock Borough | 8.33% | 0.53%(+7.81)#5 | 0.12%(+8.21)#23 |
| 6. | Finderne | 6.16% | 0.53%(+5.63)#6 | 0.12%(+6.03)#38 |
| 7. | Cape May Point Borough | 5.81% | 0.53%(+5.28)#7 | 0.12%(+5.68)#42 |
| 8. | Fieldsboro Borough | 5.60% | 0.53%(+5.07)#8 | 0.12%(+5.48)#46 |
| 9. | Carlstadt Borough | 4.62% | 0.53%(+4.09)#9 | 0.12%(+4.50)#59 |
| 10. | Brownville | 4.49% | 0.53%(+3.96)#10 | 0.12%(+4.37)#63 |
| 11. | Elmwood Park Borough | 4.27% | 0.53%(+3.74)#11 | 0.12%(+4.14)#66 |
| 12. | Upper Greenwood Lake | 4.24% | 0.53%(+3.71)#12 | 0.12%(+4.12)#67 |
| 13. | South Amboy | 4.17% | 0.53%(+3.64)#13 | 0.12%(+4.04)#69 |
| 14. | Linden | 4.14% | 0.53%(+3.61)#14 | 0.12%(+4.01)#72 |
| 15. | East Rutherford Borough | 3.96% | 0.53%(+3.43)#15 | 0.12%(+3.84)#77 |
| 16. | Clifton | 3.44% | 0.53%(+2.92)#16 | 0.12%(+3.32)#89 |
| 17. | Singac | 3.20% | 0.53%(+2.67)#17 | 0.12%(+3.07)#98 |
| 18. | Macopin | 3.17% | 0.53%(+2.65)#18 | 0.12%(+3.05)#100 |
| 19. | Pines Lake | 3.10% | 0.53%(+2.57)#19 | 0.12%(+2.97)#104 |
| 20. | Colonia | 3.06% | 0.53%(+2.53)#20 | 0.12%(+2.94)#105 |
| 21. | Lake Telemark | 3.00% | 0.53%(+2.47)#21 | 0.12%(+2.87)#109 |
| 22. | Silver Ridge | 2.92% | 0.53%(+2.39)#22 | 0.12%(+2.79)#117 |
| 23. | Englishtown Borough | 2.68% | 0.53%(+2.15)#23 | 0.12%(+2.55)#129 |
| 24. | Sayreville Borough | 2.40% | 0.53%(+1.87)#24 | 0.12%(+2.28)#152 |
| 25. | Manville Borough | 2.33% | 0.53%(+1.80)#25 | 0.12%(+2.21)#157 |
| 26. | Kenilworth Borough | 2.23% | 0.53%(+1.70)#26 | 0.12%(+2.11)#161 |
| 27. | Kenvil | 2.20% | 0.53%(+1.67)#27 | 0.12%(+2.08)#163 |
| 28. | Beattystown | 2.16% | 0.53%(+1.63)#28 | 0.12%(+2.04)#165 |
| 29. | Leisure Knoll | 2.14% | 0.53%(+1.61)#29 | 0.12%(+2.01)#168 |
| 30. | Sewaren | 2.12% | 0.53%(+1.59)#30 | 0.12%(+1.99)#170 |
| 31. | Millstone Borough | 2.05% | 0.53%(+1.53)#31 | 0.12%(+1.93)#176 |
| 32. | Cedar Glen West | 2.01% | 0.53%(+1.48)#32 | 0.12%(+1.89)#178 |
| 33. | Leisure Village West | 1.99% | 0.53%(+1.46)#33 | 0.12%(+1.87)#180 |
| 34. | The Ponds | 1.96% | 0.53%(+1.44)#34 | 0.12%(+1.84)#185 |
| 35. | Watchung Borough | 1.95% | 0.53%(+1.42)#35 | 0.12%(+1.82)#186 |
| 36. | Renaissance At Monroe | 1.88% | 0.53%(+1.35)#36 | 0.12%(+1.76)#194 |
| 37. | North Arlington Borough | 1.87% | 0.53%(+1.34)#37 | 0.12%(+1.74)#196 |
| 38. | Ellisburg | 1.86% | 0.53%(+1.33)#38 | 0.12%(+1.74)#197 |
| 39. | South River Borough | 1.77% | 0.53%(+1.24)#39 | 0.12%(+1.65)#206 |
| 40. | Brookside | 1.69% | 0.53%(+1.16)#40 | 0.12%(+1.57)#227 |
| 41. | Lawrenceville | 1.62% | 0.53%(+1.10)#41 | 0.12%(+1.50)#233 |
| 42. | Lodi Borough | 1.61% | 0.53%(+1.09)#42 | 0.12%(+1.49)#235 |
| 43. | Clearbrook | 1.61% | 0.53%(+1.09)#43 | 0.12%(+1.49)#236 |
| 44. | Hamilton Square | 1.53% | 0.53%(+1.00)#44 | 0.12%(+1.41)#249 |
| 45. | Hillsborough | 1.51% | 0.53%(+0.986)#45 | 0.12%(+1.39)#252 |
| 46. | Avenel | 1.46% | 0.53%(+0.936)#46 | 0.12%(+1.34)#257 |
| 47. | Fair Lawn Borough | 1.46% | 0.53%(+0.932)#47 | 0.12%(+1.34)#259 |
| 48. | Old Bridge | 1.43% | 0.53%(+0.900)#48 | 0.12%(+1.30)#267 |
| 49. | Liberty Corner | 1.42% | 0.53%(+0.894)#49 | 0.12%(+1.30)#270 |
| 50. | Holiday Heights | 1.42% | 0.53%(+0.888)#50 | 0.12%(+1.29)#272 |
| 51. | Oakland Borough | 1.41% | 0.53%(+0.886)#51 | 0.12%(+1.29)#274 |
| 52. | Harrison | 1.41% | 0.53%(+0.877)#52 | 0.12%(+1.28)#280 |
| 53. | Succasunna | 1.40% | 0.53%(+0.875)#53 | 0.12%(+1.28)#281 |
| 54. | Deal Borough | 1.40% | 0.53%(+0.868)#54 | 0.12%(+1.27)#282 |
| 55. | Neshanic Station | 1.37% | 0.53%(+0.845)#55 | 0.12%(+1.25)#289 |
| 56. | Andover Borough | 1.34% | 0.53%(+0.811)#56 | 0.12%(+1.22)#294 |
| 57. | Woodland Park Borough | 1.31% | 0.53%(+0.781)#57 | 0.12%(+1.19)#297 |
| 58. | Emerson Borough | 1.30% | 0.53%(+0.777)#58 | 0.12%(+1.18)#300 |
| 59. | Madison Park | 1.30% | 0.53%(+0.775)#59 | 0.12%(+1.18)#301 |
| 60. | Bedminster | 1.23% | 0.53%(+0.699)#60 | 0.12%(+1.10)#319 |
| 61. | Navesink | 1.22% | 0.53%(+0.688)#61 | 0.12%(+1.09)#325 |
| 62. | Cranford | 1.22% | 0.53%(+0.688)#62 | 0.12%(+1.09)#326 |
| 63. | Somerdale Borough | 1.21% | 0.53%(+0.685)#63 | 0.12%(+1.09)#328 |
| 64. | Brookdale | 1.21% | 0.53%(+0.684)#64 | 0.12%(+1.09)#329 |
| 65. | Bradley Gardens | 1.19% | 0.53%(+0.664)#65 | 0.12%(+1.07)#336 |
| 66. | Kearny | 1.19% | 0.53%(+0.658)#66 | 0.12%(+1.06)#342 |
| 67. | Rutherford Borough | 1.16% | 0.53%(+0.635)#67 | 0.12%(+1.04)#348 |
| 68. | Bridgewater Center | 1.13% | 0.53%(+0.602)#68 | 0.12%(+1.01)#352 |
| 69. | Pompton Lakes Borough | 1.10% | 0.53%(+0.576)#69 | 0.12%(+0.980)#363 |
| 70. | Rahway | 1.10% | 0.53%(+0.575)#70 | 0.12%(+0.979)#364 |
| 71. | Yardville | 1.09% | 0.53%(+0.565)#71 | 0.12%(+0.969)#367 |
| 72. | Wrightstown Borough | 1.07% | 0.53%(+0.543)#72 | 0.12%(+0.947)#376 |
| 73. | Oak Ridge | 1.06% | 0.53%(+0.536)#73 | 0.12%(+0.940)#379 |
| 74. | Fords | 1.06% | 0.53%(+0.530)#74 | 0.12%(+0.935)#386 |
| 75. | Franklin Lakes Borough | 1.05% | 0.53%(+0.526)#75 | 0.12%(+0.930)#392 |
| 76. | Dunellen Borough | 1.05% | 0.53%(+0.525)#76 | 0.12%(+0.929)#393 |
| 77. | North Caldwell Borough | 1.04% | 0.53%(+0.514)#77 | 0.12%(+0.918)#395 |
| 78. | Kinnelon Borough | 1.04% | 0.53%(+0.514)#78 | 0.12%(+0.918)#396 |
| 79. | Northfield | 1.03% | 0.53%(+0.504)#79 | 0.12%(+0.908)#399 |
| 80. | Spotswood Borough | 1.02% | 0.53%(+0.492)#80 | 0.12%(+0.897)#403 |
| 81. | Mountainside Borough | 1.02% | 0.53%(+0.488)#81 | 0.12%(+0.892)#404 |
| 82. | Garwood Borough | 1.01% | 0.53%(+0.485)#82 | 0.12%(+0.889)#406 |
| 83. | Ringwood Borough | 0.98% | 0.53%(+0.456)#83 | 0.12%(+0.860)#417 |
| 84. | Boonton | 0.98% | 0.53%(+0.452)#84 | 0.12%(+0.856)#419 |
| 85. | Butler Borough | 0.97% | 0.53%(+0.442)#85 | 0.12%(+0.846)#424 |
| 86. | Budd Lake | 0.93% | 0.53%(+0.404)#86 | 0.12%(+0.808)#441 |
| 87. | Helmetta Borough | 0.91% | 0.53%(+0.385)#87 | 0.12%(+0.789)#447 |
| 88. | Holiday City Berkeley | 0.91% | 0.53%(+0.382)#88 | 0.12%(+0.786)#449 |
| 89. | Mountain Lakes Borough | 0.89% | 0.53%(+0.361)#89 | 0.12%(+0.766)#453 |
| 90. | White Horse | 0.88% | 0.53%(+0.349)#90 | 0.12%(+0.754)#455 |
| 91. | Union | 0.87% | 0.53%(+0.347)#91 | 0.12%(+0.751)#458 |
| 92. | South Bound Brook Borough | 0.87% | 0.53%(+0.340)#92 | 0.12%(+0.745)#463 |
| 93. | Mercerville | 0.84% | 0.53%(+0.308)#93 | 0.12%(+0.712)#478 |
| 94. | Ramtown | 0.83% | 0.53%(+0.302)#94 | 0.12%(+0.707)#482 |
| 95. | Bayonne | 0.82% | 0.53%(+0.294)#95 | 0.12%(+0.698)#485 |
| 96. | Byram Center | 0.81% | 0.53%(+0.285)#96 | 0.12%(+0.689)#492 |
| 97. | Hopatcong Borough | 0.81% | 0.53%(+0.284)#97 | 0.12%(+0.688)#493 |
| 98. | Lincoln Park Borough | 0.81% | 0.53%(+0.281)#98 | 0.12%(+0.685)#496 |
| 99. | East Franklin | 0.79% | 0.53%(+0.267)#99 | 0.12%(+0.671)#502 |
| 100. | Bound Brook Borough | 0.79% | 0.53%(+0.262)#100 | 0.12%(+0.666)#504 |
Common Questions
What are the Top 10 Cities with the Highest Percentage of Immigrants from Poland in New Jersey?
Top 10 Cities with the Highest Percentage of Immigrants from Poland in New Jersey are:
#1
32.43%
#2
11.25%
#3
6.16%
#4
4.49%
#5
4.17%
#6
4.14%
#7
3.44%
#8
3.20%
#9
3.06%
#10
3.00%
What city has the Highest Percentage of Immigrants from Poland in New Jersey?
Broadway has the Highest Percentage of Immigrants from Poland in New Jersey with 32.43%.
What is the Percentage of Immigrants from Poland in the State of New Jersey?
Percentage of Immigrants from Poland in New Jersey is 0.53%.
What is the Percentage of Immigrants from Poland in the United States?
Percentage of Immigrants from Poland in the United States is 0.12%.