Cities with the Most Immigrants from Thailand in New Jersey
RELATED REPORTS & OPTIONS
Thailand
New Jersey
Compare Cities
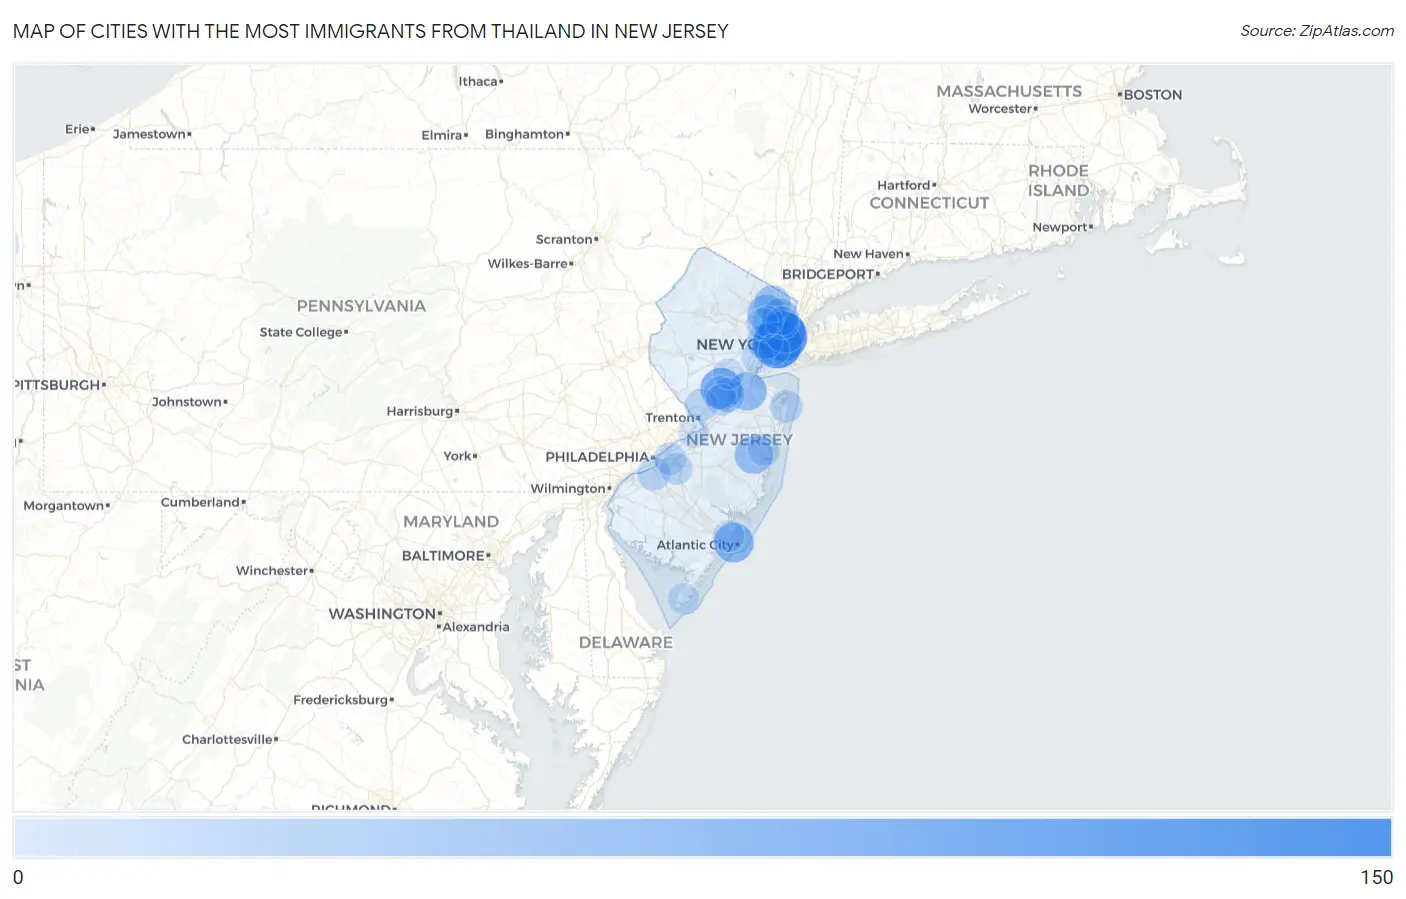
Map of Cities with the Most Immigrants from Thailand in New Jersey
0
150
Cities with the Most Immigrants from Thailand in New Jersey
| City | Thailand | vs State | vs National | |
| 1. | Union City | 124 | 2,903(4.27%)#1 | 256,546(0.05%)#331 |
| 2. | Jersey City | 122 | 2,903(4.20%)#2 | 256,546(0.05%)#336 |
| 3. | East Rutherford Borough | 105 | 2,903(3.62%)#3 | 256,546(0.04%)#411 |
| 4. | Fairview Borough | 76 | 2,903(2.62%)#4 | 256,546(0.03%)#566 |
| 5. | Kendall Park | 74 | 2,903(2.55%)#5 | 256,546(0.03%)#583 |
| 6. | West New York | 69 | 2,903(2.38%)#6 | 256,546(0.03%)#609 |
| 7. | Dumont Borough | 68 | 2,903(2.34%)#7 | 256,546(0.03%)#620 |
| 8. | Atlantic City | 62 | 2,903(2.14%)#8 | 256,546(0.02%)#678 |
| 9. | North Arlington Borough | 60 | 2,903(2.07%)#9 | 256,546(0.02%)#708 |
| 10. | Cresskill Borough | 59 | 2,903(2.03%)#10 | 256,546(0.02%)#737 |
| 11. | Rutherford Borough | 56 | 2,903(1.93%)#11 | 256,546(0.02%)#757 |
| 12. | Old Bridge | 53 | 2,903(1.83%)#12 | 256,546(0.02%)#796 |
| 13. | North Haledon Borough | 53 | 2,903(1.83%)#13 | 256,546(0.02%)#802 |
| 14. | Carlstadt Borough | 51 | 2,903(1.76%)#14 | 256,546(0.02%)#828 |
| 15. | Holiday City Berkeley | 50 | 2,903(1.72%)#15 | 256,546(0.02%)#842 |
| 16. | Paterson | 49 | 2,903(1.69%)#16 | 256,546(0.02%)#844 |
| 17. | Fair Lawn Borough | 46 | 2,903(1.58%)#17 | 256,546(0.02%)#886 |
| 18. | Hackensack | 44 | 2,903(1.52%)#18 | 256,546(0.02%)#914 |
| 19. | Somerville Borough | 44 | 2,903(1.52%)#19 | 256,546(0.02%)#922 |
| 20. | Ridgewood | 40 | 2,903(1.38%)#20 | 256,546(0.02%)#986 |
| 21. | Newark | 34 | 2,903(1.17%)#21 | 256,546(0.01%)#1,096 |
| 22. | Ramsey Borough | 27 | 2,903(0.93%)#22 | 256,546(0.01%)#1,290 |
| 23. | Dayton | 27 | 2,903(0.93%)#23 | 256,546(0.01%)#1,293 |
| 24. | Manville Borough | 23 | 2,903(0.79%)#24 | 256,546(0.01%)#1,441 |
| 25. | Tenafly Borough | 22 | 2,903(0.76%)#25 | 256,546(0.01%)#1,484 |
| 26. | Woodland Park Borough | 20 | 2,903(0.69%)#26 | 256,546(0.01%)#1,557 |
| 27. | Woodbury | 19 | 2,903(0.65%)#27 | 256,546(0.01%)#1,608 |
| 28. | Haledon Borough | 19 | 2,903(0.65%)#28 | 256,546(0.01%)#1,610 |
| 29. | Ridgefield Park | 17 | 2,903(0.59%)#29 | 256,546(0.01%)#1,694 |
| 30. | Lawrenceville | 17 | 2,903(0.59%)#30 | 256,546(0.01%)#1,709 |
| 31. | Long Branch | 16 | 2,903(0.55%)#31 | 256,546(0.01%)#1,737 |
| 32. | Heathcote | 16 | 2,903(0.55%)#32 | 256,546(0.01%)#1,764 |
| 33. | Eatontown Borough | 15 | 2,903(0.52%)#33 | 256,546(0.01%)#1,801 |
| 34. | Cherry Hill Mall | 15 | 2,903(0.52%)#34 | 256,546(0.01%)#1,803 |
| 35. | Waldwick Borough | 15 | 2,903(0.52%)#35 | 256,546(0.01%)#1,810 |
| 36. | Maywood Borough | 15 | 2,903(0.52%)#36 | 256,546(0.01%)#1,811 |
| 37. | Haddonfield Borough | 14 | 2,903(0.48%)#37 | 256,546(0.01%)#1,866 |
| 38. | Ledgewood | 14 | 2,903(0.48%)#38 | 256,546(0.01%)#1,879 |
| 39. | Toms River | 13 | 2,903(0.45%)#39 | 256,546(0.01%)#1,895 |
| 40. | Linden | 13 | 2,903(0.45%)#40 | 256,546(0.01%)#1,902 |
| 41. | Springdale | 13 | 2,903(0.45%)#41 | 256,546(0.01%)#1,920 |
| 42. | Kenilworth Borough | 13 | 2,903(0.45%)#42 | 256,546(0.01%)#1,935 |
| 43. | Sussex Borough | 12 | 2,903(0.41%)#43 | 256,546(0.00%)#2,022 |
| 44. | Upper Montclair | 11 | 2,903(0.38%)#44 | 256,546(0.00%)#2,069 |
| 45. | Glen Rock Borough | 11 | 2,903(0.38%)#45 | 256,546(0.00%)#2,070 |
| 46. | Oak Ridge | 11 | 2,903(0.38%)#46 | 256,546(0.00%)#2,071 |
| 47. | Absecon | 11 | 2,903(0.38%)#47 | 256,546(0.00%)#2,076 |
| 48. | Woodlynne Borough | 11 | 2,903(0.38%)#48 | 256,546(0.00%)#2,096 |
| 49. | Princeton Meadows | 10 | 2,903(0.34%)#49 | 256,546(0.00%)#2,143 |
| 50. | Rumson Borough | 10 | 2,903(0.34%)#50 | 256,546(0.00%)#2,159 |
| 51. | Bridgewater Center | 10 | 2,903(0.34%)#51 | 256,546(0.00%)#2,167 |
| 52. | Saddle River Borough | 10 | 2,903(0.34%)#52 | 256,546(0.00%)#2,179 |
| 53. | Erma | 9 | 2,903(0.31%)#53 | 256,546(0.00%)#2,272 |
| 54. | Parsippany | 8 | 2,903(0.28%)#54 | 256,546(0.00%)#2,302 |
| 55. | Upper Saddle River Borough | 8 | 2,903(0.28%)#55 | 256,546(0.00%)#2,324 |
| 56. | Avon By The Sea Borough | 8 | 2,903(0.28%)#56 | 256,546(0.00%)#2,352 |
| 57. | Clifton | 7 | 2,903(0.24%)#57 | 256,546(0.00%)#2,367 |
| 58. | Bayonne | 7 | 2,903(0.24%)#58 | 256,546(0.00%)#2,371 |
| 59. | Watsessing | 7 | 2,903(0.24%)#59 | 256,546(0.00%)#2,406 |
| 60. | Landing | 6 | 2,903(0.21%)#60 | 256,546(0.00%)#2,511 |
| 61. | Somerset | 5 | 2,903(0.17%)#61 | 256,546(0.00%)#2,571 |
| 62. | Chatham Borough | 5 | 2,903(0.17%)#62 | 256,546(0.00%)#2,594 |
| 63. | Englishtown Borough | 5 | 2,903(0.17%)#63 | 256,546(0.00%)#2,617 |
| 64. | Florence | 4 | 2,903(0.14%)#64 | 256,546(0.00%)#2,664 |
| 65. | Cookstown | 4 | 2,903(0.14%)#65 | 256,546(0.00%)#2,704 |
| 66. | Hi Nella Borough | 3 | 2,903(0.10%)#66 | 256,546(0.00%)#2,777 |
| 67. | Frenchtown Borough | 2 | 2,903(0.07%)#67 | 256,546(0.00%)#2,837 |
| 68. | Millstone Borough | 1 | 2,903(0.03%)#68 | 256,546(0.00%)#2,963 |
Common Questions
What are the Top 10 Cities with the Most Immigrants from Thailand in New Jersey?
Top 10 Cities with the Most Immigrants from Thailand in New Jersey are:
#1
124
#2
122
#3
74
#4
69
#5
62
#6
53
#7
50
#8
49
#9
44
#10
40
What city has the Most Immigrants from Thailand in New Jersey?
Union City has the Most Immigrants from Thailand in New Jersey with 124.
What is the Total Immigrants from Thailand in the State of New Jersey?
Total Immigrants from Thailand in New Jersey is 2,903.
What is the Total Immigrants from Thailand in the United States?
Total Immigrants from Thailand in the United States is 256,546.