Cities with the Highest Poverty Level Among Families in New Jersey
RELATED REPORTS & OPTIONS
Highest Family Poverty
New Jersey
Compare Cities
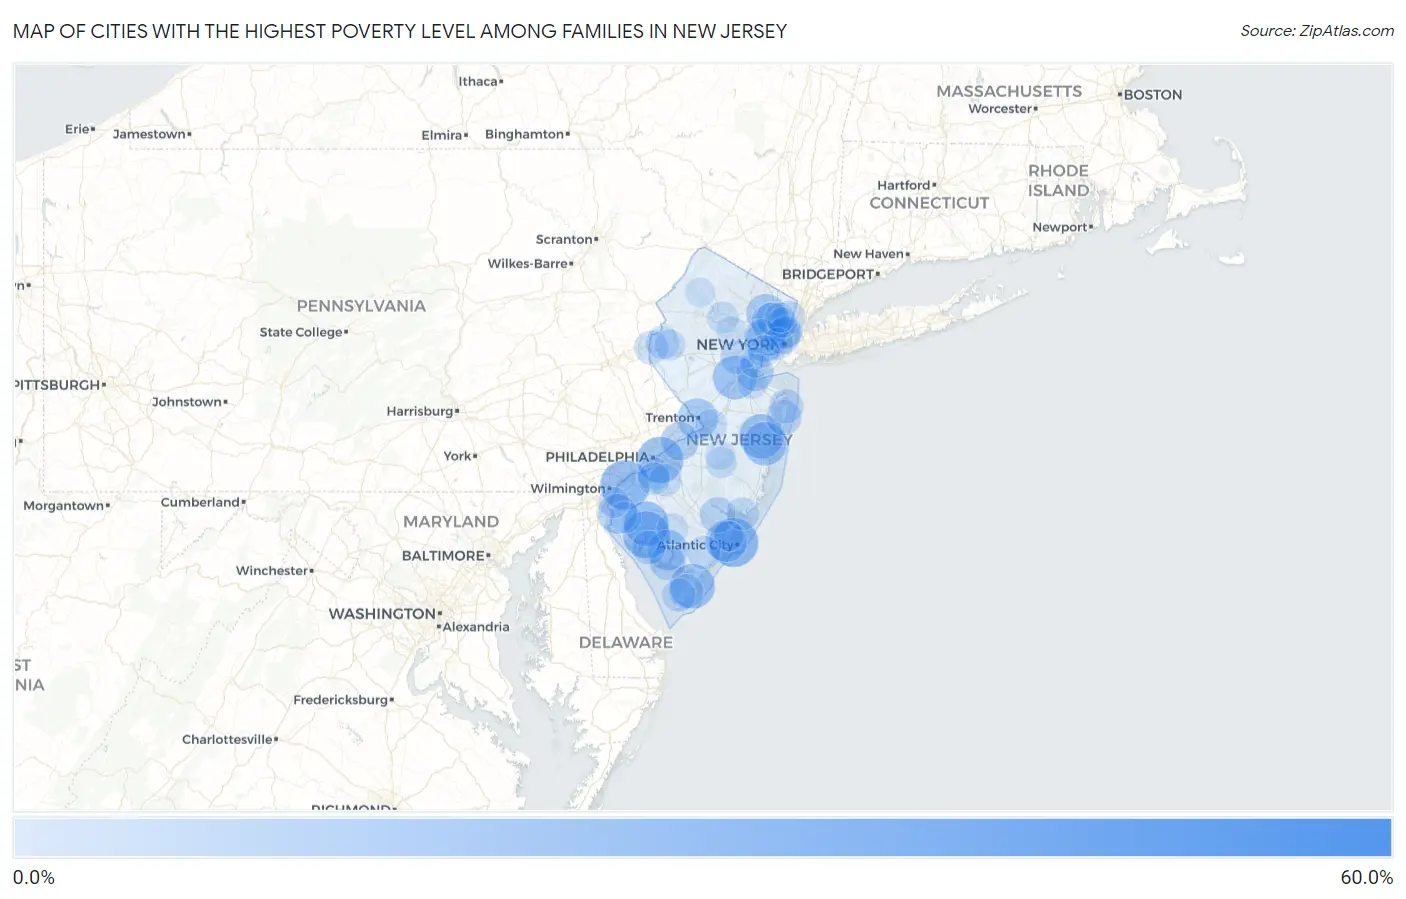
Map of Cities with the Highest Poverty Level Among Families in New Jersey
0.0%
60.0%
Cities with the Highest Poverty Level Among Families in New Jersey
| City | Family Poverty | vs State | vs National | |
| 1. | Pluckemin | 56.3% | 6.9%(+49.4)#1 | 8.8%(+47.5)#462 |
| 2. | Dorchester | 55.0% | 6.9%(+48.1)#2 | 8.8%(+46.2)#503 |
| 3. | Seaside Heights Borough | 41.9% | 6.9%(+35.0)#3 | 8.8%(+33.1)#1,059 |
| 4. | Keasbey | 41.2% | 6.9%(+34.2)#4 | 8.8%(+32.4)#1,133 |
| 5. | Teterboro Borough | 38.9% | 6.9%(+31.9)#5 | 8.8%(+30.1)#1,296 |
| 6. | Penns Grove Borough | 36.0% | 6.9%(+29.1)#6 | 8.8%(+27.3)#1,504 |
| 7. | Harrisonville | 34.8% | 6.9%(+27.9)#7 | 8.8%(+26.1)#1,619 |
| 8. | Pedricktown | 31.6% | 6.9%(+24.7)#8 | 8.8%(+22.9)#1,984 |
| 9. | Atlantic City | 31.3% | 6.9%(+24.3)#9 | 8.8%(+22.5)#2,030 |
| 10. | Bridgeton | 28.9% | 6.9%(+21.9)#10 | 8.8%(+20.1)#2,401 |
| 11. | Camden | 28.2% | 6.9%(+21.3)#11 | 8.8%(+19.4)#2,526 |
| 12. | Cape May Court House | 26.4% | 6.9%(+19.5)#12 | 8.8%(+17.6)#2,897 |
| 13. | Seabrook Farms | 26.3% | 6.9%(+19.4)#13 | 8.8%(+17.6)#2,912 |
| 14. | Rutgers University-Busch Campus | 26.0% | 6.9%(+19.1)#14 | 8.8%(+17.2)#2,987 |
| 15. | Lakewood | 26.0% | 6.9%(+19.0)#15 | 8.8%(+17.2)#2,998 |
| 16. | New Brunswick | 25.4% | 6.9%(+18.4)#16 | 8.8%(+16.6)#3,147 |
| 17. | Leisure Village | 25.0% | 6.9%(+18.1)#17 | 8.8%(+16.3)#3,194 |
| 18. | Pleasantville | 22.7% | 6.9%(+15.8)#18 | 8.8%(+13.9)#3,853 |
| 19. | Dunellen Borough | 22.5% | 6.9%(+15.5)#19 | 8.8%(+13.7)#3,918 |
| 20. | Trenton | 21.8% | 6.9%(+14.9)#20 | 8.8%(+13.0)#4,165 |
| 21. | East Newark Borough | 21.7% | 6.9%(+14.7)#21 | 8.8%(+12.9)#4,206 |
| 22. | Laurel Lake | 21.4% | 6.9%(+14.5)#22 | 8.8%(+12.6)#4,273 |
| 23. | Newark | 21.4% | 6.9%(+14.5)#23 | 8.8%(+12.6)#4,292 |
| 24. | Paterson | 20.9% | 6.9%(+13.9)#24 | 8.8%(+12.1)#4,495 |
| 25. | Victory Gardens Borough | 20.6% | 6.9%(+13.6)#25 | 8.8%(+11.8)#4,595 |
| 26. | Salem | 20.6% | 6.9%(+13.6)#26 | 8.8%(+11.8)#4,610 |
| 27. | Passaic | 20.4% | 6.9%(+13.4)#27 | 8.8%(+11.6)#4,693 |
| 28. | Prospect Park Borough | 19.8% | 6.9%(+12.9)#28 | 8.8%(+11.0)#4,946 |
| 29. | Beverly | 19.1% | 6.9%(+12.2)#29 | 8.8%(+10.4)#5,193 |
| 30. | Lindenwold Borough | 18.7% | 6.9%(+11.7)#30 | 8.8%(+9.87)#5,426 |
| 31. | Perth Amboy | 17.9% | 6.9%(+10.9)#31 | 8.8%(+9.07)#5,847 |
| 32. | Woodbine Borough | 17.7% | 6.9%(+10.8)#32 | 8.8%(+8.96)#5,897 |
| 33. | Neptune City Borough | 17.7% | 6.9%(+10.8)#33 | 8.8%(+8.92)#5,910 |
| 34. | Laurel Heights | 17.5% | 6.9%(+10.5)#34 | 8.8%(+8.68)#6,043 |
| 35. | Arrowhead Lake | 17.2% | 6.9%(+10.3)#35 | 8.8%(+8.46)#6,153 |
| 36. | Dividing Creek | 16.9% | 6.9%(+9.91)#36 | 8.8%(+8.07)#6,352 |
| 37. | Wharton Borough | 16.8% | 6.9%(+9.83)#37 | 8.8%(+7.99)#6,390 |
| 38. | Woodlynne Borough | 16.4% | 6.9%(+9.48)#38 | 8.8%(+7.63)#6,606 |
| 39. | Union City | 16.3% | 6.9%(+9.36)#39 | 8.8%(+7.51)#6,671 |
| 40. | Egg Harbor City | 16.3% | 6.9%(+9.33)#40 | 8.8%(+7.49)#6,683 |
| 41. | Port Norris | 15.8% | 6.9%(+8.86)#41 | 8.8%(+7.02)#6,926 |
| 42. | Asbury Park | 15.7% | 6.9%(+8.77)#42 | 8.8%(+6.93)#6,995 |
| 43. | Crosswicks | 15.4% | 6.9%(+8.50)#43 | 8.8%(+6.65)#7,162 |
| 44. | West Park | 15.2% | 6.9%(+8.28)#44 | 8.8%(+6.44)#7,306 |
| 45. | Westville Borough | 15.2% | 6.9%(+8.22)#45 | 8.8%(+6.38)#7,346 |
| 46. | Port Morris | 15.0% | 6.9%(+8.08)#46 | 8.8%(+6.24)#7,435 |
| 47. | West New York | 15.0% | 6.9%(+8.02)#47 | 8.8%(+6.18)#7,491 |
| 48. | Whitesboro | 14.7% | 6.9%(+7.77)#48 | 8.8%(+5.93)#7,654 |
| 49. | East Orange | 14.6% | 6.9%(+7.64)#49 | 8.8%(+5.80)#7,747 |
| 50. | Long Branch | 14.5% | 6.9%(+7.58)#50 | 8.8%(+5.74)#7,788 |
| 51. | Cedarville | 14.2% | 6.9%(+7.24)#51 | 8.8%(+5.40)#8,067 |
| 52. | Plainfield | 14.1% | 6.9%(+7.18)#52 | 8.8%(+5.34)#8,109 |
| 53. | Phillipsburg | 14.1% | 6.9%(+7.14)#53 | 8.8%(+5.30)#8,133 |
| 54. | Corbin City | 13.8% | 6.9%(+6.82)#54 | 8.8%(+4.97)#8,380 |
| 55. | New Village | 13.6% | 6.9%(+6.67)#55 | 8.8%(+4.83)#8,500 |
| 56. | Villas | 13.5% | 6.9%(+6.54)#56 | 8.8%(+4.70)#8,575 |
| 57. | Clearbrook | 13.5% | 6.9%(+6.53)#57 | 8.8%(+4.69)#8,581 |
| 58. | Englewood | 13.4% | 6.9%(+6.44)#58 | 8.8%(+4.60)#8,640 |
| 59. | Garfield | 13.3% | 6.9%(+6.38)#59 | 8.8%(+4.53)#8,719 |
| 60. | New Vernon | 13.1% | 6.9%(+6.15)#60 | 8.8%(+4.31)#8,885 |
| 61. | Woodbury | 13.1% | 6.9%(+6.12)#61 | 8.8%(+4.28)#8,909 |
| 62. | Fairview Borough | 13.0% | 6.9%(+6.03)#62 | 8.8%(+4.19)#8,985 |
| 63. | Mystic Island | 12.9% | 6.9%(+5.97)#63 | 8.8%(+4.13)#9,040 |
| 64. | Silver Lake Cdp Essex County | 12.8% | 6.9%(+5.81)#64 | 8.8%(+3.97)#9,167 |
| 65. | Keansburg Borough | 12.7% | 6.9%(+5.78)#65 | 8.8%(+3.93)#9,192 |
| 66. | Blackwood | 12.6% | 6.9%(+5.69)#66 | 8.8%(+3.85)#9,252 |
| 67. | Somerdale Borough | 12.6% | 6.9%(+5.65)#67 | 8.8%(+3.81)#9,277 |
| 68. | Oak Valley | 12.5% | 6.9%(+5.52)#68 | 8.8%(+3.68)#9,399 |
| 69. | Guttenberg | 12.0% | 6.9%(+5.11)#69 | 8.8%(+3.27)#9,751 |
| 70. | Jersey City | 12.0% | 6.9%(+5.06)#70 | 8.8%(+3.21)#9,814 |
| 71. | Merchantville Borough | 12.0% | 6.9%(+5.05)#71 | 8.8%(+3.21)#9,824 |
| 72. | Elizabeth | 11.9% | 6.9%(+4.97)#72 | 8.8%(+3.12)#9,886 |
| 73. | Groveville | 11.8% | 6.9%(+4.89)#73 | 8.8%(+3.05)#9,945 |
| 74. | Quinton | 11.8% | 6.9%(+4.86)#74 | 8.8%(+3.02)#9,967 |
| 75. | Dover | 11.6% | 6.9%(+4.68)#75 | 8.8%(+2.83)#10,141 |
| 76. | Collingswood Borough | 11.4% | 6.9%(+4.45)#76 | 8.8%(+2.60)#10,380 |
| 77. | Wrightstown Borough | 11.2% | 6.9%(+4.27)#77 | 8.8%(+2.43)#10,544 |
| 78. | Vineland | 11.1% | 6.9%(+4.17)#78 | 8.8%(+2.33)#10,674 |
| 79. | Presidential Lakes Estates | 11.0% | 6.9%(+4.07)#79 | 8.8%(+2.23)#10,737 |
| 80. | Lakehurst Borough | 11.0% | 6.9%(+4.05)#80 | 8.8%(+2.21)#10,756 |
| 81. | Delmont | 10.9% | 6.9%(+3.93)#81 | 8.8%(+2.09)#10,874 |
| 82. | Asbury | 10.9% | 6.9%(+3.93)#82 | 8.8%(+2.09)#10,878 |
| 83. | Pennsville | 10.8% | 6.9%(+3.88)#83 | 8.8%(+2.04)#10,919 |
| 84. | Shiloh Borough | 10.7% | 6.9%(+3.73)#84 | 8.8%(+1.88)#11,055 |
| 85. | Union | 10.6% | 6.9%(+3.66)#85 | 8.8%(+1.81)#11,128 |
| 86. | Madison Park | 10.4% | 6.9%(+3.47)#86 | 8.8%(+1.63)#11,354 |
| 87. | English Creek | 10.3% | 6.9%(+3.39)#87 | 8.8%(+1.54)#11,430 |
| 88. | Sussex Borough | 10.2% | 6.9%(+3.25)#88 | 8.8%(+1.41)#11,561 |
| 89. | Ridgefield Park | 10.2% | 6.9%(+3.24)#89 | 8.8%(+1.40)#11,574 |
| 90. | High Bridge Borough | 10.2% | 6.9%(+3.23)#90 | 8.8%(+1.39)#11,581 |
| 91. | Avenel | 10.1% | 6.9%(+3.19)#91 | 8.8%(+1.34)#11,635 |
| 92. | Browns Mills | 10.0% | 6.9%(+3.09)#92 | 8.8%(+1.25)#11,715 |
| 93. | Freehold Borough | 10.0% | 6.9%(+3.09)#93 | 8.8%(+1.25)#11,718 |
| 94. | Morristown | 10.0% | 6.9%(+3.07)#94 | 8.8%(+1.23)#11,732 |
| 95. | Pine Hill Borough | 10.0% | 6.9%(+3.04)#95 | 8.8%(+1.20)#11,806 |
| 96. | Hackensack | 10.0% | 6.9%(+3.04)#96 | 8.8%(+1.20)#11,811 |
| 97. | Newton | 9.9% | 6.9%(+2.97)#97 | 8.8%(+1.13)#11,866 |
| 98. | Absecon | 9.9% | 6.9%(+2.96)#98 | 8.8%(+1.12)#11,882 |
| 99. | Audubon Park Borough | 9.9% | 6.9%(+2.92)#99 | 8.8%(+1.08)#11,928 |
| 100. | South River Borough | 9.8% | 6.9%(+2.91)#100 | 8.8%(+1.07)#11,946 |
Common Questions
What are the Top 10 Cities with the Highest Poverty Level Among Families in New Jersey?
Top 10 Cities with the Highest Poverty Level Among Families in New Jersey are:
#1
31.6%
#2
31.3%
#3
28.9%
#4
28.2%
#5
26.4%
#6
26.3%
#7
26.0%
#8
25.4%
#9
25.0%
#10
22.7%
What city has the Highest Poverty Level Among Families in New Jersey?
Pedricktown has the Highest Poverty Level Among Families in New Jersey with 31.6%.
What is the Poverty Level Among Families in the State of New Jersey?
Poverty Level Among Families in New Jersey is 6.9%.
What is the Poverty Level Among Families in the United States?
Poverty Level Among Families in the United States is 8.8%.