Zip Codes with the Highest Percentage of Population Employed in Life, Physical & Social Science in New Jersey
RELATED REPORTS & OPTIONS
Life, Physical & Social Science
New Jersey
Compare Zip Codes
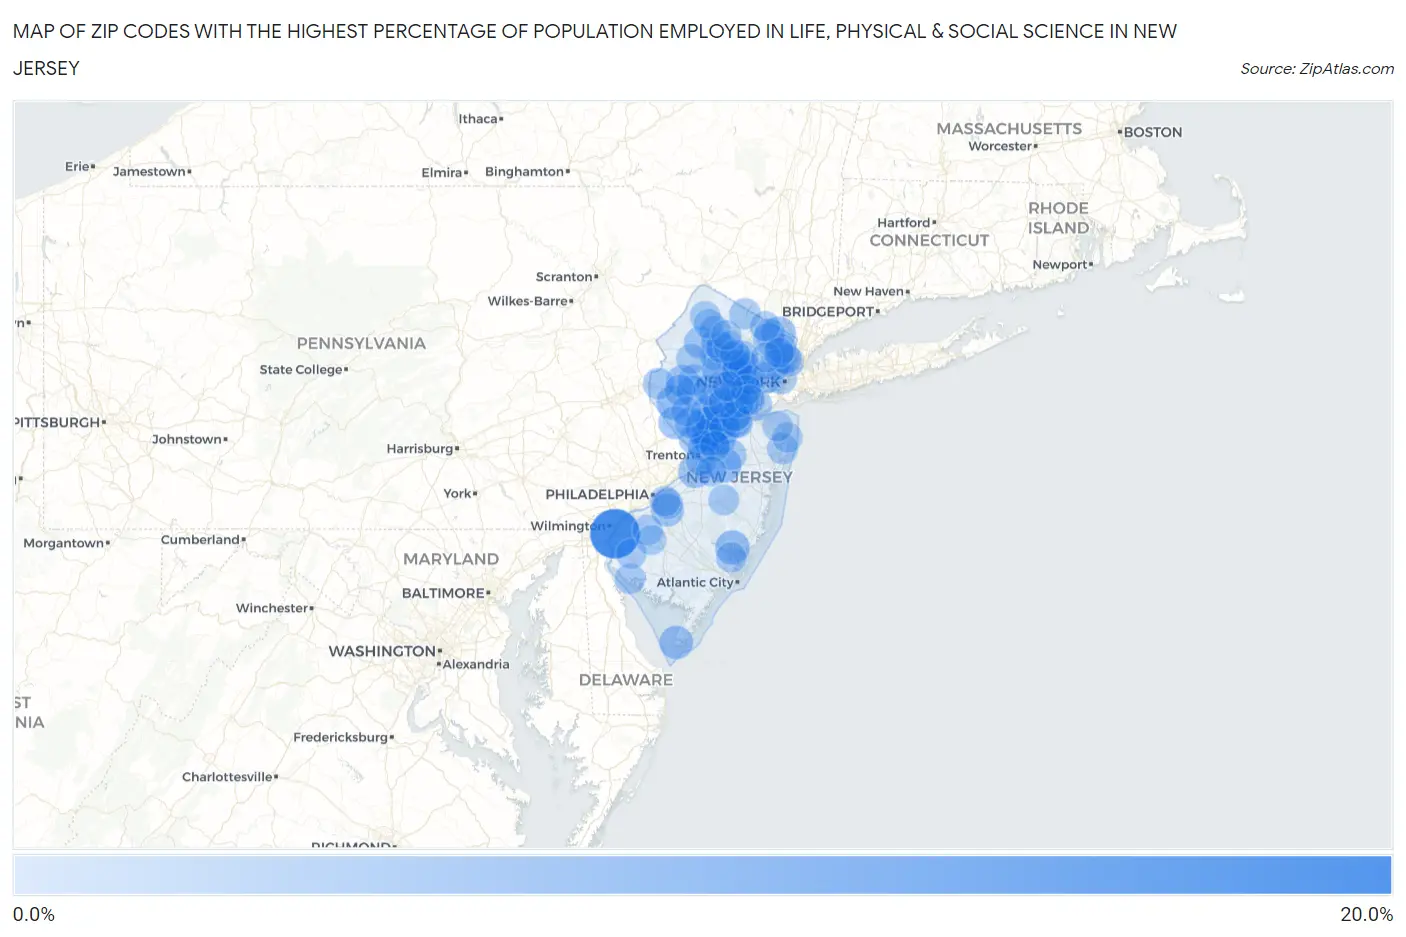
Map of Zip Codes with the Highest Percentage of Population Employed in Life, Physical & Social Science in New Jersey
0.0%
20.0%
Zip Codes with the Highest Percentage of Population Employed in Life, Physical & Social Science in New Jersey
| Zip Code | % Employed | vs State | vs National | |
| 1. | 08023 | 15.3% | 1.3%(+14.0)#1 | 1.1%(+14.2)#99 |
| 2. | 08558 | 9.1% | 1.3%(+7.81)#2 | 1.1%(+7.97)#253 |
| 3. | 08544 | 7.6% | 1.3%(+6.36)#3 | 1.1%(+6.52)#355 |
| 4. | 08540 | 6.7% | 1.3%(+5.44)#4 | 1.1%(+5.61)#443 |
| 5. | 08553 | 5.5% | 1.3%(+4.25)#5 | 1.1%(+4.41)#627 |
| 6. | 08501 | 5.4% | 1.3%(+4.11)#6 | 1.1%(+4.27)#660 |
| 7. | 08536 | 5.1% | 1.3%(+3.87)#7 | 1.1%(+4.03)#731 |
| 8. | 08867 | 5.0% | 1.3%(+3.72)#8 | 1.1%(+3.88)#769 |
| 9. | 08224 | 4.9% | 1.3%(+3.60)#9 | 1.1%(+3.76)#807 |
| 10. | 07677 | 4.7% | 1.3%(+3.49)#10 | 1.1%(+3.65)#833 |
| 11. | 08823 | 4.7% | 1.3%(+3.44)#11 | 1.1%(+3.60)#852 |
| 12. | 08844 | 4.6% | 1.3%(+3.30)#12 | 1.1%(+3.47)#900 |
| 13. | 07932 | 4.5% | 1.3%(+3.29)#13 | 1.1%(+3.46)#909 |
| 14. | 08542 | 4.5% | 1.3%(+3.23)#14 | 1.1%(+3.39)#934 |
| 15. | 08904 | 4.4% | 1.3%(+3.17)#15 | 1.1%(+3.33)#956 |
| 16. | 08212 | 4.3% | 1.3%(+3.09)#16 | 1.1%(+3.26)#985 |
| 17. | 08518 | 4.3% | 1.3%(+3.06)#17 | 1.1%(+3.22)#997 |
| 18. | 08559 | 4.0% | 1.3%(+2.75)#18 | 1.1%(+2.91)#1,151 |
| 19. | 07922 | 3.9% | 1.3%(+2.66)#19 | 1.1%(+2.83)#1,206 |
| 20. | 08049 | 3.9% | 1.3%(+2.64)#20 | 1.1%(+2.80)#1,220 |
| 21. | 08826 | 3.6% | 1.3%(+2.37)#21 | 1.1%(+2.54)#1,356 |
| 22. | 08850 | 3.5% | 1.3%(+2.21)#22 | 1.1%(+2.37)#1,450 |
| 23. | 08534 | 3.5% | 1.3%(+2.20)#23 | 1.1%(+2.37)#1,452 |
| 24. | 08807 | 3.3% | 1.3%(+2.09)#24 | 1.1%(+2.25)#1,539 |
| 25. | 07821 | 3.3% | 1.3%(+2.05)#25 | 1.1%(+2.21)#1,576 |
| 26. | 08502 | 3.3% | 1.3%(+2.04)#26 | 1.1%(+2.20)#1,585 |
| 27. | 07928 | 3.3% | 1.3%(+2.03)#27 | 1.1%(+2.19)#1,597 |
| 28. | 07076 | 3.2% | 1.3%(+1.94)#28 | 1.1%(+2.11)#1,668 |
| 29. | 07078 | 3.2% | 1.3%(+1.93)#29 | 1.1%(+2.10)#1,678 |
| 30. | 08648 | 3.1% | 1.3%(+1.89)#30 | 1.1%(+2.06)#1,708 |
| 31. | 08611 | 3.1% | 1.3%(+1.84)#31 | 1.1%(+2.00)#1,768 |
| 32. | 07077 | 3.1% | 1.3%(+1.84)#32 | 1.1%(+2.00)#1,773 |
| 33. | 07974 | 3.0% | 1.3%(+1.79)#33 | 1.1%(+1.95)#1,832 |
| 34. | 08833 | 3.0% | 1.3%(+1.74)#34 | 1.1%(+1.91)#1,879 |
| 35. | 07432 | 3.0% | 1.3%(+1.71)#35 | 1.1%(+1.87)#1,920 |
| 36. | 08854 | 3.0% | 1.3%(+1.71)#36 | 1.1%(+1.87)#1,923 |
| 37. | 07869 | 3.0% | 1.3%(+1.70)#37 | 1.1%(+1.86)#1,927 |
| 38. | 08886 | 2.9% | 1.3%(+1.68)#38 | 1.1%(+1.84)#1,955 |
| 39. | 07830 | 2.9% | 1.3%(+1.63)#39 | 1.1%(+1.79)#2,017 |
| 40. | 08835 | 2.9% | 1.3%(+1.62)#40 | 1.1%(+1.78)#2,028 |
| 41. | 08551 | 2.8% | 1.3%(+1.57)#41 | 1.1%(+1.73)#2,085 |
| 42. | 08852 | 2.8% | 1.3%(+1.54)#42 | 1.1%(+1.71)#2,120 |
| 43. | 07034 | 2.8% | 1.3%(+1.53)#43 | 1.1%(+1.70)#2,132 |
| 44. | 08809 | 2.8% | 1.3%(+1.51)#44 | 1.1%(+1.68)#2,157 |
| 45. | 07421 | 2.7% | 1.3%(+1.49)#45 | 1.1%(+1.65)#2,185 |
| 46. | 07878 | 2.7% | 1.3%(+1.49)#46 | 1.1%(+1.65)#2,186 |
| 47. | 07310 | 2.7% | 1.3%(+1.46)#47 | 1.1%(+1.62)#2,232 |
| 48. | 07921 | 2.7% | 1.3%(+1.44)#48 | 1.1%(+1.60)#2,254 |
| 49. | 07755 | 2.7% | 1.3%(+1.42)#49 | 1.1%(+1.59)#2,271 |
| 50. | 07603 | 2.7% | 1.3%(+1.40)#50 | 1.1%(+1.56)#2,312 |
| 51. | 07940 | 2.6% | 1.3%(+1.39)#51 | 1.1%(+1.55)#2,323 |
| 52. | 07054 | 2.6% | 1.3%(+1.38)#52 | 1.1%(+1.54)#2,344 |
| 53. | 07847 | 2.6% | 1.3%(+1.37)#53 | 1.1%(+1.53)#2,359 |
| 54. | 07920 | 2.6% | 1.3%(+1.34)#54 | 1.1%(+1.50)#2,414 |
| 55. | 08820 | 2.6% | 1.3%(+1.32)#55 | 1.1%(+1.48)#2,436 |
| 56. | 07871 | 2.6% | 1.3%(+1.32)#56 | 1.1%(+1.48)#2,440 |
| 57. | 07102 | 2.5% | 1.3%(+1.29)#57 | 1.1%(+1.46)#2,489 |
| 58. | 08816 | 2.5% | 1.3%(+1.27)#58 | 1.1%(+1.43)#2,536 |
| 59. | 07945 | 2.5% | 1.3%(+1.24)#59 | 1.1%(+1.40)#2,592 |
| 60. | 07073 | 2.5% | 1.3%(+1.22)#60 | 1.1%(+1.39)#2,609 |
| 61. | 07069 | 2.5% | 1.3%(+1.22)#61 | 1.1%(+1.39)#2,611 |
| 62. | 08015 | 2.5% | 1.3%(+1.22)#62 | 1.1%(+1.38)#2,616 |
| 63. | 07961 | 2.5% | 1.3%(+1.20)#63 | 1.1%(+1.36)#2,661 |
| 64. | 08555 | 2.4% | 1.3%(+1.14)#64 | 1.1%(+1.31)#2,764 |
| 65. | 07401 | 2.4% | 1.3%(+1.13)#65 | 1.1%(+1.29)#2,788 |
| 66. | 07024 | 2.4% | 1.3%(+1.12)#66 | 1.1%(+1.28)#2,804 |
| 67. | 08033 | 2.4% | 1.3%(+1.11)#67 | 1.1%(+1.27)#2,824 |
| 68. | 07605 | 2.4% | 1.3%(+1.10)#68 | 1.1%(+1.27)#2,830 |
| 69. | 07981 | 2.3% | 1.3%(+1.08)#69 | 1.1%(+1.25)#2,863 |
| 70. | 07849 | 2.3% | 1.3%(+1.08)#70 | 1.1%(+1.24)#2,876 |
| 71. | 08323 | 2.3% | 1.3%(+1.06)#71 | 1.1%(+1.22)#2,938 |
| 72. | 07661 | 2.3% | 1.3%(+1.03)#72 | 1.1%(+1.20)#2,979 |
| 73. | 08001 | 2.3% | 1.3%(+1.03)#73 | 1.1%(+1.20)#2,983 |
| 74. | 08108 | 2.3% | 1.3%(+1.03)#74 | 1.1%(+1.20)#2,985 |
| 75. | 07885 | 2.3% | 1.3%(+1.03)#75 | 1.1%(+1.19)#2,990 |
| 76. | 07080 | 2.3% | 1.3%(+1.03)#76 | 1.1%(+1.19)#2,991 |
| 77. | 07936 | 2.3% | 1.3%(+1.03)#77 | 1.1%(+1.19)#2,994 |
| 78. | 08241 | 2.2% | 1.3%(+0.986)#78 | 1.1%(+1.15)#3,083 |
| 79. | 07041 | 2.2% | 1.3%(+0.983)#79 | 1.1%(+1.15)#3,093 |
| 80. | 08062 | 2.2% | 1.3%(+0.968)#80 | 1.1%(+1.13)#3,122 |
| 81. | 07822 | 2.2% | 1.3%(+0.963)#81 | 1.1%(+1.13)#3,138 |
| 82. | 08901 | 2.2% | 1.3%(+0.962)#82 | 1.1%(+1.13)#3,140 |
| 83. | 07013 | 2.2% | 1.3%(+0.959)#83 | 1.1%(+1.12)#3,149 |
| 84. | 07866 | 2.2% | 1.3%(+0.953)#84 | 1.1%(+1.12)#3,160 |
| 85. | 08550 | 2.2% | 1.3%(+0.953)#85 | 1.1%(+1.12)#3,163 |
| 86. | 07046 | 2.2% | 1.3%(+0.943)#86 | 1.1%(+1.11)#3,186 |
| 87. | 08805 | 2.2% | 1.3%(+0.933)#87 | 1.1%(+1.10)#3,212 |
| 88. | 07090 | 2.2% | 1.3%(+0.925)#88 | 1.1%(+1.09)#3,229 |
| 89. | 07840 | 2.2% | 1.3%(+0.899)#89 | 1.1%(+1.06)#3,290 |
| 90. | 07607 | 2.1% | 1.3%(+0.892)#90 | 1.1%(+1.06)#3,312 |
| 91. | 07750 | 2.1% | 1.3%(+0.889)#91 | 1.1%(+1.05)#3,318 |
| 92. | 08515 | 2.1% | 1.3%(+0.886)#92 | 1.1%(+1.05)#3,324 |
| 93. | 07067 | 2.1% | 1.3%(+0.882)#93 | 1.1%(+1.05)#3,329 |
| 94. | 08822 | 2.1% | 1.3%(+0.881)#94 | 1.1%(+1.04)#3,331 |
| 95. | 07848 | 2.1% | 1.3%(+0.867)#95 | 1.1%(+1.03)#3,365 |
| 96. | 07946 | 2.1% | 1.3%(+0.865)#96 | 1.1%(+1.03)#3,370 |
| 97. | 07737 | 2.1% | 1.3%(+0.862)#97 | 1.1%(+1.03)#3,377 |
| 98. | 07430 | 2.1% | 1.3%(+0.859)#98 | 1.1%(+1.02)#3,383 |
| 99. | 08343 | 2.1% | 1.3%(+0.855)#99 | 1.1%(+1.02)#3,396 |
| 100. | 07438 | 2.1% | 1.3%(+0.850)#100 | 1.1%(+1.01)#3,413 |
Common Questions
What are the Top 10 Zip Codes with the Highest Percentage of Population Employed in Life, Physical & Social Science in New Jersey?
Top 10 Zip Codes with the Highest Percentage of Population Employed in Life, Physical & Social Science in New Jersey are:
What zip code has the Highest Percentage of Population Employed in Life, Physical & Social Science in New Jersey?
08023 has the Highest Percentage of Population Employed in Life, Physical & Social Science in New Jersey with 15.3%.
What is the Percentage of Population Employed in Life, Physical & Social Science in the State of New Jersey?
Percentage of Population Employed in Life, Physical & Social Science in New Jersey is 1.3%.
What is the Percentage of Population Employed in Life, Physical & Social Science in the United States?
Percentage of Population Employed in Life, Physical & Social Science in the United States is 1.1%.