Princeton, NJ Map & Demographics
Princeton Map
Princeton Overview
$83,200
PER CAPITA INCOME
$239,306
AVG FAMILY INCOME
$176,695
AVG HOUSEHOLD INCOME
45.5%
WAGE / INCOME GAP [ % ]
54.5¢/ $1
WAGE / INCOME GAP [ $ ]
$9,416
FAMILY INCOME DEFICIT
0.52
INEQUALITY / GINI INDEX
30,450
TOTAL POPULATION
15,212
MALE POPULATION
15,238
FEMALE POPULATION
99.83
MALES / 100 FEMALES
100.17
FEMALES / 100 MALES
28.6
MEDIAN AGE
3.1
AVG FAMILY SIZE
2.6
AVG HOUSEHOLD SIZE
15,615
LABOR FORCE [ PEOPLE ]
61.7%
PERCENT IN LABOR FORCE
4.8%
UNEMPLOYMENT RATE
Princeton Area Codes
Income in Princeton
Income Overview in Princeton
Per Capita Income in Princeton is $83,200, while median incomes of families and households are $239,306 and $176,695 respectively.
| Characteristic | Number | Measure |
| Per Capita Income | 30,450 | $83,200 |
| Median Family Income | 6,123 | $239,306 |
| Mean Family Income | 6,123 | $334,075 |
| Median Household Income | 8,951 | $176,695 |
| Mean Household Income | 8,951 | $269,420 |
| Income Deficit | 6,123 | $9,416 |
| Wage / Income Gap (%) | 30,450 | 45.45% |
| Wage / Income Gap ($) | 30,450 | 54.55¢ per $1 |
| Gini / Inequality Index | 30,450 | 0.52 |
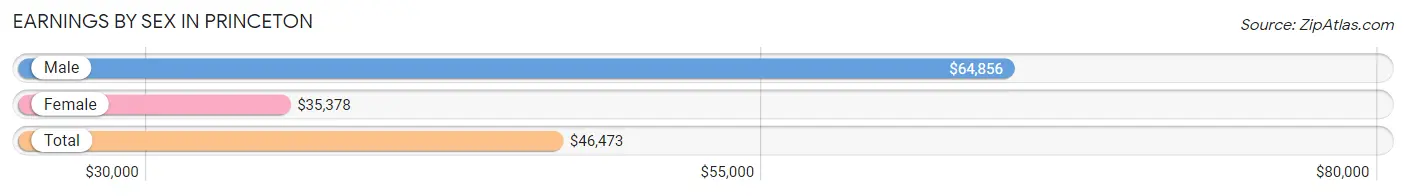
Earnings by Sex in Princeton
Average Earnings in Princeton are $46,473, $64,856 for men and $35,378 for women, a difference of 45.5%.
| Sex | Number | Average Earnings |
| Male | 10,040 (54.2%) | $64,856 |
| Female | 8,491 (45.8%) | $35,378 |
| Total | 18,531 (100.0%) | $46,473 |
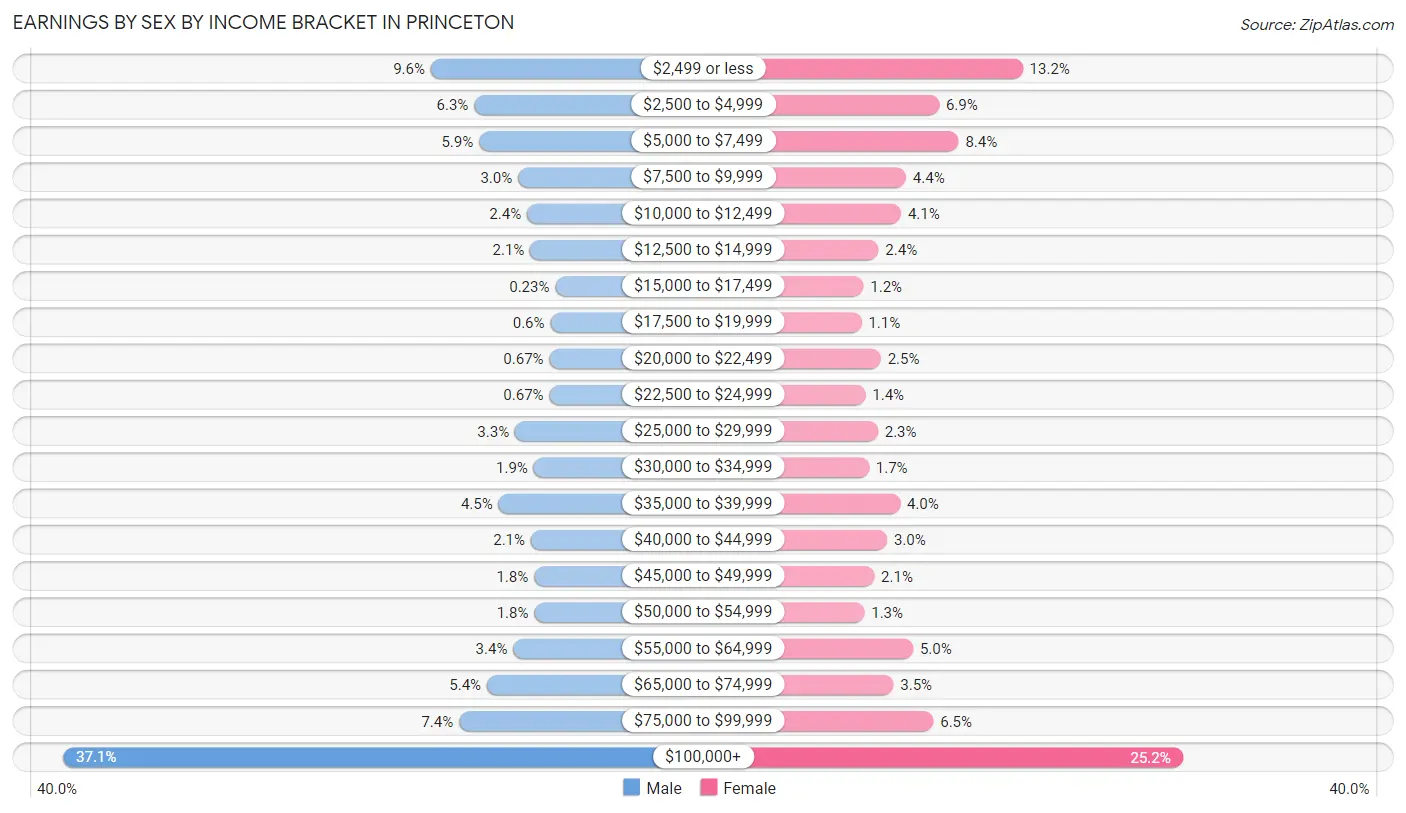
Earnings by Sex by Income Bracket in Princeton
The most common earnings brackets in Princeton are $100,000+ for men (3,726 | 37.1%) and $100,000+ for women (2,136 | 25.2%).
| Income | Male | Female |
| $2,499 or less | 960 (9.6%) | 1,119 (13.2%) |
| $2,500 to $4,999 | 634 (6.3%) | 587 (6.9%) |
| $5,000 to $7,499 | 596 (5.9%) | 711 (8.4%) |
| $7,500 to $9,999 | 303 (3.0%) | 376 (4.4%) |
| $10,000 to $12,499 | 236 (2.4%) | 345 (4.1%) |
| $12,500 to $14,999 | 212 (2.1%) | 201 (2.4%) |
| $15,000 to $17,499 | 23 (0.2%) | 105 (1.2%) |
| $17,500 to $19,999 | 60 (0.6%) | 93 (1.1%) |
| $20,000 to $22,499 | 67 (0.7%) | 216 (2.5%) |
| $22,500 to $24,999 | 67 (0.7%) | 118 (1.4%) |
| $25,000 to $29,999 | 326 (3.3%) | 197 (2.3%) |
| $30,000 to $34,999 | 186 (1.8%) | 140 (1.7%) |
| $35,000 to $39,999 | 450 (4.5%) | 339 (4.0%) |
| $40,000 to $44,999 | 207 (2.1%) | 256 (3.0%) |
| $45,000 to $49,999 | 183 (1.8%) | 174 (2.1%) |
| $50,000 to $54,999 | 181 (1.8%) | 111 (1.3%) |
| $55,000 to $64,999 | 339 (3.4%) | 421 (5.0%) |
| $65,000 to $74,999 | 537 (5.3%) | 296 (3.5%) |
| $75,000 to $99,999 | 747 (7.4%) | 550 (6.5%) |
| $100,000+ | 3,726 (37.1%) | 2,136 (25.2%) |
| Total | 10,040 (100.0%) | 8,491 (100.0%) |
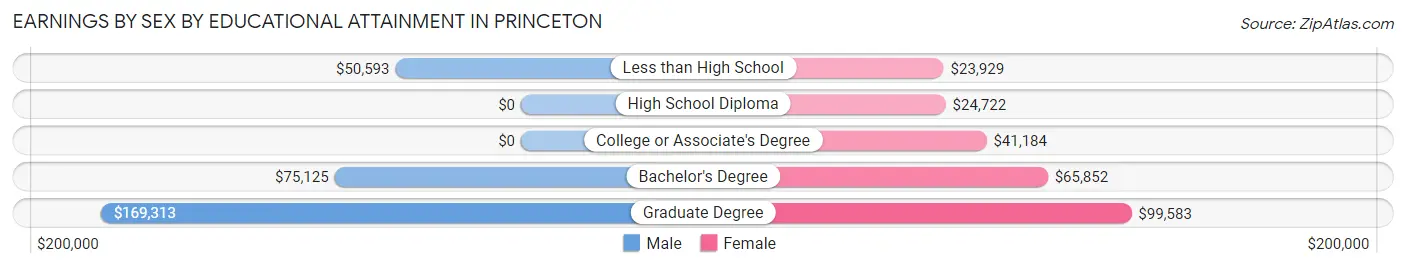
Earnings by Sex by Educational Attainment in Princeton
Average earnings in Princeton are $112,532 for men and $74,730 for women, a difference of 33.6%. Men with an educational attainment of graduate degree enjoy the highest average annual earnings of $169,313, while those with less than high school education earn the least with $50,593. Women with an educational attainment of graduate degree earn the most with the average annual earnings of $99,583, while those with less than high school education have the smallest earnings of $23,929.
| Educational Attainment | Male Income | Female Income |
| Less than High School | $50,593 | $23,929 |
| High School Diploma | - | - |
| College or Associate's Degree | - | - |
| Bachelor's Degree | $75,125 | $65,852 |
| Graduate Degree | $169,313 | $99,583 |
| Total | $112,532 | $74,730 |
Family Income in Princeton
Family Income Brackets in Princeton
According to the Princeton family income data, there are 3,527 families falling into the $200,000+ income range, which is the most common income bracket and makes up 57.6% of all families. Conversely, the $25,000 to $34,999 income bracket is the least frequent group with only 55 families (0.9%) belonging to this category.
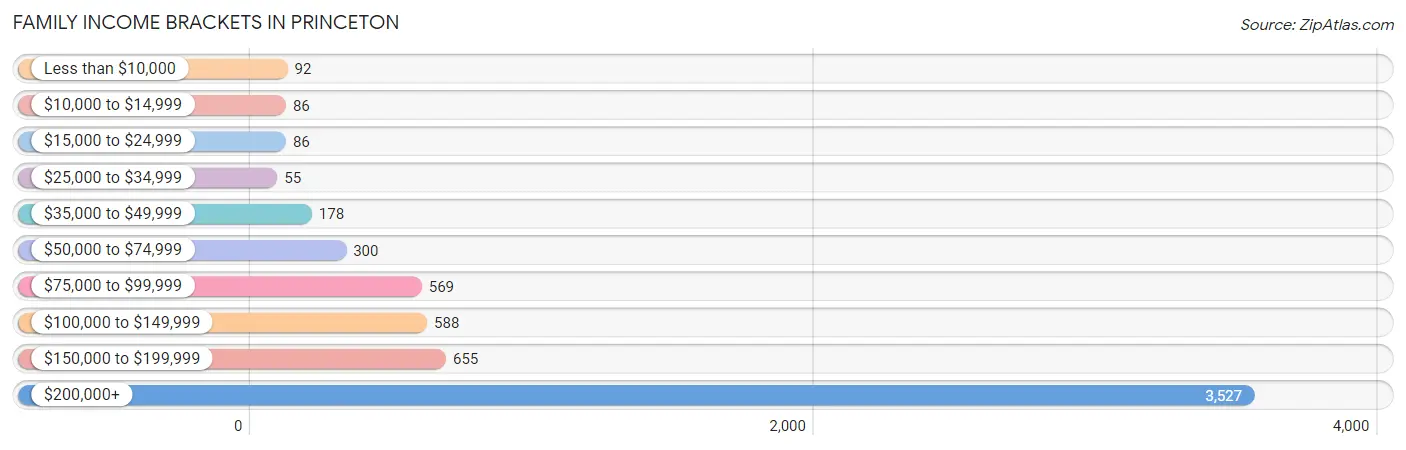
| Income Bracket | # Families | % Families |
| Less than $10,000 | 92 | 1.5% |
| $10,000 to $14,999 | 86 | 1.4% |
| $15,000 to $24,999 | 86 | 1.4% |
| $25,000 to $34,999 | 55 | 0.9% |
| $35,000 to $49,999 | 178 | 2.9% |
| $50,000 to $74,999 | 300 | 4.9% |
| $75,000 to $99,999 | 569 | 9.3% |
| $100,000 to $149,999 | 588 | 9.6% |
| $150,000 to $199,999 | 655 | 10.7% |
| $200,000+ | 3,527 | 57.6% |
Family Income by Famaliy Size in Princeton
4-person families (1,726 | 28.2%) account for the highest median family income in Princeton with $250,001 per family, while 2-person families (2,558 | 41.8%) have the highest median income of $95,481 per family member.
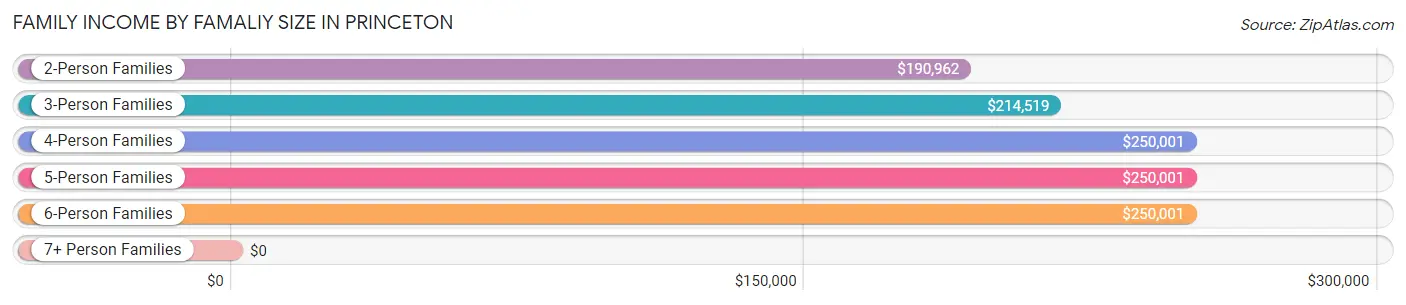
| Income Bracket | # Families | Median Income |
| 2-Person Families | 2,558 (41.8%) | $190,962 |
| 3-Person Families | 1,326 (21.7%) | $214,519 |
| 4-Person Families | 1,726 (28.2%) | $250,001 |
| 5-Person Families | 433 (7.1%) | $250,001 |
| 6-Person Families | 80 (1.3%) | $250,001 |
| 7+ Person Families | 0 (0.0%) | $0 |
| Total | 6,123 (100.0%) | $239,306 |
Family Income by Number of Earners in Princeton
The median family income in Princeton is $239,306, with families comprising 2 earners (3,223) having the highest median family income of $250,001, while families with no earners (664) have the lowest median family income of $105,705, accounting for 52.6% and 10.8% of families, respectively.
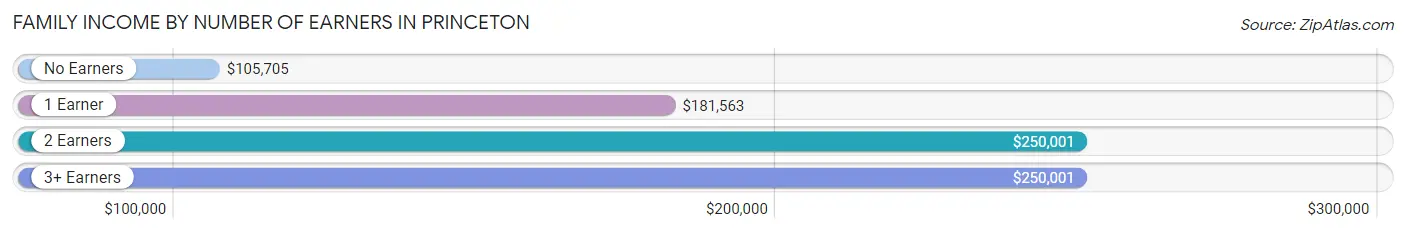
| Number of Earners | # Families | Median Income |
| No Earners | 664 (10.8%) | $105,705 |
| 1 Earner | 1,762 (28.8%) | $181,563 |
| 2 Earners | 3,223 (52.6%) | $250,001 |
| 3+ Earners | 474 (7.7%) | $250,001 |
| Total | 6,123 (100.0%) | $239,306 |
Household Income in Princeton
Household Income Brackets in Princeton
With 4,055 households falling in the category, the $200,000+ income range is the most frequent in Princeton, accounting for 45.3% of all households. In contrast, only 206 households (2.3%) fall into the less than $10,000 income bracket, making it the least populous group.
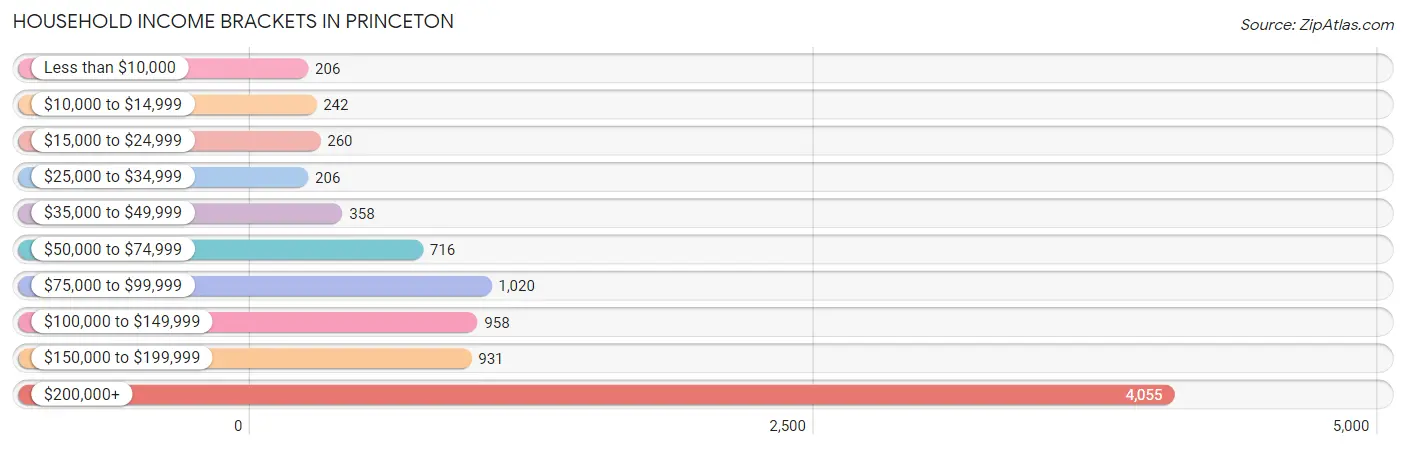
| Income Bracket | # Households | % Households |
| Less than $10,000 | 206 | 2.3% |
| $10,000 to $14,999 | 242 | 2.7% |
| $15,000 to $24,999 | 260 | 2.9% |
| $25,000 to $34,999 | 206 | 2.3% |
| $35,000 to $49,999 | 358 | 4.0% |
| $50,000 to $74,999 | 716 | 8.0% |
| $75,000 to $99,999 | 1,020 | 11.4% |
| $100,000 to $149,999 | 958 | 10.7% |
| $150,000 to $199,999 | 931 | 10.4% |
| $200,000+ | 4,055 | 45.3% |
Household Income by Householder Age in Princeton
The median household income in Princeton is $176,695, with the highest median household income of $250,001 found in the 45 to 64 years age bracket for the primary householder. A total of 3,753 households (41.9%) fall into this category. Meanwhile, the 15 to 24 years age bracket for the primary householder has the lowest median household income of $37,108, with 294 households (3.3%) in this group.
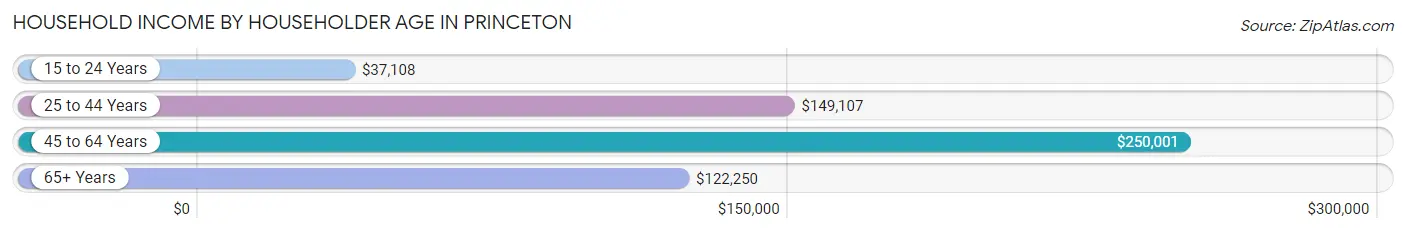
| Income Bracket | # Households | Median Income |
| 15 to 24 Years | 294 (3.3%) | $37,108 |
| 25 to 44 Years | 2,509 (28.0%) | $149,107 |
| 45 to 64 Years | 3,753 (41.9%) | $250,001 |
| 65+ Years | 2,395 (26.8%) | $122,250 |
| Total | 8,951 (100.0%) | $176,695 |
Poverty in Princeton
Income Below Poverty by Sex and Age in Princeton
With 6.3% poverty level for males and 6.4% for females among the residents of Princeton, 25 to 34 year old males and 18 to 24 year old females are the most vulnerable to poverty, with 343 males (21.8%) and 122 females (21.0%) in their respective age groups living below the poverty level.
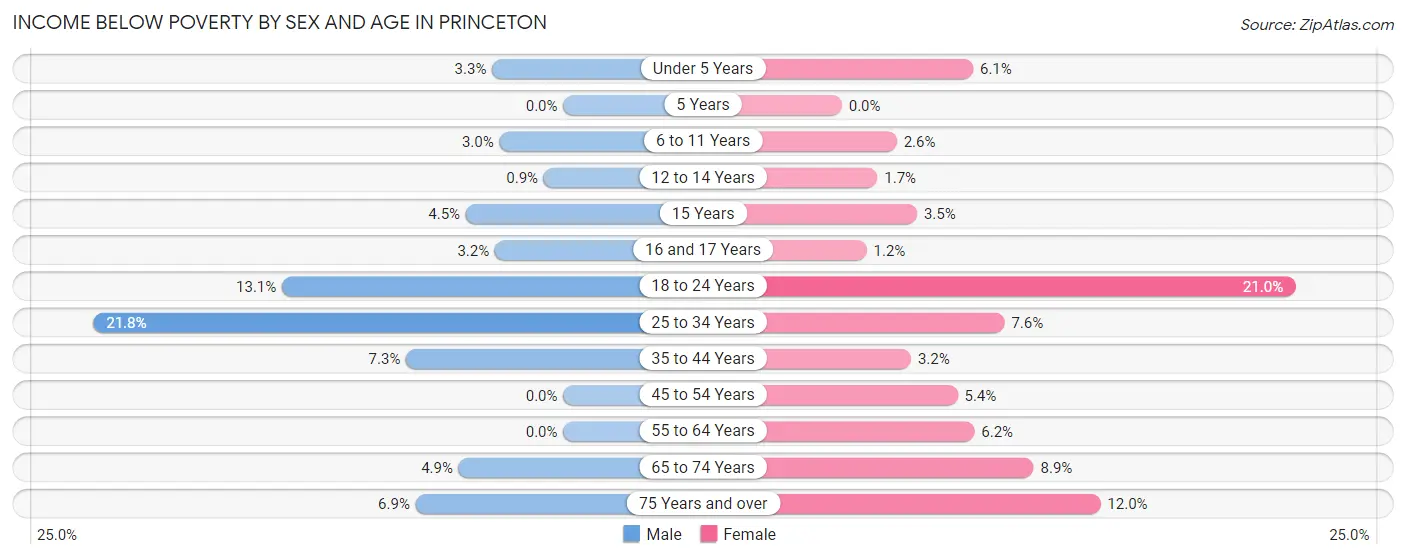
| Age Bracket | Male | Female |
| Under 5 Years | 18 (3.3%) | 26 (6.1%) |
| 5 Years | 0 (0.0%) | 0 (0.0%) |
| 6 to 11 Years | 24 (3.0%) | 34 (2.5%) |
| 12 to 14 Years | 9 (0.9%) | 8 (1.7%) |
| 15 Years | 9 (4.5%) | 6 (3.5%) |
| 16 and 17 Years | 6 (3.2%) | 5 (1.1%) |
| 18 to 24 Years | 142 (13.1%) | 122 (21.0%) |
| 25 to 34 Years | 343 (21.8%) | 84 (7.5%) |
| 35 to 44 Years | 96 (7.3%) | 44 (3.2%) |
| 45 to 54 Years | 0 (0.0%) | 112 (5.4%) |
| 55 to 64 Years | 0 (0.0%) | 90 (6.1%) |
| 65 to 74 Years | 48 (4.9%) | 98 (8.9%) |
| 75 Years and over | 57 (6.9%) | 108 (12.0%) |
| Total | 752 (6.3%) | 737 (6.4%) |
Income Above Poverty by Sex and Age in Princeton
According to the poverty statistics in Princeton, males aged 5 years and females aged 5 years are the age groups that are most secure financially, with 100.0% of males and 100.0% of females in these age groups living above the poverty line.
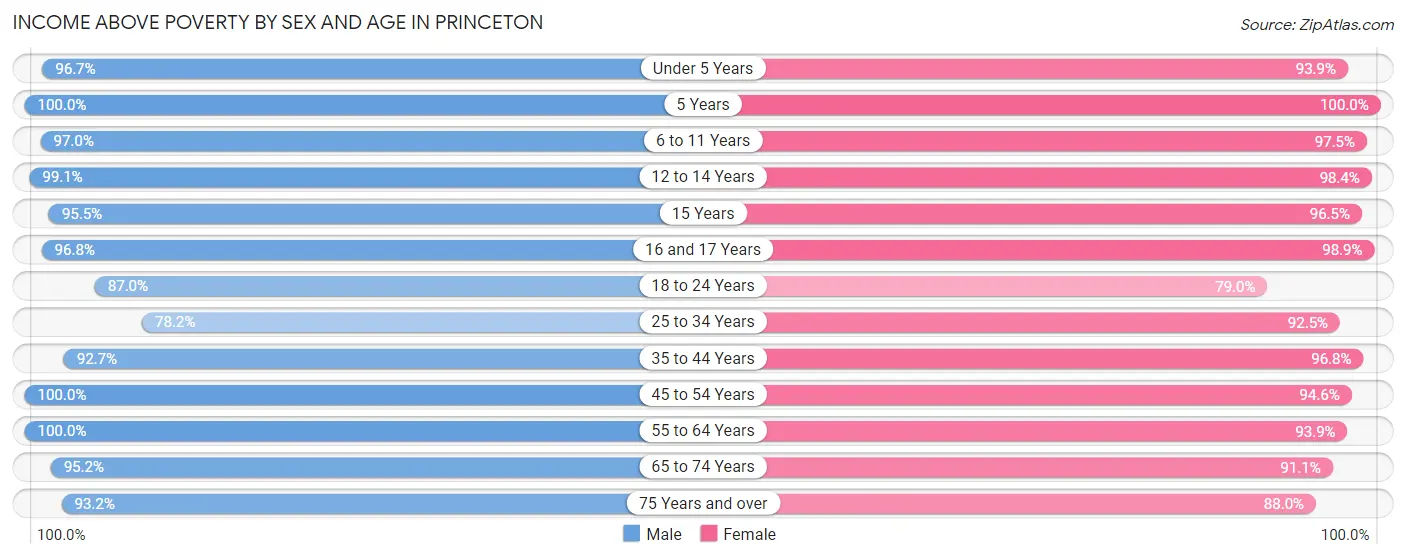
| Age Bracket | Male | Female |
| Under 5 Years | 527 (96.7%) | 401 (93.9%) |
| 5 Years | 43 (100.0%) | 117 (100.0%) |
| 6 to 11 Years | 787 (97.0%) | 1,301 (97.5%) |
| 12 to 14 Years | 992 (99.1%) | 477 (98.4%) |
| 15 Years | 190 (95.5%) | 166 (96.5%) |
| 16 and 17 Years | 183 (96.8%) | 429 (98.9%) |
| 18 to 24 Years | 946 (87.0%) | 458 (79.0%) |
| 25 to 34 Years | 1,230 (78.2%) | 1,028 (92.4%) |
| 35 to 44 Years | 1,221 (92.7%) | 1,326 (96.8%) |
| 45 to 54 Years | 1,762 (100.0%) | 1,972 (94.6%) |
| 55 to 64 Years | 1,587 (100.0%) | 1,374 (93.9%) |
| 65 to 74 Years | 942 (95.2%) | 1,003 (91.1%) |
| 75 Years and over | 775 (93.1%) | 792 (88.0%) |
| Total | 11,185 (93.7%) | 10,844 (93.6%) |
Income Below Poverty Among Married-Couple Families in Princeton
The poverty statistics for married-couple families in Princeton show that 2.8% or 151 of the total 5,343 families live below the poverty line. Families with 3 or 4 children have the highest poverty rate of 4.3%, comprising of 13 families. On the other hand, families with 1 or 2 children have the lowest poverty rate of 1.1%, which includes 27 families.
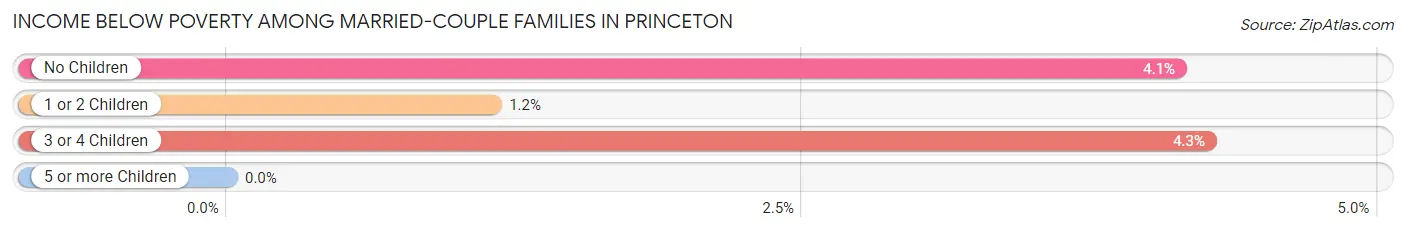
| Children | Above Poverty | Below Poverty |
| No Children | 2,574 (95.9%) | 111 (4.1%) |
| 1 or 2 Children | 2,326 (98.9%) | 27 (1.1%) |
| 3 or 4 Children | 292 (95.7%) | 13 (4.3%) |
| 5 or more Children | 0 (0.0%) | 0 (0.0%) |
| Total | 5,192 (97.2%) | 151 (2.8%) |
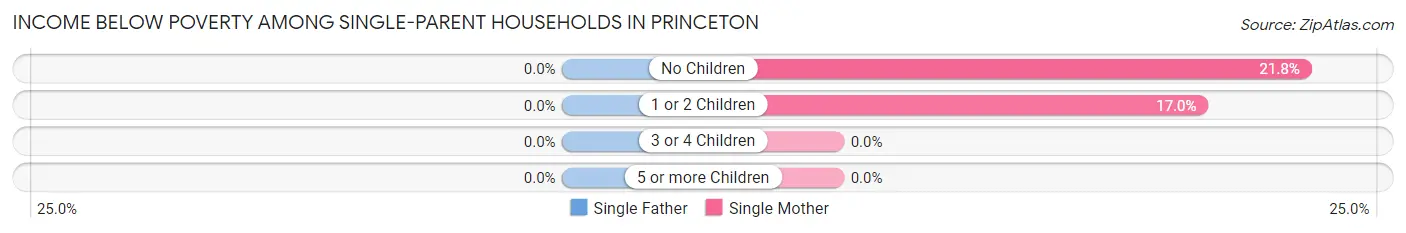
Income Below Poverty Among Single-Parent Households in Princeton
| Children | Single Father | Single Mother |
| No Children | 0 (0.0%) | 39 (21.8%) |
| 1 or 2 Children | 0 (0.0%) | 54 (17.0%) |
| 3 or 4 Children | 0 (0.0%) | 0 (0.0%) |
| 5 or more Children | 0 (0.0%) | 0 (0.0%) |
| Total | 0 (0.0%) | 93 (17.8%) |
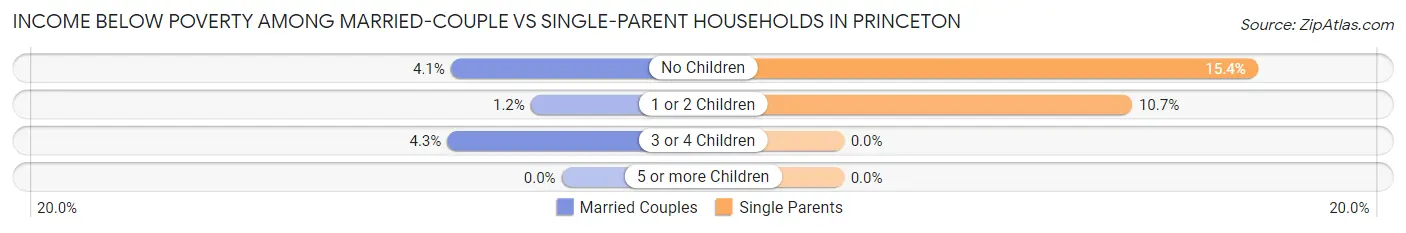
Income Below Poverty Among Married-Couple vs Single-Parent Households in Princeton
The poverty data for Princeton shows that 151 of the married-couple family households (2.8%) and 93 of the single-parent households (11.9%) are living below the poverty level. Within the married-couple family households, those with 3 or 4 children have the highest poverty rate, with 13 households (4.3%) falling below the poverty line. Among the single-parent households, those with no children have the highest poverty rate, with 39 household (15.4%) living below poverty.
| Children | Married-Couple Families | Single-Parent Households |
| No Children | 111 (4.1%) | 39 (15.4%) |
| 1 or 2 Children | 27 (1.1%) | 54 (10.7%) |
| 3 or 4 Children | 13 (4.3%) | 0 (0.0%) |
| 5 or more Children | 0 (0.0%) | 0 (0.0%) |
| Total | 151 (2.8%) | 93 (11.9%) |
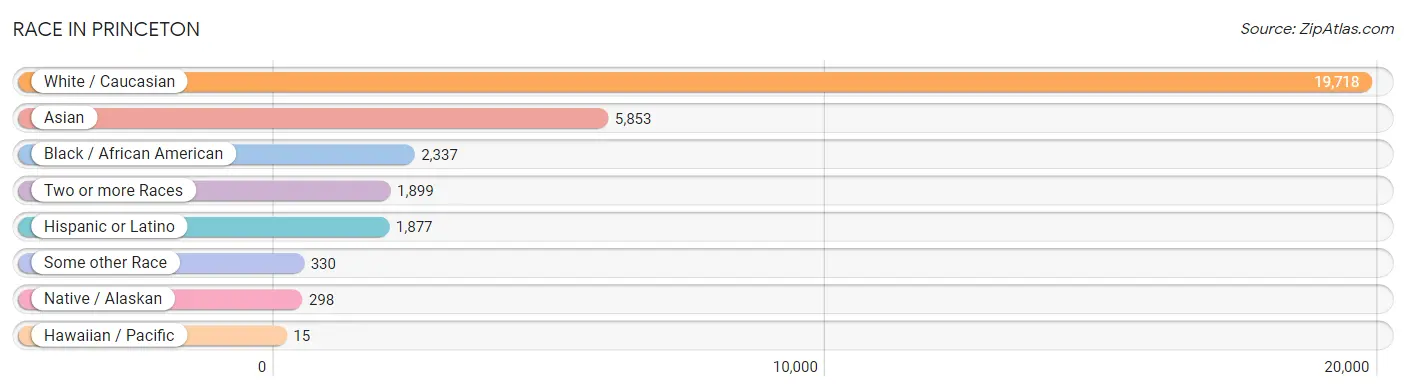
Race in Princeton
The most populous races in Princeton are White / Caucasian (19,718 | 64.8%), Asian (5,853 | 19.2%), and Black / African American (2,337 | 7.7%).
| Race | # Population | % Population |
| Asian | 5,853 | 19.2% |
| Black / African American | 2,337 | 7.7% |
| Hawaiian / Pacific | 15 | 0.1% |
| Hispanic or Latino | 1,877 | 6.2% |
| Native / Alaskan | 298 | 1.0% |
| White / Caucasian | 19,718 | 64.8% |
| Two or more Races | 1,899 | 6.2% |
| Some other Race | 330 | 1.1% |
| Total | 30,450 | 100.0% |
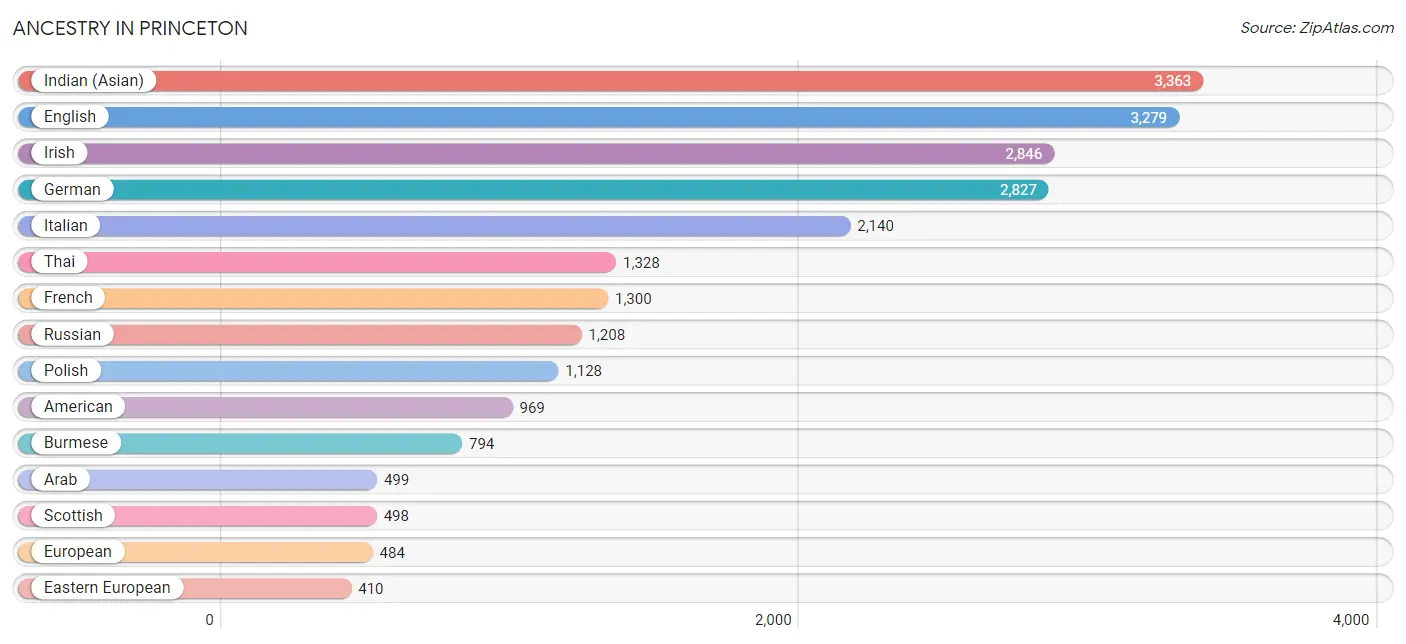
Ancestry in Princeton
The most populous ancestries reported in Princeton are Indian (Asian) (3,363 | 11.0%), English (3,279 | 10.8%), Irish (2,846 | 9.3%), German (2,827 | 9.3%), and Italian (2,140 | 7.0%), together accounting for 47.5% of all Princeton residents.
| Ancestry | # Population | % Population |
| African | 113 | 0.4% |
| Albanian | 23 | 0.1% |
| American | 969 | 3.2% |
| Arab | 499 | 1.6% |
| Argentinean | 69 | 0.2% |
| Armenian | 62 | 0.2% |
| Australian | 44 | 0.1% |
| Austrian | 173 | 0.6% |
| Bangladeshi | 11 | 0.0% |
| Belgian | 96 | 0.3% |
| Bhutanese | 403 | 1.3% |
| Brazilian | 75 | 0.3% |
| British | 376 | 1.2% |
| Bulgarian | 39 | 0.1% |
| Burmese | 794 | 2.6% |
| Canadian | 86 | 0.3% |
| Central American | 293 | 1.0% |
| Central American Indian | 52 | 0.2% |
| Cherokee | 21 | 0.1% |
| Chilean | 24 | 0.1% |
| Chippewa | 8 | 0.0% |
| Choctaw | 2 | 0.0% |
| Colombian | 122 | 0.4% |
| Costa Rican | 72 | 0.2% |
| Croatian | 63 | 0.2% |
| Cuban | 147 | 0.5% |
| Czech | 137 | 0.4% |
| Czechoslovakian | 13 | 0.0% |
| Danish | 264 | 0.9% |
| Dominican | 68 | 0.2% |
| Dutch | 259 | 0.9% |
| Eastern European | 410 | 1.3% |
| Ecuadorian | 129 | 0.4% |
| Egyptian | 273 | 0.9% |
| English | 3,279 | 10.8% |
| Ethiopian | 62 | 0.2% |
| European | 484 | 1.6% |
| Filipino | 208 | 0.7% |
| Finnish | 41 | 0.1% |
| French | 1,300 | 4.3% |
| French Canadian | 149 | 0.5% |
| German | 2,827 | 9.3% |
| Ghanaian | 18 | 0.1% |
| Greek | 187 | 0.6% |
| Guatemalan | 142 | 0.5% |
| Guyanese | 10 | 0.0% |
| Haitian | 404 | 1.3% |
| Honduran | 69 | 0.2% |
| Hungarian | 328 | 1.1% |
| Indian (Asian) | 3,363 | 11.0% |
| Iranian | 62 | 0.2% |
| Irish | 2,846 | 9.3% |
| Israeli | 209 | 0.7% |
| Italian | 2,140 | 7.0% |
| Jamaican | 55 | 0.2% |
| Kenyan | 51 | 0.2% |
| Korean | 380 | 1.3% |
| Laotian | 24 | 0.1% |
| Latvian | 4 | 0.0% |
| Lebanese | 110 | 0.4% |
| Liberian | 16 | 0.1% |
| Lithuanian | 107 | 0.4% |
| Macedonian | 29 | 0.1% |
| Malaysian | 4 | 0.0% |
| Mexican | 393 | 1.3% |
| Mexican American Indian | 52 | 0.2% |
| Mongolian | 58 | 0.2% |
| Moroccan | 37 | 0.1% |
| Native Hawaiian | 5 | 0.0% |
| New Zealander | 6 | 0.0% |
| Nigerian | 69 | 0.2% |
| Northern European | 104 | 0.3% |
| Norwegian | 194 | 0.6% |
| Okinawan | 39 | 0.1% |
| Pakistani | 34 | 0.1% |
| Palestinian | 111 | 0.4% |
| Panamanian | 10 | 0.0% |
| Paraguayan | 3 | 0.0% |
| Pennsylvania German | 12 | 0.0% |
| Peruvian | 19 | 0.1% |
| Polish | 1,128 | 3.7% |
| Portuguese | 146 | 0.5% |
| Puerto Rican | 410 | 1.3% |
| Romanian | 77 | 0.3% |
| Russian | 1,208 | 4.0% |
| Scandinavian | 51 | 0.2% |
| Scotch-Irish | 125 | 0.4% |
| Scottish | 498 | 1.6% |
| Serbian | 44 | 0.1% |
| Sioux | 3 | 0.0% |
| Slavic | 34 | 0.1% |
| Slovak | 23 | 0.1% |
| Slovene | 31 | 0.1% |
| Somali | 11 | 0.0% |
| South African | 26 | 0.1% |
| South American | 387 | 1.3% |
| South American Indian | 17 | 0.1% |
| Spaniard | 130 | 0.4% |
| Spanish | 37 | 0.1% |
| Sri Lankan | 171 | 0.6% |
| Subsaharan African | 402 | 1.3% |
| Swedish | 315 | 1.0% |
| Swiss | 107 | 0.4% |
| Syrian | 23 | 0.1% |
| Thai | 1,328 | 4.4% |
| Trinidadian and Tobagonian | 23 | 0.1% |
| Turkish | 226 | 0.7% |
| Ugandan | 8 | 0.0% |
| Ukrainian | 261 | 0.9% |
| Uruguayan | 13 | 0.0% |
| Venezuelan | 8 | 0.0% |
| Vietnamese | 12 | 0.0% |
| Welsh | 169 | 0.6% |
| West Indian | 1 | 0.0% |
| Yugoslavian | 102 | 0.3% | View All 115 Rows |
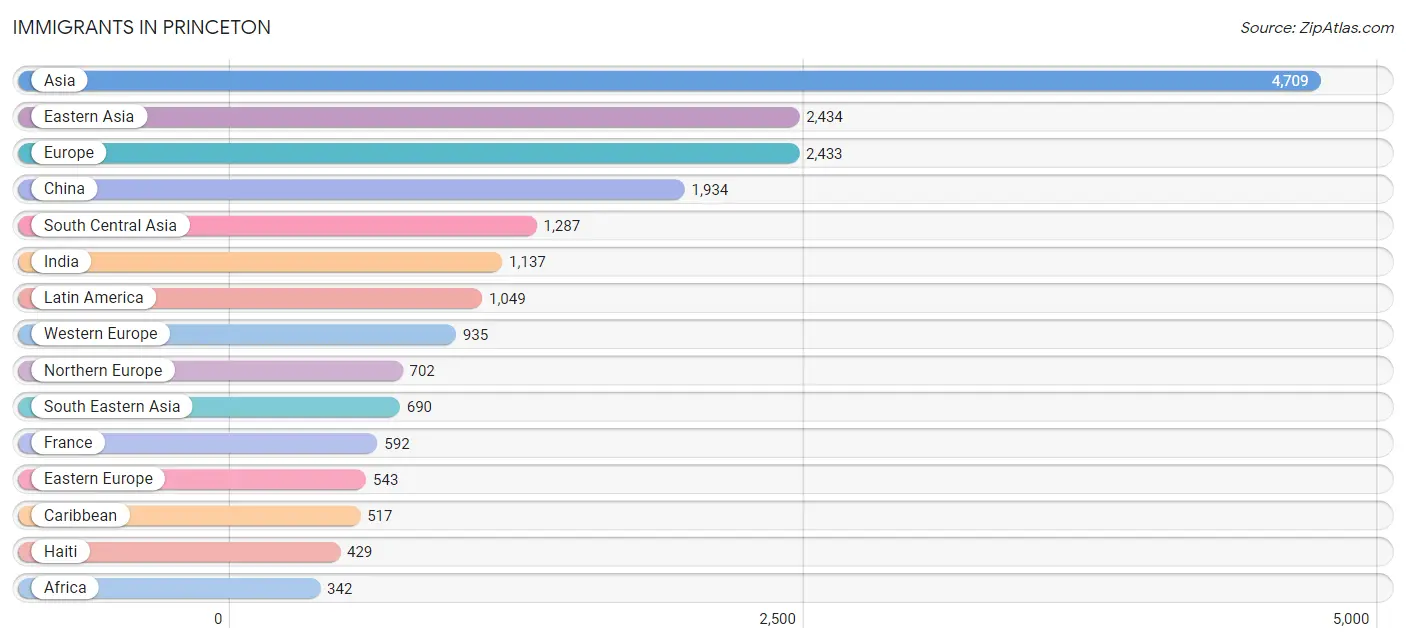
Immigrants in Princeton
The most numerous immigrant groups reported in Princeton came from Asia (4,709 | 15.5%), Eastern Asia (2,434 | 8.0%), Europe (2,433 | 8.0%), China (1,934 | 6.4%), and South Central Asia (1,287 | 4.2%), together accounting for 42.0% of all Princeton residents.
| Immigration Origin | # Population | % Population |
| Africa | 342 | 1.1% |
| Albania | 5 | 0.0% |
| Argentina | 18 | 0.1% |
| Asia | 4,709 | 15.5% |
| Australia | 104 | 0.3% |
| Austria | 20 | 0.1% |
| Belgium | 27 | 0.1% |
| Brazil | 101 | 0.3% |
| Bulgaria | 44 | 0.1% |
| Cabo Verde | 38 | 0.1% |
| Canada | 211 | 0.7% |
| Caribbean | 517 | 1.7% |
| Central America | 284 | 0.9% |
| Chile | 15 | 0.1% |
| China | 1,934 | 6.4% |
| Colombia | 24 | 0.1% |
| Costa Rica | 15 | 0.1% |
| Cuba | 16 | 0.1% |
| Denmark | 118 | 0.4% |
| Dominica | 6 | 0.0% |
| Dominican Republic | 18 | 0.1% |
| Eastern Africa | 117 | 0.4% |
| Eastern Asia | 2,434 | 8.0% |
| Eastern Europe | 543 | 1.8% |
| Ecuador | 11 | 0.0% |
| Egypt | 65 | 0.2% |
| England | 162 | 0.5% |
| Ethiopia | 22 | 0.1% |
| Europe | 2,433 | 8.0% |
| France | 592 | 1.9% |
| Germany | 200 | 0.7% |
| Ghana | 11 | 0.0% |
| Greece | 66 | 0.2% |
| Guatemala | 103 | 0.3% |
| Guyana | 47 | 0.2% |
| Haiti | 429 | 1.4% |
| Honduras | 21 | 0.1% |
| Hong Kong | 18 | 0.1% |
| Hungary | 18 | 0.1% |
| India | 1,137 | 3.7% |
| Indonesia | 4 | 0.0% |
| Iran | 31 | 0.1% |
| Ireland | 42 | 0.1% |
| Israel | 212 | 0.7% |
| Italy | 132 | 0.4% |
| Jamaica | 19 | 0.1% |
| Japan | 207 | 0.7% |
| Kenya | 29 | 0.1% |
| Korea | 293 | 1.0% |
| Latin America | 1,049 | 3.4% |
| Lebanon | 34 | 0.1% |
| Liberia | 11 | 0.0% |
| Lithuania | 9 | 0.0% |
| Malaysia | 164 | 0.5% |
| Mexico | 145 | 0.5% |
| Middle Africa | 10 | 0.0% |
| Moldova | 19 | 0.1% |
| Morocco | 28 | 0.1% |
| Nepal | 4 | 0.0% |
| Netherlands | 96 | 0.3% |
| Nigeria | 25 | 0.1% |
| Northern Africa | 101 | 0.3% |
| Northern Europe | 702 | 2.3% |
| Norway | 31 | 0.1% |
| Oceania | 110 | 0.4% |
| Pakistan | 92 | 0.3% |
| Peru | 19 | 0.1% |
| Philippines | 155 | 0.5% |
| Poland | 15 | 0.1% |
| Romania | 37 | 0.1% |
| Russia | 250 | 0.8% |
| Serbia | 11 | 0.0% |
| Singapore | 288 | 0.9% |
| South Africa | 29 | 0.1% |
| South America | 248 | 0.8% |
| South Central Asia | 1,287 | 4.2% |
| South Eastern Asia | 690 | 2.3% |
| Southern Europe | 253 | 0.8% |
| Spain | 55 | 0.2% |
| Sri Lanka | 23 | 0.1% |
| St. Vincent and the Grenadines | 6 | 0.0% |
| Sweden | 95 | 0.3% |
| Taiwan | 180 | 0.6% |
| Trinidad and Tobago | 23 | 0.1% |
| Turkey | 52 | 0.2% |
| Uganda | 12 | 0.0% |
| Ukraine | 79 | 0.3% |
| Vietnam | 75 | 0.3% |
| Western Africa | 85 | 0.3% |
| Western Asia | 298 | 1.0% |
| Western Europe | 935 | 3.1% |
| Zaire | 10 | 0.0% |
| Zimbabwe | 8 | 0.0% | View All 93 Rows |
Sex and Age in Princeton
Sex and Age in Princeton
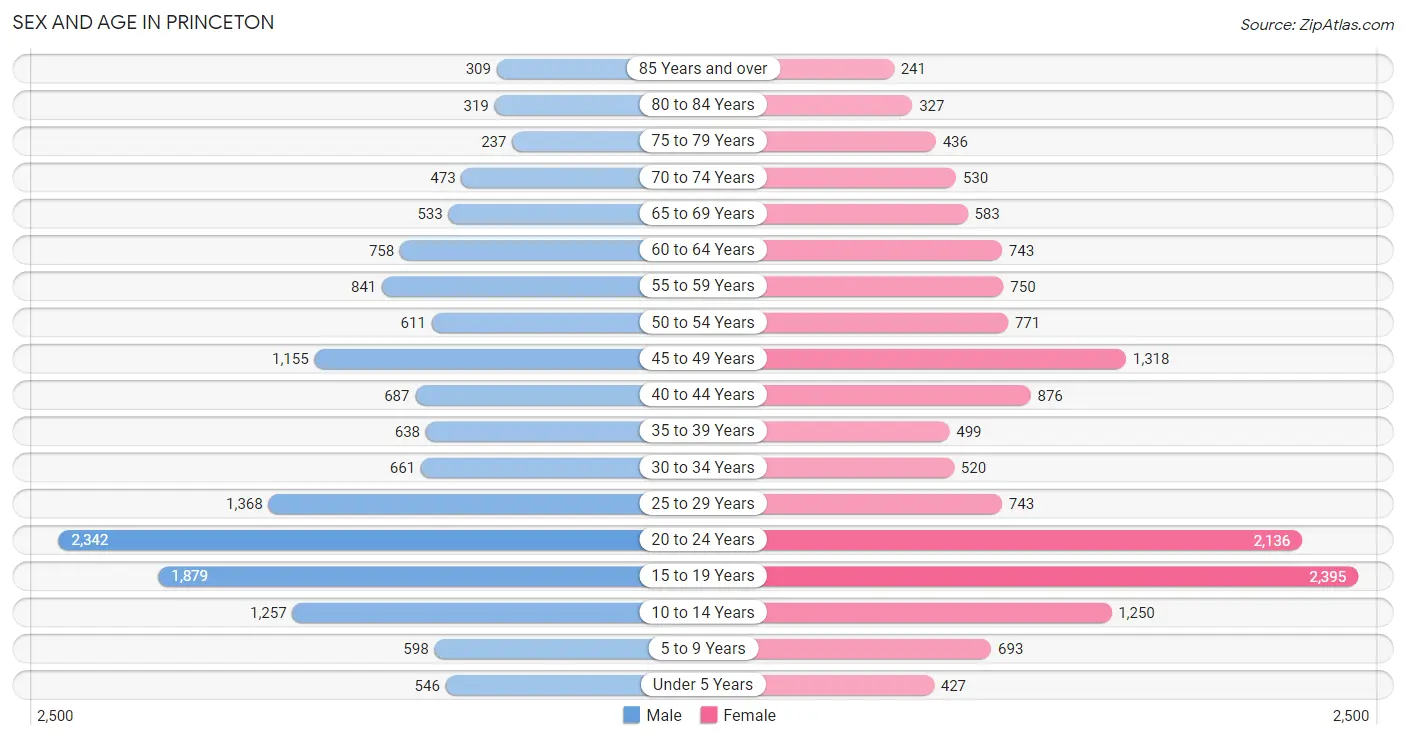
The most populous age groups in Princeton are 20 to 24 Years (2,342 | 15.4%) for men and 15 to 19 Years (2,395 | 15.7%) for women.
| Age Bracket | Male | Female |
| Under 5 Years | 546 (3.6%) | 427 (2.8%) |
| 5 to 9 Years | 598 (3.9%) | 693 (4.5%) |
| 10 to 14 Years | 1,257 (8.3%) | 1,250 (8.2%) |
| 15 to 19 Years | 1,879 (12.3%) | 2,395 (15.7%) |
| 20 to 24 Years | 2,342 (15.4%) | 2,136 (14.0%) |
| 25 to 29 Years | 1,368 (9.0%) | 743 (4.9%) |
| 30 to 34 Years | 661 (4.3%) | 520 (3.4%) |
| 35 to 39 Years | 638 (4.2%) | 499 (3.3%) |
| 40 to 44 Years | 687 (4.5%) | 876 (5.8%) |
| 45 to 49 Years | 1,155 (7.6%) | 1,318 (8.6%) |
| 50 to 54 Years | 611 (4.0%) | 771 (5.1%) |
| 55 to 59 Years | 841 (5.5%) | 750 (4.9%) |
| 60 to 64 Years | 758 (5.0%) | 743 (4.9%) |
| 65 to 69 Years | 533 (3.5%) | 583 (3.8%) |
| 70 to 74 Years | 473 (3.1%) | 530 (3.5%) |
| 75 to 79 Years | 237 (1.6%) | 436 (2.9%) |
| 80 to 84 Years | 319 (2.1%) | 327 (2.1%) |
| 85 Years and over | 309 (2.0%) | 241 (1.6%) |
| Total | 15,212 (100.0%) | 15,238 (100.0%) |
Families and Households in Princeton
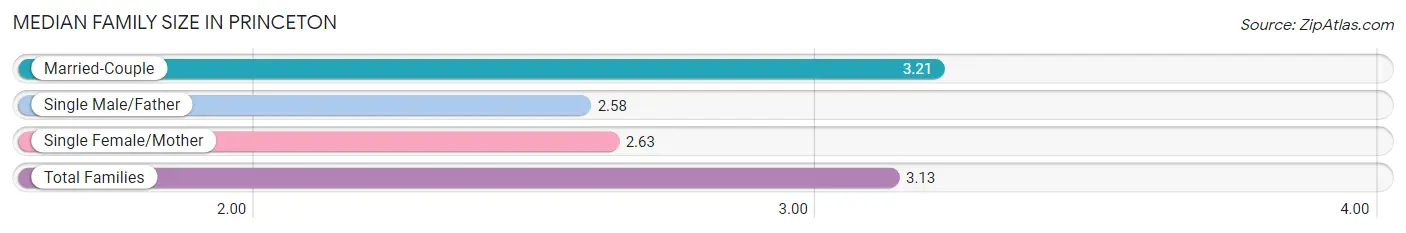
Median Family Size in Princeton
The median family size in Princeton is 3.13 persons per family, with married-couple families (5,343 | 87.3%) accounting for the largest median family size of 3.21 persons per family. On the other hand, single male/father families (259 | 4.2%) represent the smallest median family size with 2.58 persons per family.
| Family Type | # Families | Family Size |
| Married-Couple | 5,343 (87.3%) | 3.21 |
| Single Male/Father | 259 (4.2%) | 2.58 |
| Single Female/Mother | 521 (8.5%) | 2.63 |
| Total Families | 6,123 (100.0%) | 3.13 |
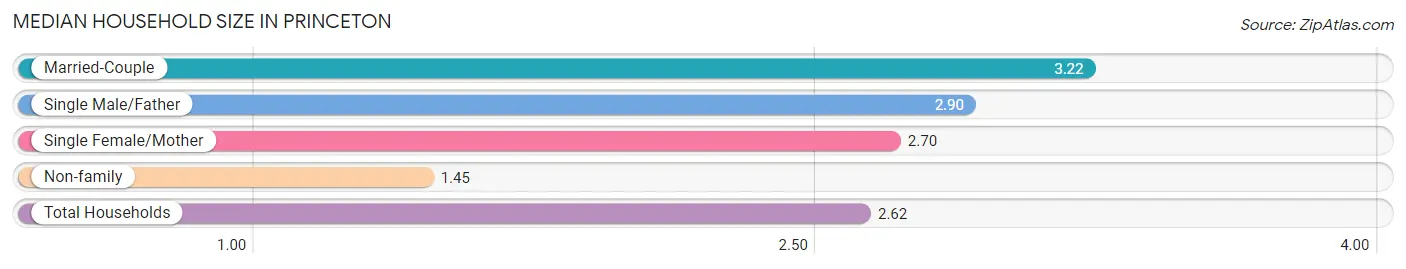
Median Household Size in Princeton
The median household size in Princeton is 2.62 persons per household, with married-couple households (5,343 | 59.7%) accounting for the largest median household size of 3.22 persons per household. non-family households (2,828 | 31.6%) represent the smallest median household size with 1.45 persons per household.
| Household Type | # Households | Household Size |
| Married-Couple | 5,343 (59.7%) | 3.22 |
| Single Male/Father | 259 (2.9%) | 2.90 |
| Single Female/Mother | 521 (5.8%) | 2.70 |
| Non-family | 2,828 (31.6%) | 1.45 |
| Total Households | 8,951 (100.0%) | 2.62 |
Household Size by Marriage Status in Princeton
Out of a total of 8,951 households in Princeton, 6,123 (68.4%) are family households, while 2,828 (31.6%) are nonfamily households. The most numerous type of family households are 2-person households, comprising 2,480, and the most common type of nonfamily households are 1-person households, comprising 2,203.
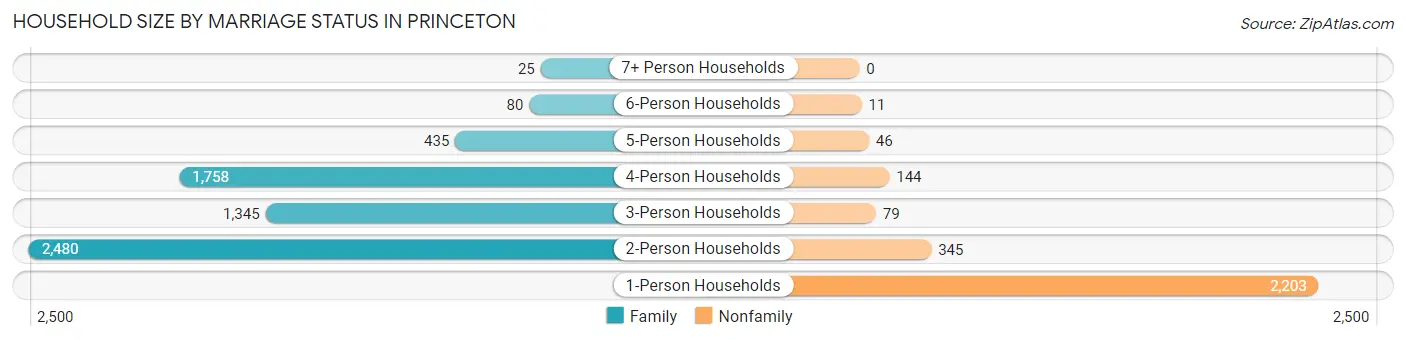
| Household Size | Family Households | Nonfamily Households |
| 1-Person Households | - | 2,203 (24.6%) |
| 2-Person Households | 2,480 (27.7%) | 345 (3.8%) |
| 3-Person Households | 1,345 (15.0%) | 79 (0.9%) |
| 4-Person Households | 1,758 (19.6%) | 144 (1.6%) |
| 5-Person Households | 435 (4.9%) | 46 (0.5%) |
| 6-Person Households | 80 (0.9%) | 11 (0.1%) |
| 7+ Person Households | 25 (0.3%) | 0 (0.0%) |
| Total | 6,123 (68.4%) | 2,828 (31.6%) |
Female Fertility in Princeton
Fertility by Age in Princeton
Average fertility rate in Princeton is 11.0 births per 1,000 women. Women in the age bracket of 35 to 50 years have the highest fertility rate with 19.0 births per 1,000 women. Women in the age bracket of 35 to 50 years acount for 59.6% of all women with births.
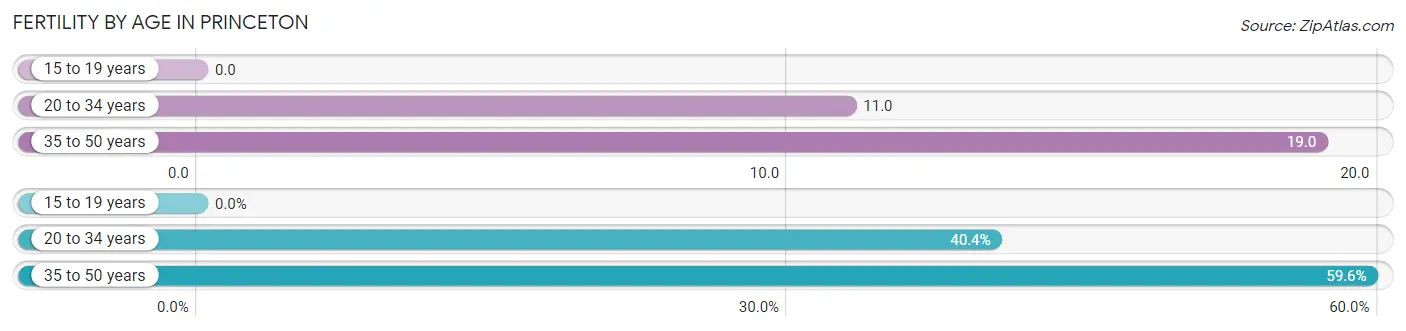
| Age Bracket | Women with Births | Births / 1,000 Women |
| 15 to 19 years | 0 (0.0%) | 0.0 |
| 20 to 34 years | 38 (40.4%) | 11.0 |
| 35 to 50 years | 56 (59.6%) | 19.0 |
| Total | 94 (100.0%) | 11.0 |
Fertility by Age by Marriage Status in Princeton
88.3% of women with births (94) in Princeton are married. The highest percentage of unmarried women with births falls into 35 to 50 years age bracket with 19.6% of them unmarried at the time of birth, while the lowest percentage of unmarried women with births belong to 20 to 34 years age bracket with 0.0% of them unmarried.
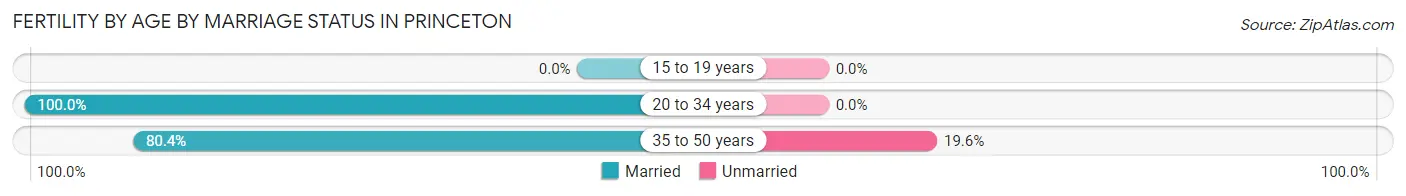
| Age Bracket | Married | Unmarried |
| 15 to 19 years | 0 (0.0%) | 0 (0.0%) |
| 20 to 34 years | 38 (100.0%) | 0 (0.0%) |
| 35 to 50 years | 45 (80.4%) | 11 (19.6%) |
| Total | 83 (88.3%) | 11 (11.7%) |
Fertility by Education in Princeton
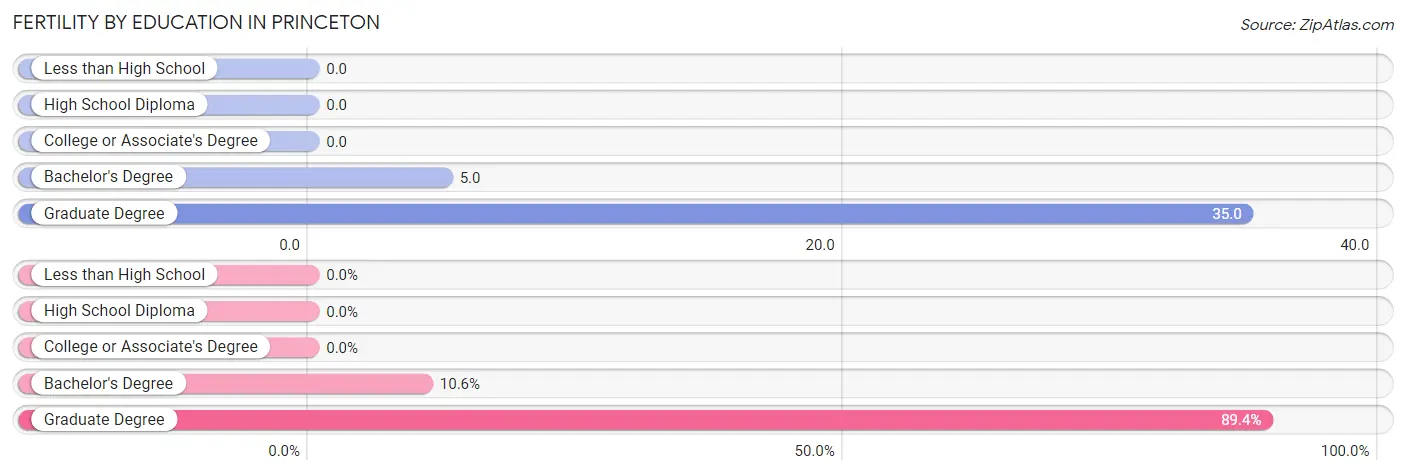
| Educational Attainment | Women with Births | Births / 1,000 Women |
| Less than High School | 0 (0.0%) | 0.0 |
| High School Diploma | 0 (0.0%) | 0.0 |
| College or Associate's Degree | 0 (0.0%) | 0.0 |
| Bachelor's Degree | 10 (10.6%) | 5.0 |
| Graduate Degree | 84 (89.4%) | 35.0 |
| Total | 94 (100.0%) | 11.0 |
Fertility by Education by Marriage Status in Princeton
11.7% of women with births in Princeton are unmarried. Women with the educational attainment of bachelor's degree are most likely to be married with 100.0% of them married at childbirth, while women with the educational attainment of graduate degree are least likely to be married with 13.1% of them unmarried at childbirth.
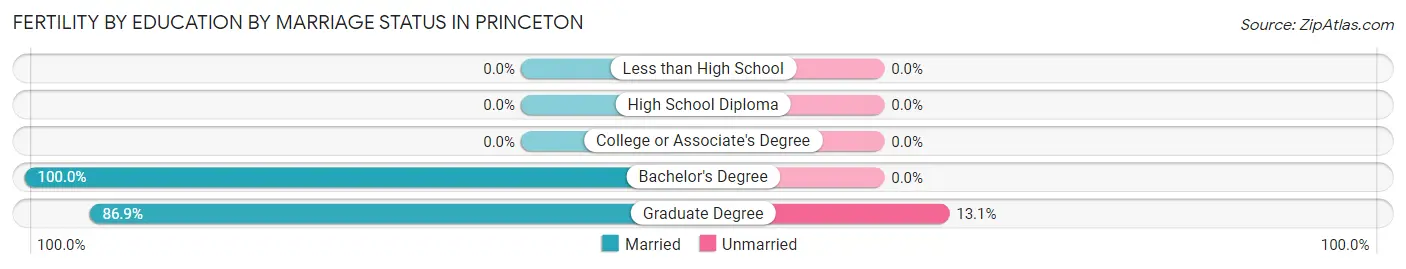
| Educational Attainment | Married | Unmarried |
| Less than High School | 0 (0.0%) | 0 (0.0%) |
| High School Diploma | 0 (0.0%) | 0 (0.0%) |
| College or Associate's Degree | 0 (0.0%) | 0 (0.0%) |
| Bachelor's Degree | 10 (100.0%) | 0 (0.0%) |
| Graduate Degree | 73 (86.9%) | 11 (13.1%) |
| Total | 83 (88.3%) | 11 (11.7%) |
Employment Characteristics in Princeton
Employment by Class of Employer in Princeton
Among the 14,076 employed individuals in Princeton, private company employees (7,544 | 53.6%), not-for-profit organizations (3,810 | 27.1%), and self-employed (not incorporated) (932 | 6.6%) make up the most common classes of employment.
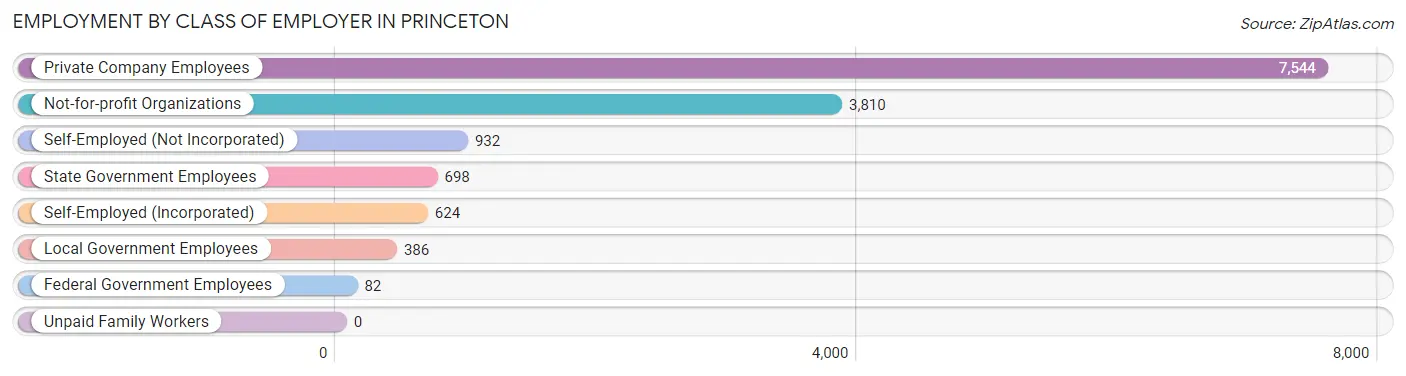
| Employer Class | # Employees | % Employees |
| Private Company Employees | 7,544 | 53.6% |
| Self-Employed (Incorporated) | 624 | 4.4% |
| Self-Employed (Not Incorporated) | 932 | 6.6% |
| Not-for-profit Organizations | 3,810 | 27.1% |
| Local Government Employees | 386 | 2.7% |
| State Government Employees | 698 | 5.0% |
| Federal Government Employees | 82 | 0.6% |
| Unpaid Family Workers | 0 | 0.0% |
| Total | 14,076 | 100.0% |
Employment Status by Age in Princeton
According to the labor force statistics for Princeton, out of the total population over 16 years of age (25,308), 61.7% or 15,615 individuals are in the labor force, with 4.8% or 750 of them unemployed. The age group with the highest labor force participation rate is 35 to 44 years, with 91.3% or 2,465 individuals in the labor force. Within the labor force, the 16 to 19 years age range has the highest percentage of unemployed individuals, with 17.3% or 203 of them being unemployed.
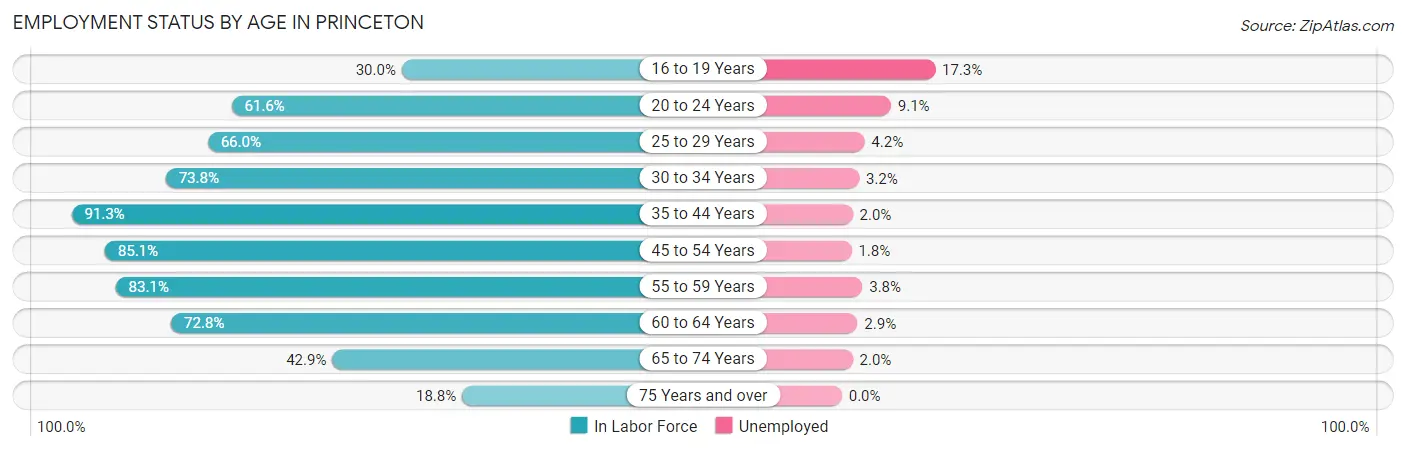
| Age Bracket | In Labor Force | Unemployed |
| 16 to 19 Years | 1,171 (30.0%) | 203 (17.3%) |
| 20 to 24 Years | 2,758 (61.6%) | 251 (9.1%) |
| 25 to 29 Years | 1,393 (66.0%) | 59 (4.2%) |
| 30 to 34 Years | 872 (73.8%) | 28 (3.2%) |
| 35 to 44 Years | 2,465 (91.3%) | 49 (2.0%) |
| 45 to 54 Years | 3,281 (85.1%) | 59 (1.8%) |
| 55 to 59 Years | 1,322 (83.1%) | 50 (3.8%) |
| 60 to 64 Years | 1,093 (72.8%) | 32 (2.9%) |
| 65 to 74 Years | 909 (42.9%) | 18 (2.0%) |
| 75 Years and over | 351 (18.8%) | 0 (0.0%) |
| Total | 15,615 (61.7%) | 750 (4.8%) |
Employment Status by Educational Attainment in Princeton
According to labor force statistics for Princeton, 80.6% of individuals (10,429) out of the total population between 25 and 64 years of age (12,939) are in the labor force, with 2.6% or 271 of them being unemployed. The group with the highest labor force participation rate are those with the educational attainment of bachelor's degree or higher, with 82.8% or 9,481 individuals in the labor force. Within the labor force, individuals with college / associate degree education have the highest percentage of unemployment, with 6.7% or 31 of them being unemployed.
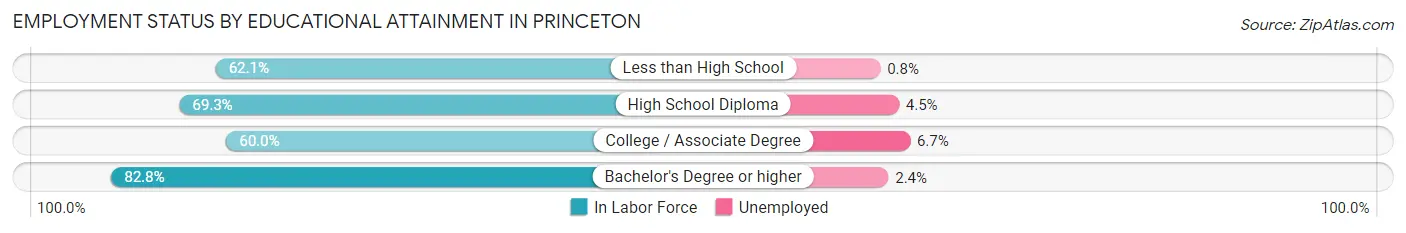
| Educational Attainment | In Labor Force | Unemployed |
| Less than High School | 128 (62.1%) | 2 (0.8%) |
| High School Diploma | 354 (69.3%) | 23 (4.5%) |
| College / Associate Degree | 463 (60.0%) | 52 (6.7%) |
| Bachelor's Degree or higher | 9,481 (82.8%) | 275 (2.4%) |
| Total | 10,429 (80.6%) | 336 (2.6%) |
Employment Occupations by Sex in Princeton
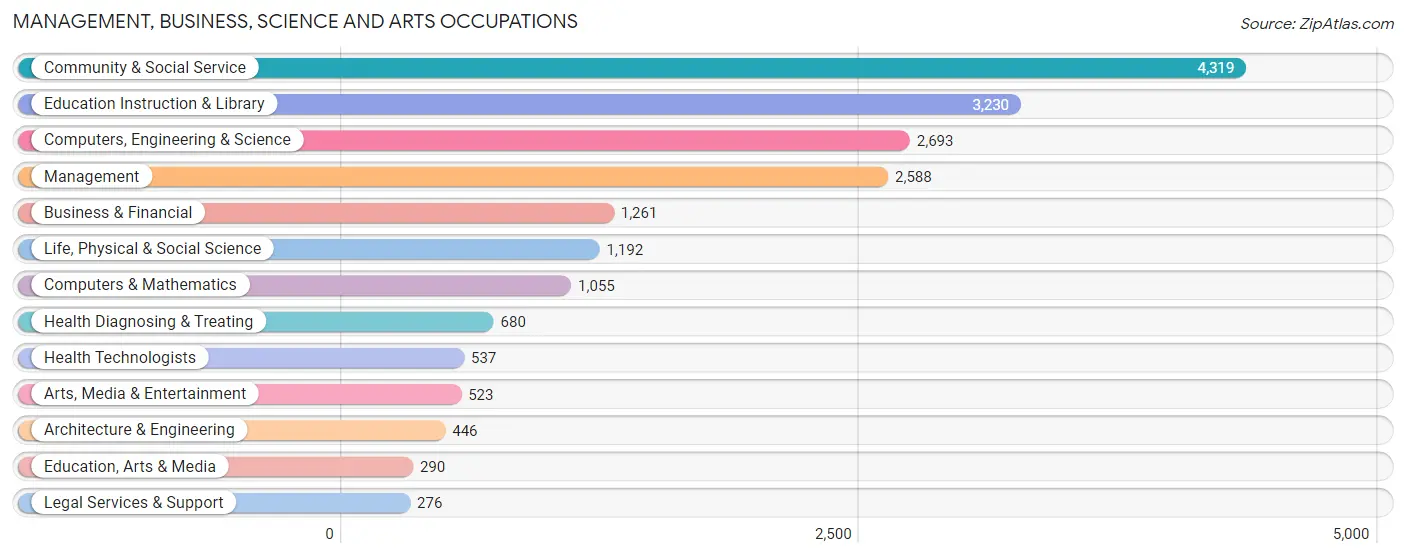
Management, Business, Science and Arts Occupations
The most common Management, Business, Science and Arts occupations in Princeton are Community & Social Service (4,319 | 29.0%), Education Instruction & Library (3,230 | 21.7%), Computers, Engineering & Science (2,693 | 18.1%), Management (2,588 | 17.4%), and Business & Financial (1,261 | 8.5%).
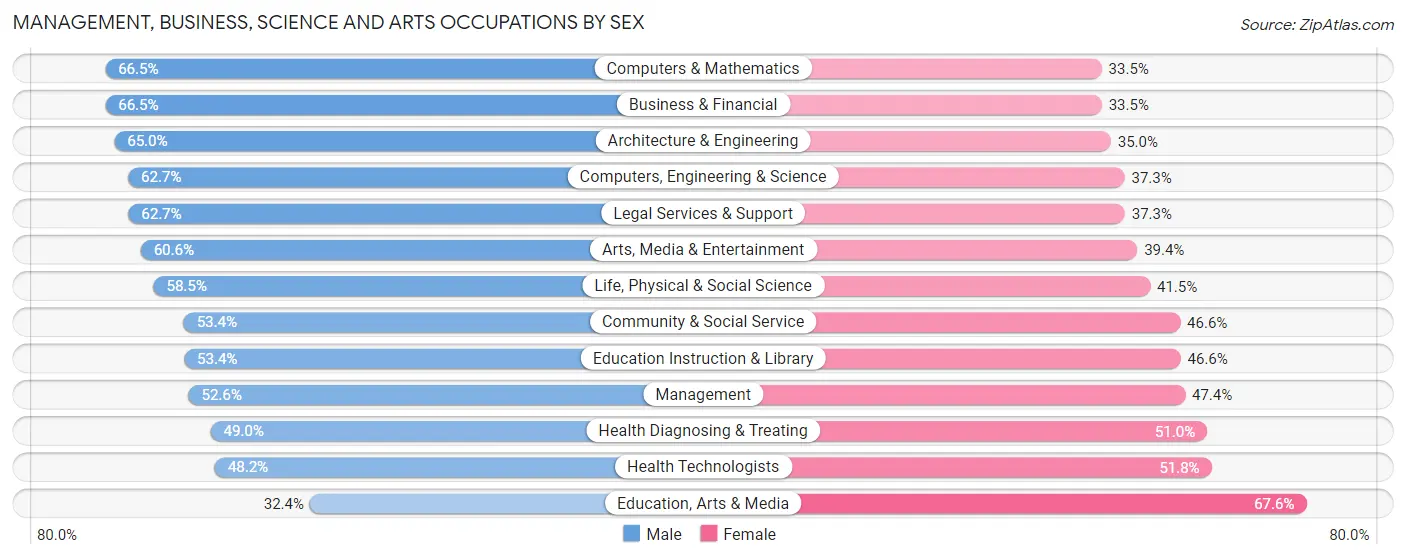
Management, Business, Science and Arts Occupations by Sex
Within the Management, Business, Science and Arts occupations in Princeton, the most male-oriented occupations are Computers & Mathematics (66.5%), Business & Financial (66.5%), and Architecture & Engineering (65.0%), while the most female-oriented occupations are Education, Arts & Media (67.6%), Health Technologists (51.8%), and Health Diagnosing & Treating (51.0%).
| Occupation | Male | Female |
| Management | 1,362 (52.6%) | 1,226 (47.4%) |
| Business & Financial | 839 (66.5%) | 422 (33.5%) |
| Computers, Engineering & Science | 1,689 (62.7%) | 1,004 (37.3%) |
| Computers & Mathematics | 702 (66.5%) | 353 (33.5%) |
| Architecture & Engineering | 290 (65.0%) | 156 (35.0%) |
| Life, Physical & Social Science | 697 (58.5%) | 495 (41.5%) |
| Community & Social Service | 2,308 (53.4%) | 2,011 (46.6%) |
| Education, Arts & Media | 94 (32.4%) | 196 (67.6%) |
| Legal Services & Support | 173 (62.7%) | 103 (37.3%) |
| Education Instruction & Library | 1,724 (53.4%) | 1,506 (46.6%) |
| Arts, Media & Entertainment | 317 (60.6%) | 206 (39.4%) |
| Health Diagnosing & Treating | 333 (49.0%) | 347 (51.0%) |
| Health Technologists | 259 (48.2%) | 278 (51.8%) |
| Total (Category) | 6,531 (56.6%) | 5,010 (43.4%) |
| Total (Overall) | 8,121 (54.6%) | 6,747 (45.4%) |
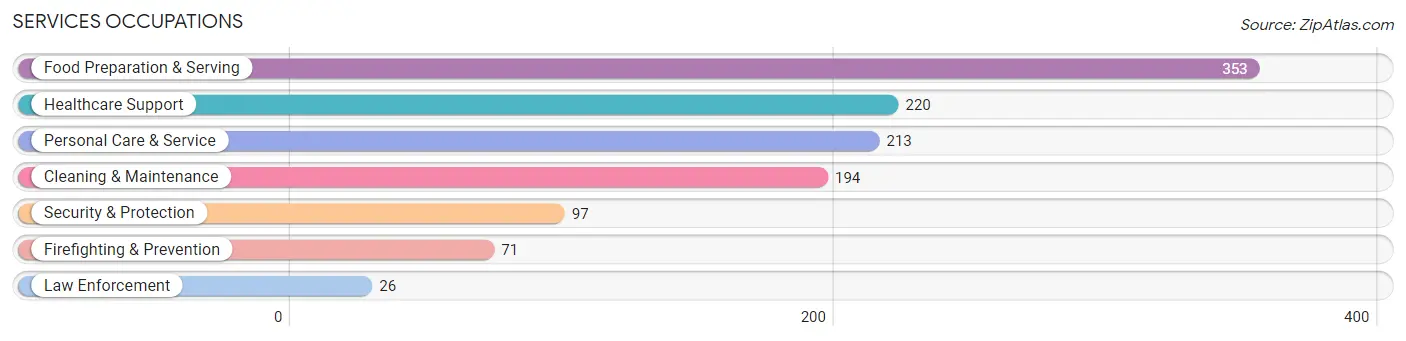
Services Occupations
The most common Services occupations in Princeton are Food Preparation & Serving (353 | 2.4%), Healthcare Support (220 | 1.5%), Personal Care & Service (213 | 1.4%), Cleaning & Maintenance (194 | 1.3%), and Security & Protection (97 | 0.6%).
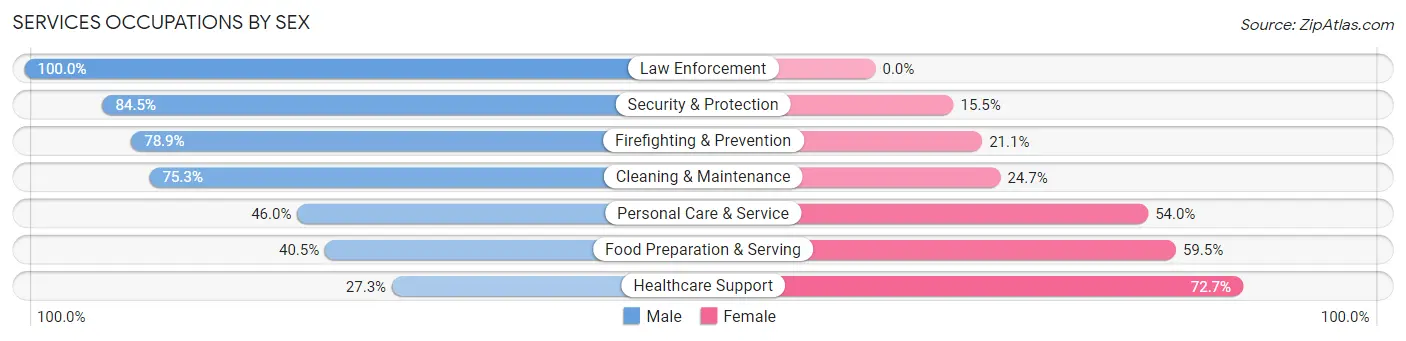
Services Occupations by Sex
Within the Services occupations in Princeton, the most male-oriented occupations are Law Enforcement (100.0%), Security & Protection (84.5%), and Firefighting & Prevention (78.9%), while the most female-oriented occupations are Healthcare Support (72.7%), Food Preparation & Serving (59.5%), and Personal Care & Service (54.0%).
| Occupation | Male | Female |
| Healthcare Support | 60 (27.3%) | 160 (72.7%) |
| Security & Protection | 82 (84.5%) | 15 (15.5%) |
| Firefighting & Prevention | 56 (78.9%) | 15 (21.1%) |
| Law Enforcement | 26 (100.0%) | 0 (0.0%) |
| Food Preparation & Serving | 143 (40.5%) | 210 (59.5%) |
| Cleaning & Maintenance | 146 (75.3%) | 48 (24.7%) |
| Personal Care & Service | 98 (46.0%) | 115 (54.0%) |
| Total (Category) | 529 (49.1%) | 548 (50.9%) |
| Total (Overall) | 8,121 (54.6%) | 6,747 (45.4%) |
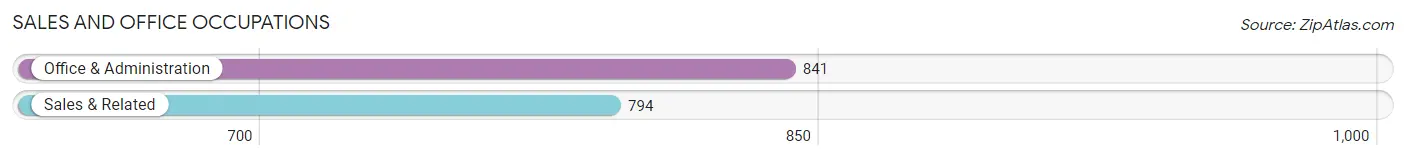
Sales and Office Occupations
The most common Sales and Office occupations in Princeton are Office & Administration (841 | 5.7%), and Sales & Related (794 | 5.3%).
Sales and Office Occupations by Sex
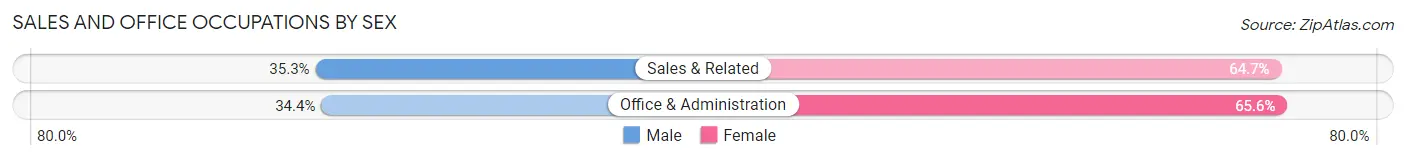
| Occupation | Male | Female |
| Sales & Related | 280 (35.3%) | 514 (64.7%) |
| Office & Administration | 289 (34.4%) | 552 (65.6%) |
| Total (Category) | 569 (34.8%) | 1,066 (65.2%) |
| Total (Overall) | 8,121 (54.6%) | 6,747 (45.4%) |
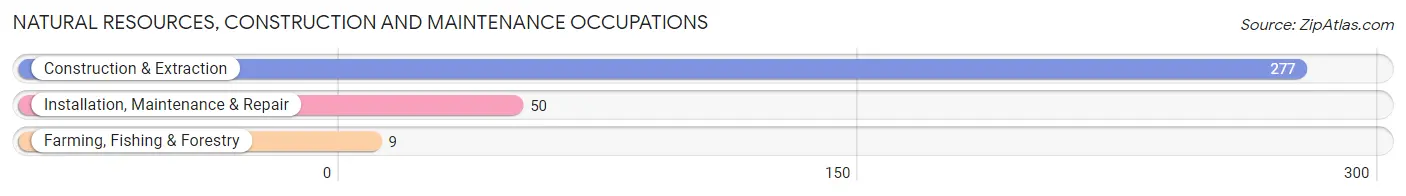
Natural Resources, Construction and Maintenance Occupations
The most common Natural Resources, Construction and Maintenance occupations in Princeton are Construction & Extraction (277 | 1.9%), Installation, Maintenance & Repair (50 | 0.3%), and Farming, Fishing & Forestry (9 | 0.1%).
Natural Resources, Construction and Maintenance Occupations by Sex
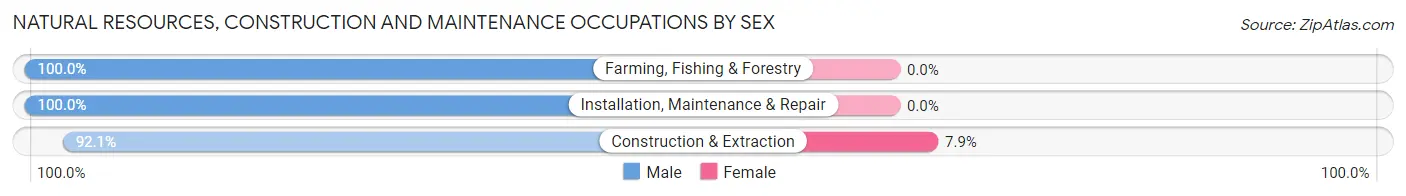
| Occupation | Male | Female |
| Farming, Fishing & Forestry | 9 (100.0%) | 0 (0.0%) |
| Construction & Extraction | 255 (92.1%) | 22 (7.9%) |
| Installation, Maintenance & Repair | 50 (100.0%) | 0 (0.0%) |
| Total (Category) | 314 (93.4%) | 22 (6.6%) |
| Total (Overall) | 8,121 (54.6%) | 6,747 (45.4%) |
Production, Transportation and Moving Occupations
The most common Production, Transportation and Moving occupations in Princeton are Material Moving (157 | 1.1%), Production (75 | 0.5%), and Transportation (47 | 0.3%).
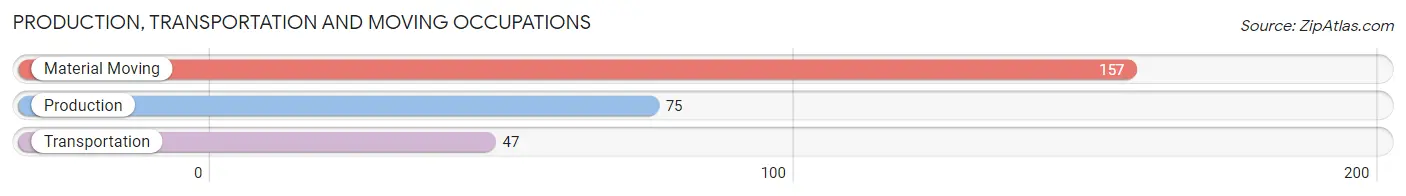
Production, Transportation and Moving Occupations by Sex
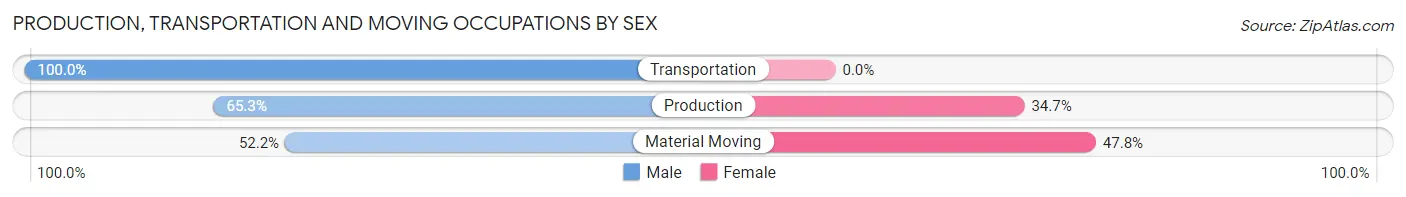
| Occupation | Male | Female |
| Production | 49 (65.3%) | 26 (34.7%) |
| Transportation | 47 (100.0%) | 0 (0.0%) |
| Material Moving | 82 (52.2%) | 75 (47.8%) |
| Total (Category) | 178 (63.8%) | 101 (36.2%) |
| Total (Overall) | 8,121 (54.6%) | 6,747 (45.4%) |
Employment Industries by Sex in Princeton
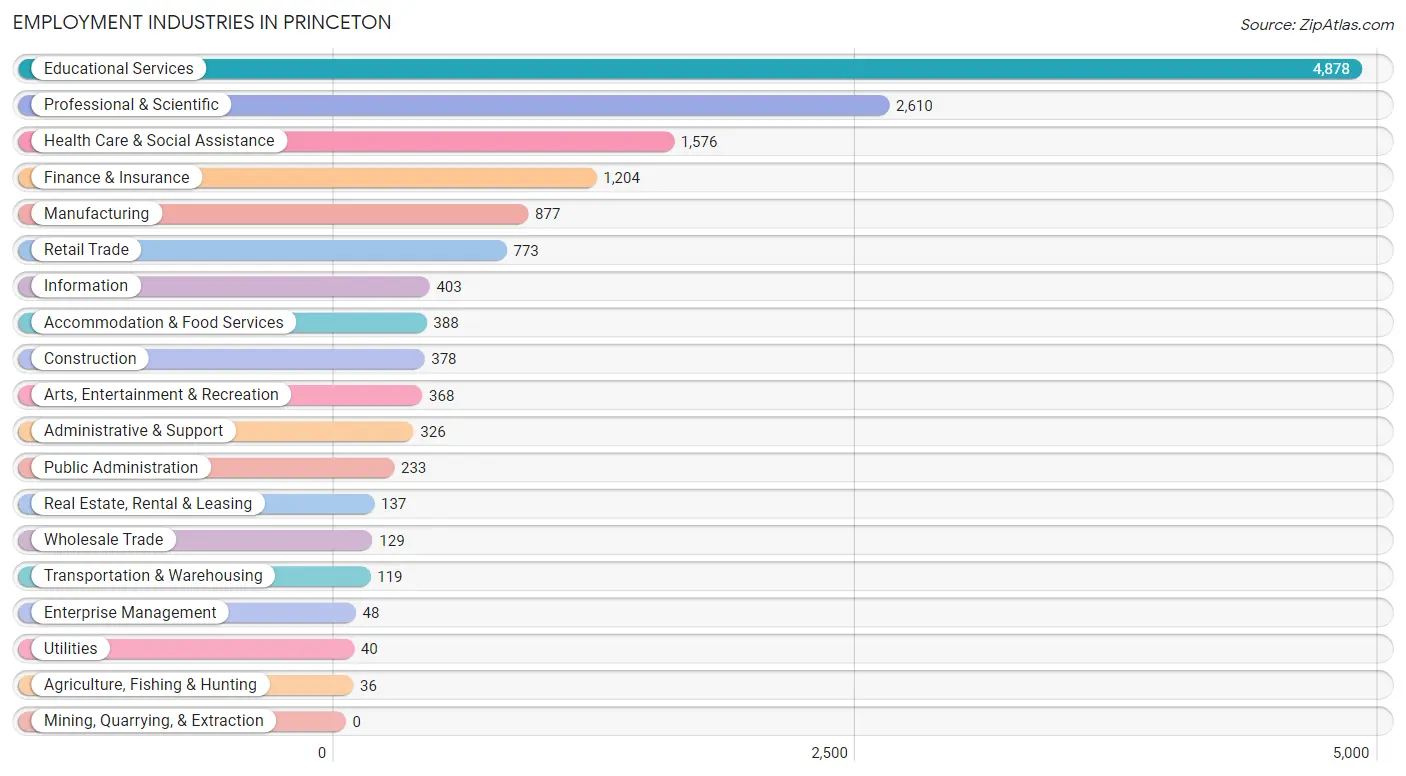
Employment Industries in Princeton
The major employment industries in Princeton include Educational Services (4,878 | 32.8%), Professional & Scientific (2,610 | 17.5%), Health Care & Social Assistance (1,576 | 10.6%), Finance & Insurance (1,204 | 8.1%), and Manufacturing (877 | 5.9%).
Employment Industries by Sex in Princeton
The Princeton industries that see more men than women are Construction (86.0%), Real Estate, Rental & Leasing (81.0%), and Finance & Insurance (75.2%), whereas the industries that tend to have a higher number of women are Health Care & Social Assistance (68.5%), Utilities (67.5%), and Accommodation & Food Services (66.5%).
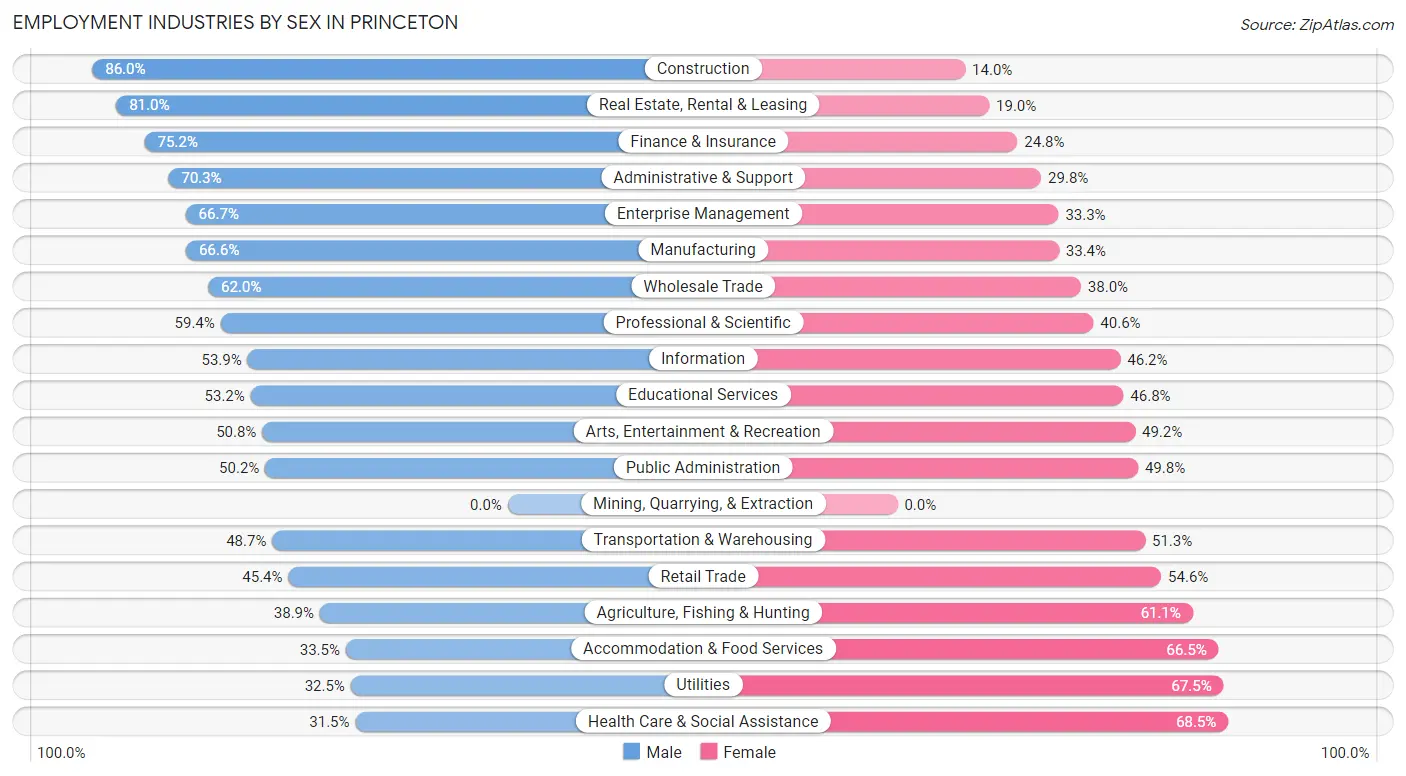
| Industry | Male | Female |
| Agriculture, Fishing & Hunting | 14 (38.9%) | 22 (61.1%) |
| Mining, Quarrying, & Extraction | 0 (0.0%) | 0 (0.0%) |
| Construction | 325 (86.0%) | 53 (14.0%) |
| Manufacturing | 584 (66.6%) | 293 (33.4%) |
| Wholesale Trade | 80 (62.0%) | 49 (38.0%) |
| Retail Trade | 351 (45.4%) | 422 (54.6%) |
| Transportation & Warehousing | 58 (48.7%) | 61 (51.3%) |
| Utilities | 13 (32.5%) | 27 (67.5%) |
| Information | 217 (53.8%) | 186 (46.2%) |
| Finance & Insurance | 905 (75.2%) | 299 (24.8%) |
| Real Estate, Rental & Leasing | 111 (81.0%) | 26 (19.0%) |
| Professional & Scientific | 1,551 (59.4%) | 1,059 (40.6%) |
| Enterprise Management | 32 (66.7%) | 16 (33.3%) |
| Administrative & Support | 229 (70.3%) | 97 (29.7%) |
| Educational Services | 2,596 (53.2%) | 2,282 (46.8%) |
| Health Care & Social Assistance | 497 (31.5%) | 1,079 (68.5%) |
| Arts, Entertainment & Recreation | 187 (50.8%) | 181 (49.2%) |
| Accommodation & Food Services | 130 (33.5%) | 258 (66.5%) |
| Public Administration | 117 (50.2%) | 116 (49.8%) |
| Total | 8,121 (54.6%) | 6,747 (45.4%) |
Education in Princeton
School Enrollment in Princeton
The most common levels of schooling among the 13,931 students in Princeton are college / undergraduate (6,322 | 45.4%), graduate / professional (2,310 | 16.6%), and middle school (1,710 | 12.3%).
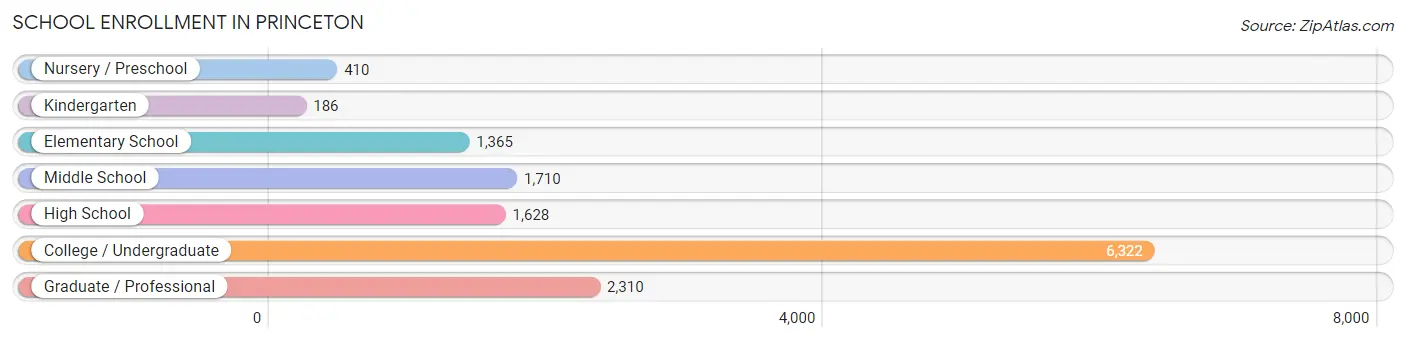
| School Level | # Students | % Students |
| Nursery / Preschool | 410 | 2.9% |
| Kindergarten | 186 | 1.3% |
| Elementary School | 1,365 | 9.8% |
| Middle School | 1,710 | 12.3% |
| High School | 1,628 | 11.7% |
| College / Undergraduate | 6,322 | 45.4% |
| Graduate / Professional | 2,310 | 16.6% |
| Total | 13,931 | 100.0% |
School Enrollment by Age by Funding Source in Princeton
Out of a total of 13,931 students who are enrolled in schools in Princeton, 7,982 (57.3%) attend a private institution, while the remaining 5,949 (42.7%) are enrolled in public schools. The age group of 25 to 34 year olds has the highest likelihood of being enrolled in private schools, with 1,207 (91.8% in the age bracket) enrolled. Conversely, the age group of 10 to 14 year olds has the lowest likelihood of being enrolled in a private school, with 2,131 (87.1% in the age bracket) attending a public institution.
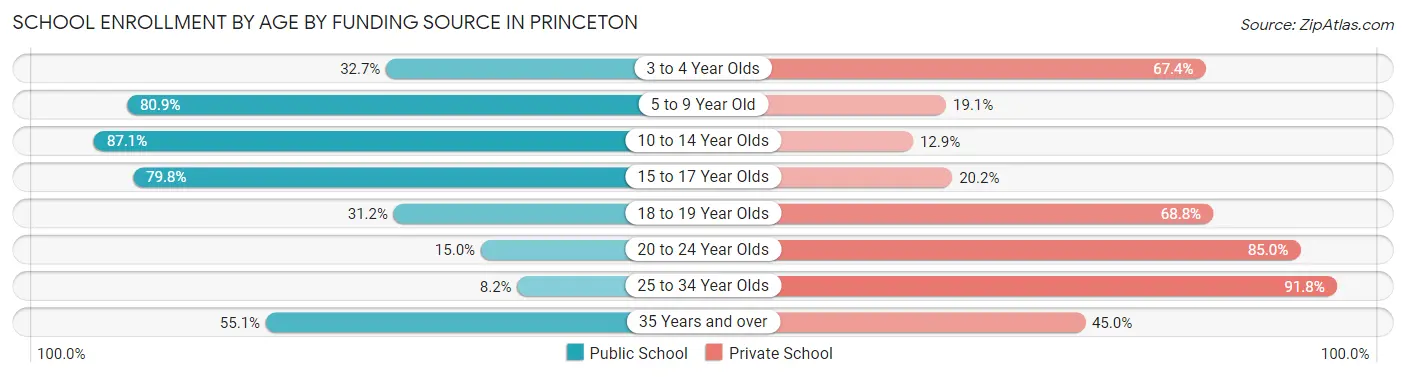
| Age Bracket | Public School | Private School |
| 3 to 4 Year Olds | 112 (32.7%) | 231 (67.3%) |
| 5 to 9 Year Old | 1,018 (80.9%) | 240 (19.1%) |
| 10 to 14 Year Olds | 2,131 (87.1%) | 316 (12.9%) |
| 15 to 17 Year Olds | 801 (79.8%) | 203 (20.2%) |
| 18 to 19 Year Olds | 974 (31.2%) | 2,145 (68.8%) |
| 20 to 24 Year Olds | 618 (15.0%) | 3,500 (85.0%) |
| 25 to 34 Year Olds | 108 (8.2%) | 1,207 (91.8%) |
| 35 Years and over | 180 (55.0%) | 147 (45.0%) |
| Total | 5,949 (42.7%) | 7,982 (57.3%) |
Educational Attainment by Field of Study in Princeton
Social sciences (2,077 | 13.2%), business (1,931 | 12.3%), literature & languages (1,514 | 9.6%), physical & health sciences (1,499 | 9.5%), and liberal arts & history (1,485 | 9.4%) are the most common fields of study among 15,732 individuals in Princeton who have obtained a bachelor's degree or higher.
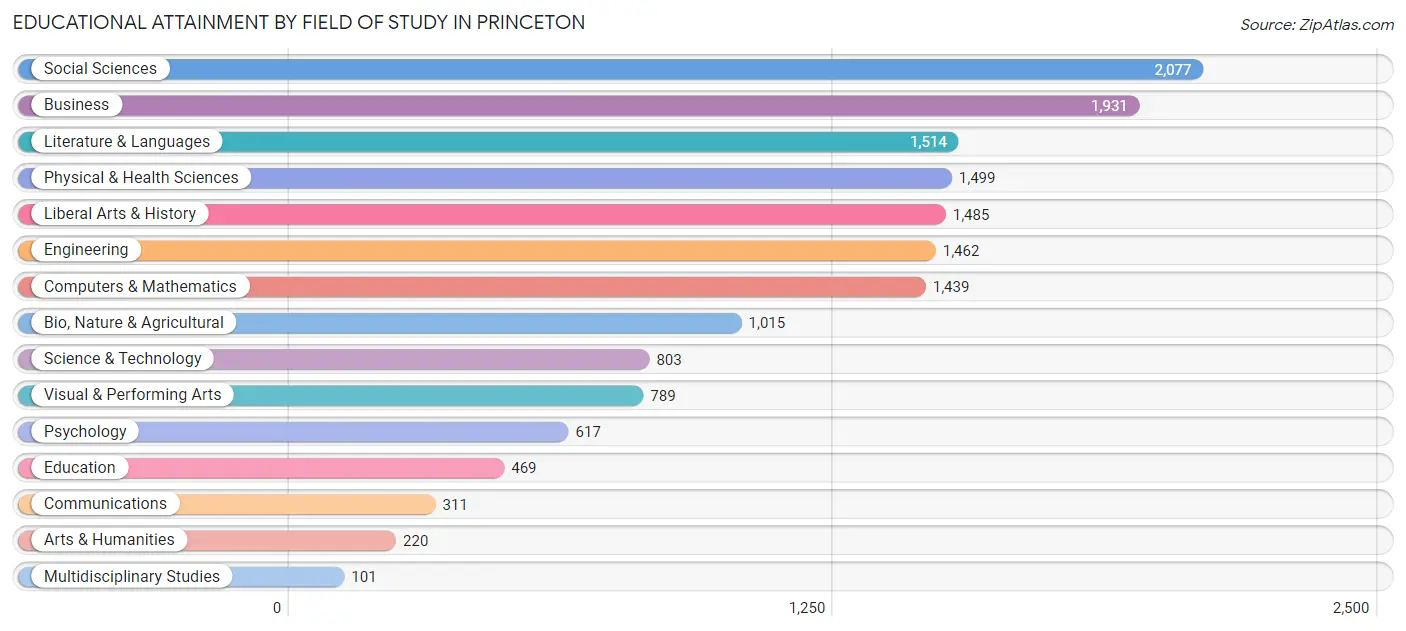
| Field of Study | # Graduates | % Graduates |
| Computers & Mathematics | 1,439 | 9.1% |
| Bio, Nature & Agricultural | 1,015 | 6.5% |
| Physical & Health Sciences | 1,499 | 9.5% |
| Psychology | 617 | 3.9% |
| Social Sciences | 2,077 | 13.2% |
| Engineering | 1,462 | 9.3% |
| Multidisciplinary Studies | 101 | 0.6% |
| Science & Technology | 803 | 5.1% |
| Business | 1,931 | 12.3% |
| Education | 469 | 3.0% |
| Literature & Languages | 1,514 | 9.6% |
| Liberal Arts & History | 1,485 | 9.4% |
| Visual & Performing Arts | 789 | 5.0% |
| Communications | 311 | 2.0% |
| Arts & Humanities | 220 | 1.4% |
| Total | 15,732 | 100.0% |
Transportation & Commute in Princeton
Vehicle Availability by Sex in Princeton
The most prevalent vehicle ownership categories in Princeton are males with 2 vehicles (3,282, accounting for 48.1%) and females with 2 vehicles (2,323, making up 65.6%).
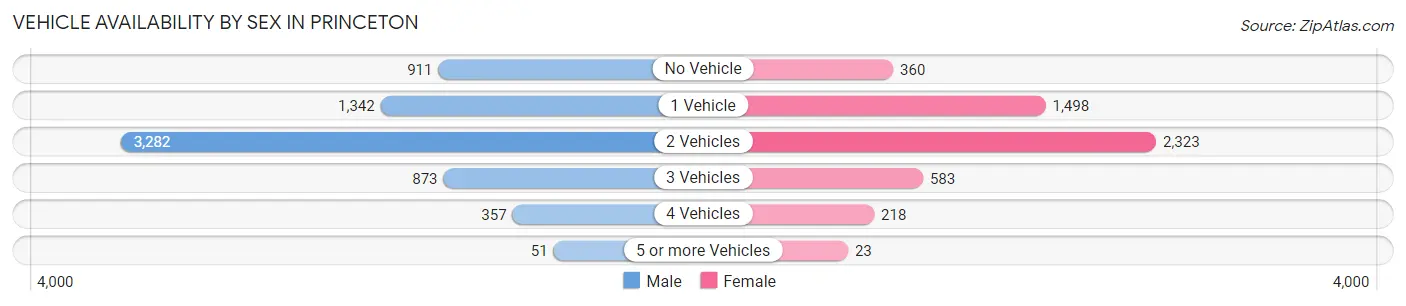
| Vehicles Available | Male | Female |
| No Vehicle | 911 (13.4%) | 360 (7.2%) |
| 1 Vehicle | 1,342 (19.7%) | 1,498 (29.9%) |
| 2 Vehicles | 3,282 (48.1%) | 2,323 (46.4%) |
| 3 Vehicles | 873 (12.8%) | 583 (11.7%) |
| 4 Vehicles | 357 (5.2%) | 218 (4.4%) |
| 5 or more Vehicles | 51 (0.7%) | 23 (0.5%) |
| Total | 6,816 (100.0%) | 5,005 (100.0%) |
Commute Time in Princeton
The most frequently occuring commute durations in Princeton are 10 to 14 minutes (1,835 commuters, 18.8%), 5 to 9 minutes (1,736 commuters, 17.8%), and 15 to 19 minutes (1,522 commuters, 15.6%).
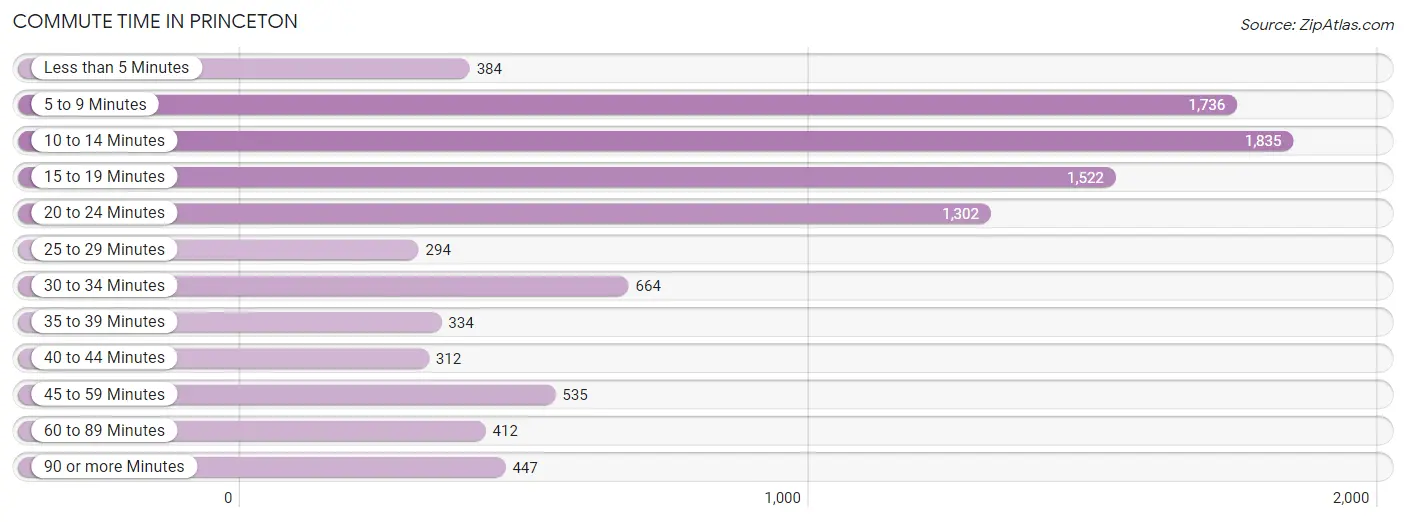
| Commute Time | # Commuters | % Commuters |
| Less than 5 Minutes | 384 | 3.9% |
| 5 to 9 Minutes | 1,736 | 17.8% |
| 10 to 14 Minutes | 1,835 | 18.8% |
| 15 to 19 Minutes | 1,522 | 15.6% |
| 20 to 24 Minutes | 1,302 | 13.3% |
| 25 to 29 Minutes | 294 | 3.0% |
| 30 to 34 Minutes | 664 | 6.8% |
| 35 to 39 Minutes | 334 | 3.4% |
| 40 to 44 Minutes | 312 | 3.2% |
| 45 to 59 Minutes | 535 | 5.5% |
| 60 to 89 Minutes | 412 | 4.2% |
| 90 or more Minutes | 447 | 4.6% |
Commute Time by Sex in Princeton
The most common commute times in Princeton are 5 to 9 minutes (975 commuters, 17.4%) for males and 10 to 14 minutes (941 commuters, 22.6%) for females.
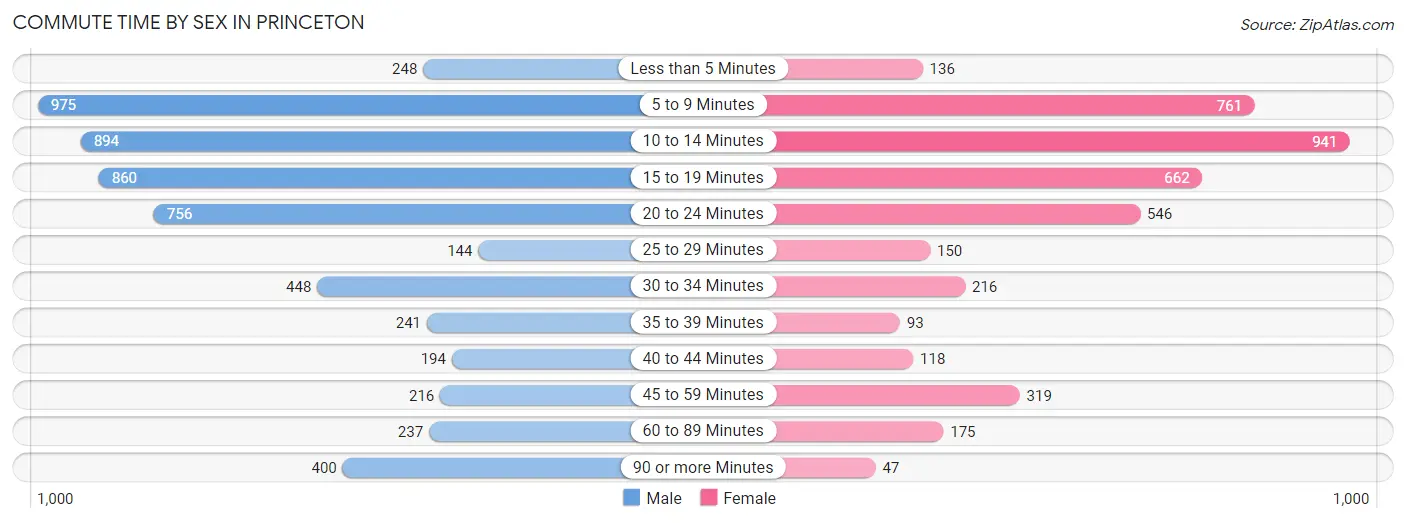
| Commute Time | Male | Female |
| Less than 5 Minutes | 248 (4.4%) | 136 (3.3%) |
| 5 to 9 Minutes | 975 (17.4%) | 761 (18.3%) |
| 10 to 14 Minutes | 894 (15.9%) | 941 (22.6%) |
| 15 to 19 Minutes | 860 (15.3%) | 662 (15.9%) |
| 20 to 24 Minutes | 756 (13.5%) | 546 (13.1%) |
| 25 to 29 Minutes | 144 (2.6%) | 150 (3.6%) |
| 30 to 34 Minutes | 448 (8.0%) | 216 (5.2%) |
| 35 to 39 Minutes | 241 (4.3%) | 93 (2.2%) |
| 40 to 44 Minutes | 194 (3.5%) | 118 (2.8%) |
| 45 to 59 Minutes | 216 (3.8%) | 319 (7.7%) |
| 60 to 89 Minutes | 237 (4.2%) | 175 (4.2%) |
| 90 or more Minutes | 400 (7.1%) | 47 (1.1%) |
Time of Departure to Work by Sex in Princeton
The most frequent times of departure to work in Princeton are 8:00 AM to 8:29 AM (916, 16.3%) for males and 8:00 AM to 8:29 AM (648, 15.6%) for females.
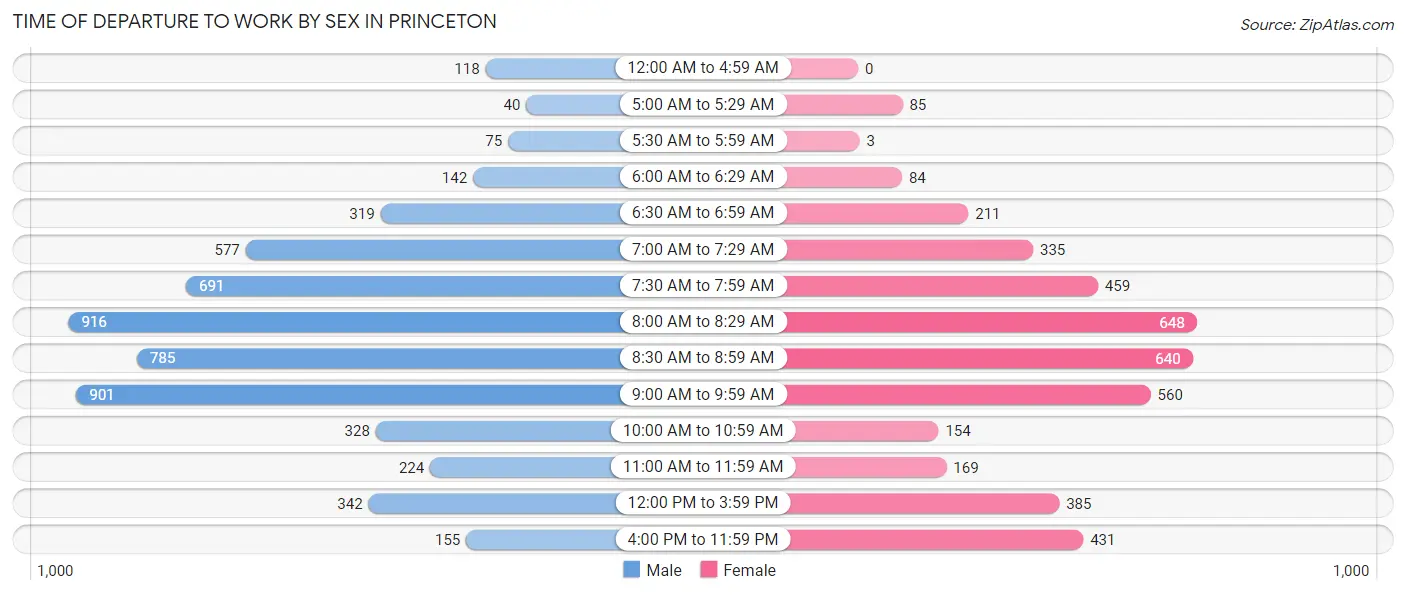
| Time of Departure | Male | Female |
| 12:00 AM to 4:59 AM | 118 (2.1%) | 0 (0.0%) |
| 5:00 AM to 5:29 AM | 40 (0.7%) | 85 (2.0%) |
| 5:30 AM to 5:59 AM | 75 (1.3%) | 3 (0.1%) |
| 6:00 AM to 6:29 AM | 142 (2.5%) | 84 (2.0%) |
| 6:30 AM to 6:59 AM | 319 (5.7%) | 211 (5.1%) |
| 7:00 AM to 7:29 AM | 577 (10.3%) | 335 (8.1%) |
| 7:30 AM to 7:59 AM | 691 (12.3%) | 459 (11.0%) |
| 8:00 AM to 8:29 AM | 916 (16.3%) | 648 (15.6%) |
| 8:30 AM to 8:59 AM | 785 (14.0%) | 640 (15.4%) |
| 9:00 AM to 9:59 AM | 901 (16.1%) | 560 (13.5%) |
| 10:00 AM to 10:59 AM | 328 (5.8%) | 154 (3.7%) |
| 11:00 AM to 11:59 AM | 224 (4.0%) | 169 (4.1%) |
| 12:00 PM to 3:59 PM | 342 (6.1%) | 385 (9.2%) |
| 4:00 PM to 11:59 PM | 155 (2.8%) | 431 (10.3%) |
| Total | 5,613 (100.0%) | 4,164 (100.0%) |
Housing Occupancy in Princeton
Occupancy by Ownership in Princeton
Of the total 8,951 dwellings in Princeton, owner-occupied units account for 5,247 (58.6%), while renter-occupied units make up 3,704 (41.4%).
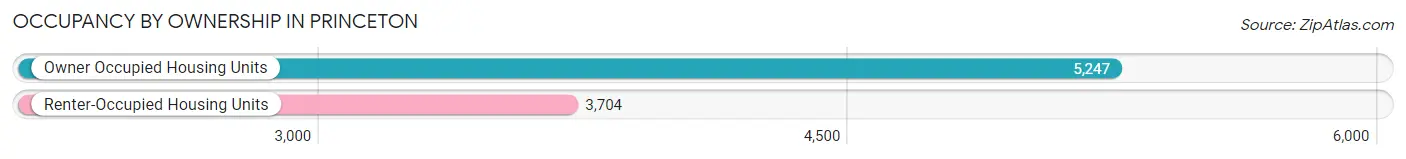
| Occupancy | # Housing Units | % Housing Units |
| Owner Occupied Housing Units | 5,247 | 58.6% |
| Renter-Occupied Housing Units | 3,704 | 41.4% |
| Total Occupied Housing Units | 8,951 | 100.0% |
Occupancy by Household Size in Princeton
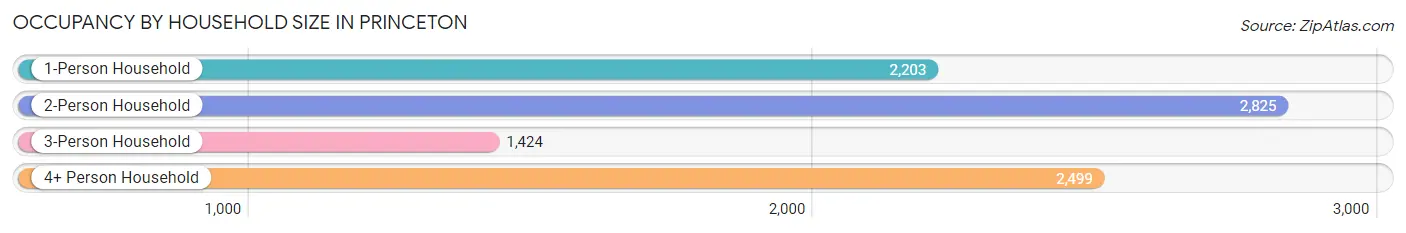
| Household Size | # Housing Units | % Housing Units |
| 1-Person Household | 2,203 | 24.6% |
| 2-Person Household | 2,825 | 31.6% |
| 3-Person Household | 1,424 | 15.9% |
| 4+ Person Household | 2,499 | 27.9% |
| Total Housing Units | 8,951 | 100.0% |
Occupancy by Ownership by Household Size in Princeton
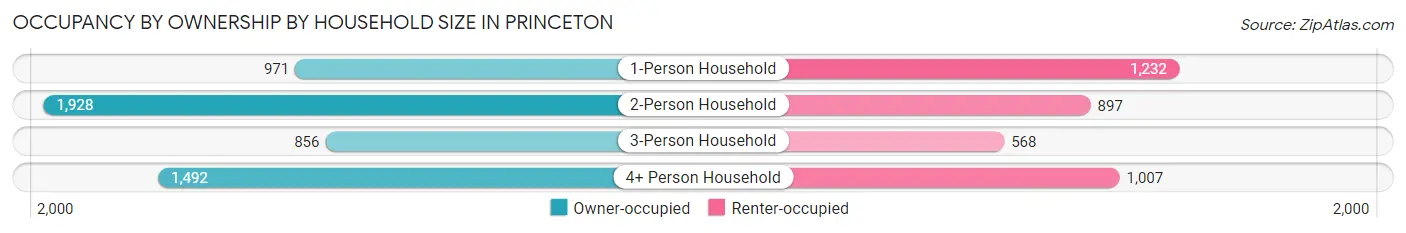
| Household Size | Owner-occupied | Renter-occupied |
| 1-Person Household | 971 (44.1%) | 1,232 (55.9%) |
| 2-Person Household | 1,928 (68.2%) | 897 (31.8%) |
| 3-Person Household | 856 (60.1%) | 568 (39.9%) |
| 4+ Person Household | 1,492 (59.7%) | 1,007 (40.3%) |
| Total Housing Units | 5,247 (58.6%) | 3,704 (41.4%) |
Occupancy by Educational Attainment in Princeton
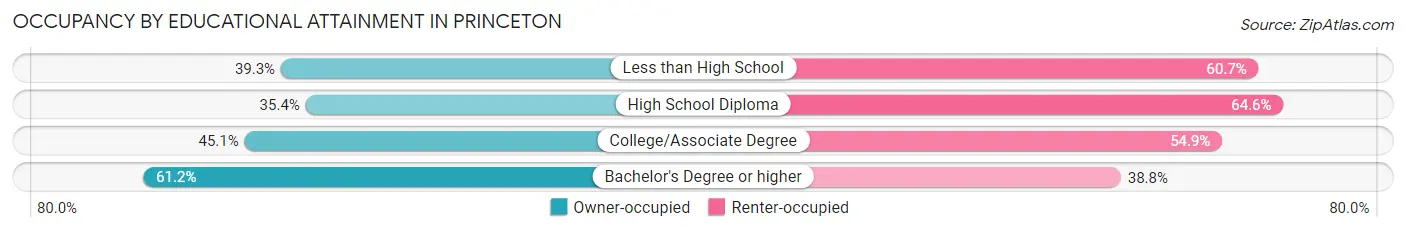
| Household Size | Owner-occupied | Renter-occupied |
| Less than High School | 48 (39.3%) | 74 (60.7%) |
| High School Diploma | 113 (35.4%) | 206 (64.6%) |
| College/Associate Degree | 342 (45.1%) | 416 (54.9%) |
| Bachelor's Degree or higher | 4,744 (61.2%) | 3,008 (38.8%) |
Occupancy by Age of Householder in Princeton
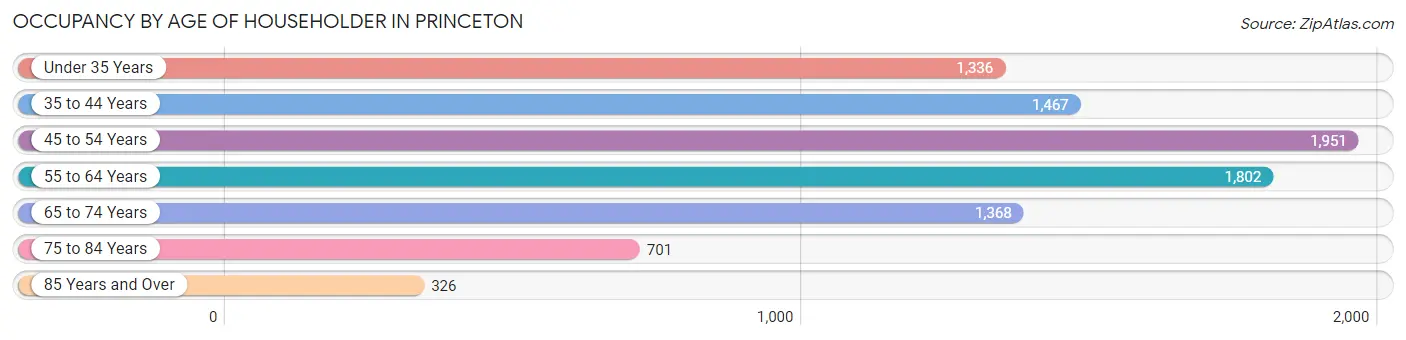
| Age Bracket | # Households | % Households |
| Under 35 Years | 1,336 | 14.9% |
| 35 to 44 Years | 1,467 | 16.4% |
| 45 to 54 Years | 1,951 | 21.8% |
| 55 to 64 Years | 1,802 | 20.1% |
| 65 to 74 Years | 1,368 | 15.3% |
| 75 to 84 Years | 701 | 7.8% |
| 85 Years and Over | 326 | 3.6% |
| Total | 8,951 | 100.0% |
Housing Finances in Princeton
Median Income by Occupancy in Princeton
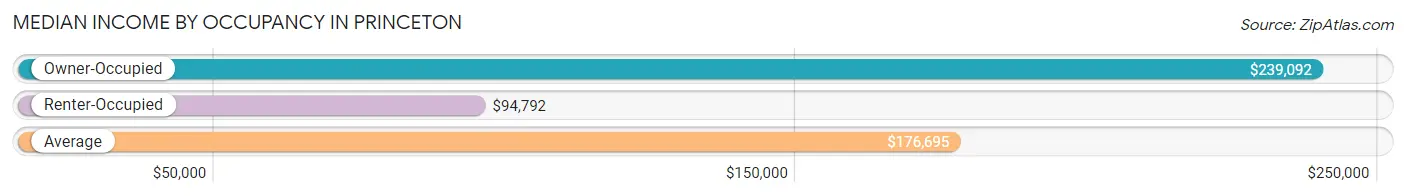
| Occupancy Type | # Households | Median Income |
| Owner-Occupied | 5,247 (58.6%) | $239,092 |
| Renter-Occupied | 3,704 (41.4%) | $94,792 |
| Average | 8,951 (100.0%) | $176,695 |
Occupancy by Householder Income Bracket in Princeton
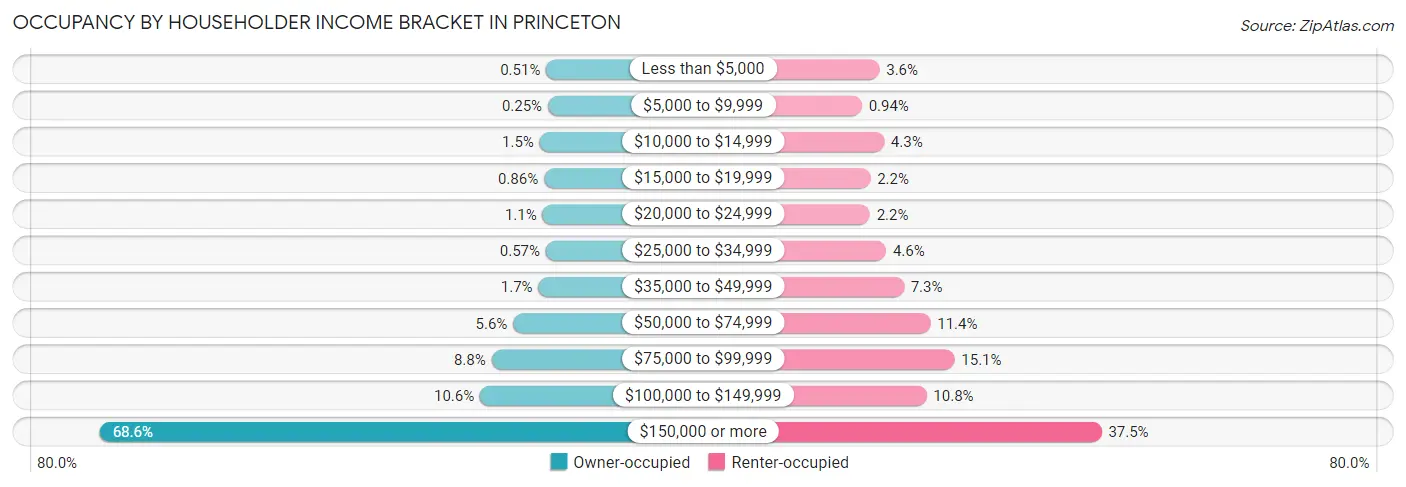
| Income Bracket | Owner-occupied | Renter-occupied |
| Less than $5,000 | 27 (0.5%) | 134 (3.6%) |
| $5,000 to $9,999 | 13 (0.3%) | 35 (0.9%) |
| $10,000 to $14,999 | 79 (1.5%) | 160 (4.3%) |
| $15,000 to $19,999 | 45 (0.9%) | 83 (2.2%) |
| $20,000 to $24,999 | 56 (1.1%) | 80 (2.2%) |
| $25,000 to $34,999 | 30 (0.6%) | 172 (4.6%) |
| $35,000 to $49,999 | 89 (1.7%) | 272 (7.3%) |
| $50,000 to $74,999 | 291 (5.6%) | 422 (11.4%) |
| $75,000 to $99,999 | 464 (8.8%) | 558 (15.1%) |
| $100,000 to $149,999 | 556 (10.6%) | 400 (10.8%) |
| $150,000 or more | 3,597 (68.5%) | 1,388 (37.5%) |
| Total | 5,247 (100.0%) | 3,704 (100.0%) |
Monthly Housing Cost Tiers in Princeton
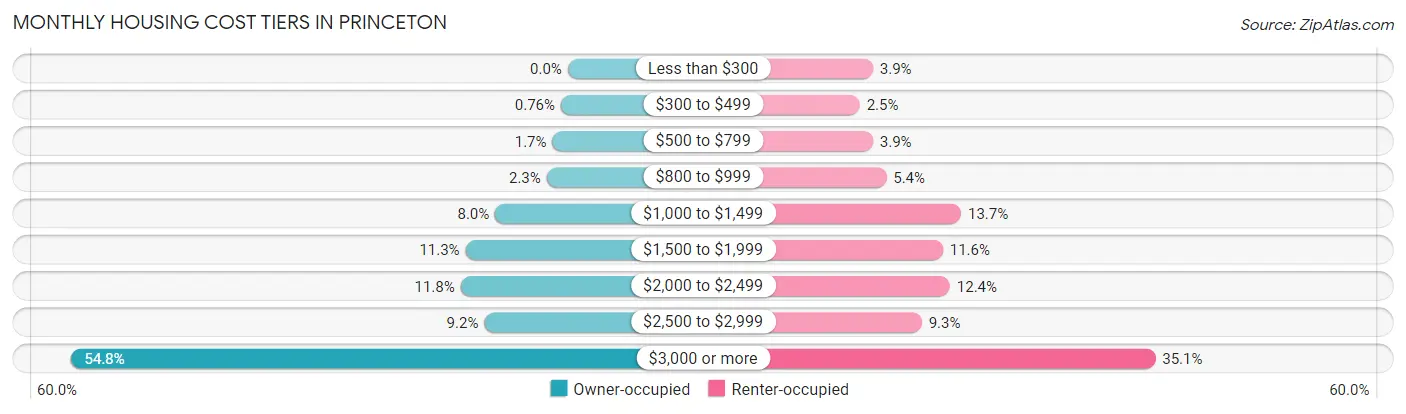
| Monthly Cost | Owner-occupied | Renter-occupied |
| Less than $300 | 0 (0.0%) | 145 (3.9%) |
| $300 to $499 | 40 (0.8%) | 91 (2.5%) |
| $500 to $799 | 89 (1.7%) | 145 (3.9%) |
| $800 to $999 | 122 (2.3%) | 200 (5.4%) |
| $1,000 to $1,499 | 421 (8.0%) | 506 (13.7%) |
| $1,500 to $1,999 | 593 (11.3%) | 431 (11.6%) |
| $2,000 to $2,499 | 621 (11.8%) | 460 (12.4%) |
| $2,500 to $2,999 | 484 (9.2%) | 345 (9.3%) |
| $3,000 or more | 2,877 (54.8%) | 1,301 (35.1%) |
| Total | 5,247 (100.0%) | 3,704 (100.0%) |
Physical Housing Characteristics in Princeton
Housing Structures in Princeton
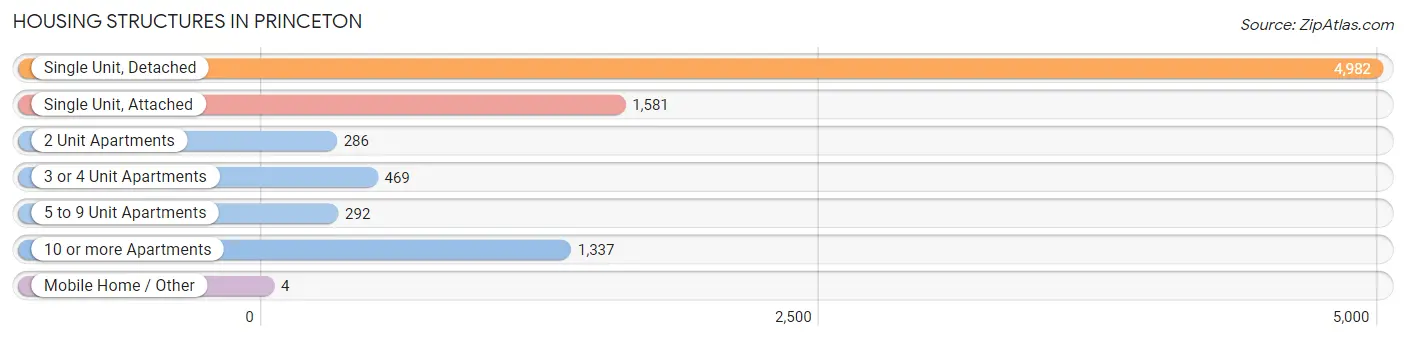
| Structure Type | # Housing Units | % Housing Units |
| Single Unit, Detached | 4,982 | 55.7% |
| Single Unit, Attached | 1,581 | 17.7% |
| 2 Unit Apartments | 286 | 3.2% |
| 3 or 4 Unit Apartments | 469 | 5.2% |
| 5 to 9 Unit Apartments | 292 | 3.3% |
| 10 or more Apartments | 1,337 | 14.9% |
| Mobile Home / Other | 4 | 0.0% |
| Total | 8,951 | 100.0% |
Housing Structures by Occupancy in Princeton
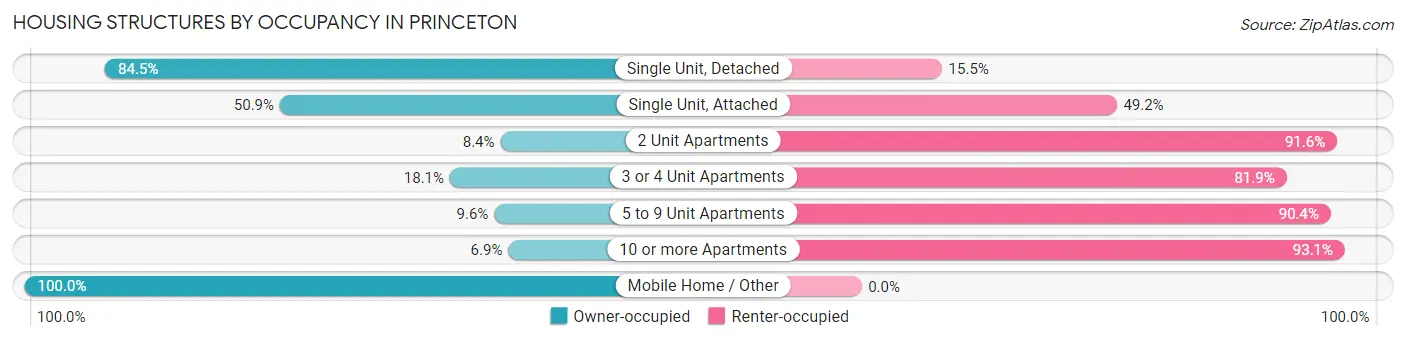
| Structure Type | Owner-occupied | Renter-occupied |
| Single Unit, Detached | 4,210 (84.5%) | 772 (15.5%) |
| Single Unit, Attached | 804 (50.8%) | 777 (49.1%) |
| 2 Unit Apartments | 24 (8.4%) | 262 (91.6%) |
| 3 or 4 Unit Apartments | 85 (18.1%) | 384 (81.9%) |
| 5 to 9 Unit Apartments | 28 (9.6%) | 264 (90.4%) |
| 10 or more Apartments | 92 (6.9%) | 1,245 (93.1%) |
| Mobile Home / Other | 4 (100.0%) | 0 (0.0%) |
| Total | 5,247 (58.6%) | 3,704 (41.4%) |
Housing Structures by Number of Rooms in Princeton
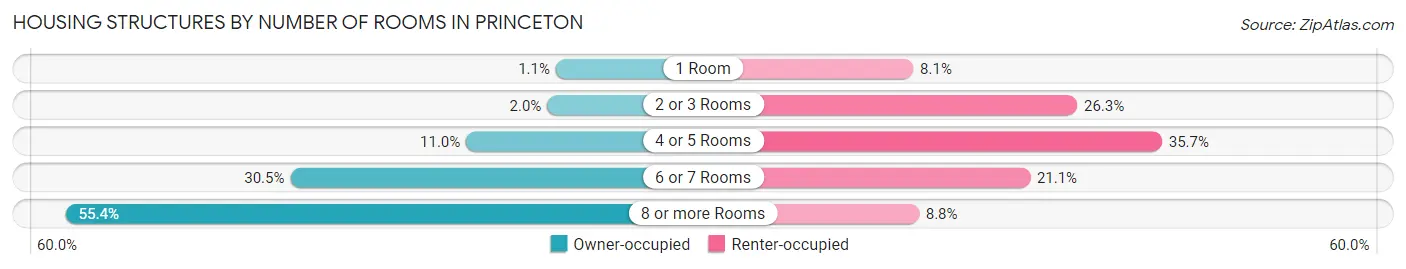
| Number of Rooms | Owner-occupied | Renter-occupied |
| 1 Room | 55 (1.1%) | 301 (8.1%) |
| 2 or 3 Rooms | 105 (2.0%) | 975 (26.3%) |
| 4 or 5 Rooms | 577 (11.0%) | 1,323 (35.7%) |
| 6 or 7 Rooms | 1,601 (30.5%) | 781 (21.1%) |
| 8 or more Rooms | 2,909 (55.4%) | 324 (8.7%) |
| Total | 5,247 (100.0%) | 3,704 (100.0%) |
Housing Structure by Heating Type in Princeton
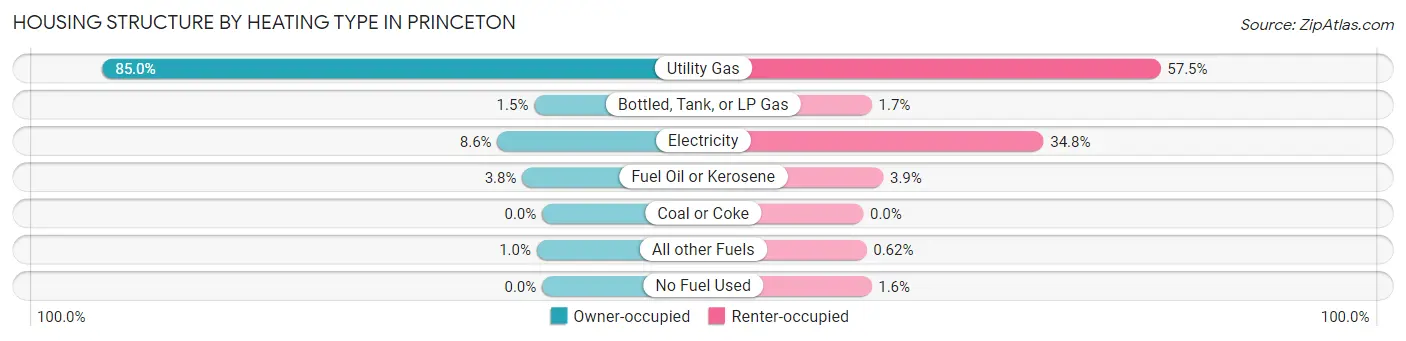
| Heating Type | Owner-occupied | Renter-occupied |
| Utility Gas | 4,459 (85.0%) | 2,128 (57.5%) |
| Bottled, Tank, or LP Gas | 80 (1.5%) | 61 (1.7%) |
| Electricity | 453 (8.6%) | 1,290 (34.8%) |
| Fuel Oil or Kerosene | 201 (3.8%) | 143 (3.9%) |
| Coal or Coke | 0 (0.0%) | 0 (0.0%) |
| All other Fuels | 54 (1.0%) | 23 (0.6%) |
| No Fuel Used | 0 (0.0%) | 59 (1.6%) |
| Total | 5,247 (100.0%) | 3,704 (100.0%) |
Household Vehicle Usage in Princeton
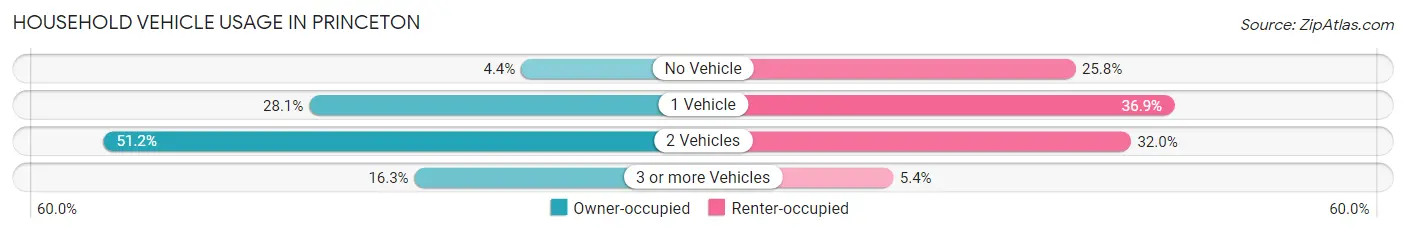
| Vehicles per Household | Owner-occupied | Renter-occupied |
| No Vehicle | 230 (4.4%) | 955 (25.8%) |
| 1 Vehicle | 1,476 (28.1%) | 1,365 (36.8%) |
| 2 Vehicles | 2,684 (51.1%) | 1,185 (32.0%) |
| 3 or more Vehicles | 857 (16.3%) | 199 (5.4%) |
| Total | 5,247 (100.0%) | 3,704 (100.0%) |
Real Estate & Mortgages in Princeton
Real Estate and Mortgage Overview in Princeton
| Characteristic | Without Mortgage | With Mortgage |
| Housing Units | 2,368 | 2,879 |
| Median Property Value | $906,300 | $1,005,500 |
| Median Household Income | $173,667 | $2,313 |
| Monthly Housing Costs | $1,501 | $2,450 |
| Real Estate Taxes | $10,001 | $8 |
Property Value by Mortgage Status in Princeton
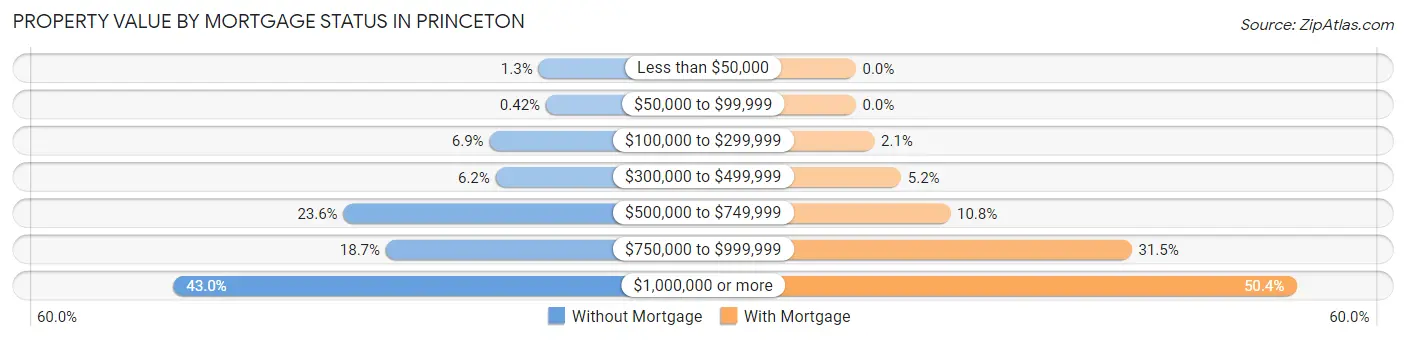
| Property Value | Without Mortgage | With Mortgage |
| Less than $50,000 | 30 (1.3%) | 0 (0.0%) |
| $50,000 to $99,999 | 10 (0.4%) | 0 (0.0%) |
| $100,000 to $299,999 | 163 (6.9%) | 61 (2.1%) |
| $300,000 to $499,999 | 146 (6.2%) | 149 (5.2%) |
| $500,000 to $749,999 | 558 (23.6%) | 311 (10.8%) |
| $750,000 to $999,999 | 443 (18.7%) | 908 (31.5%) |
| $1,000,000 or more | 1,018 (43.0%) | 1,450 (50.4%) |
| Total | 2,368 (100.0%) | 2,879 (100.0%) |
Household Income by Mortgage Status in Princeton
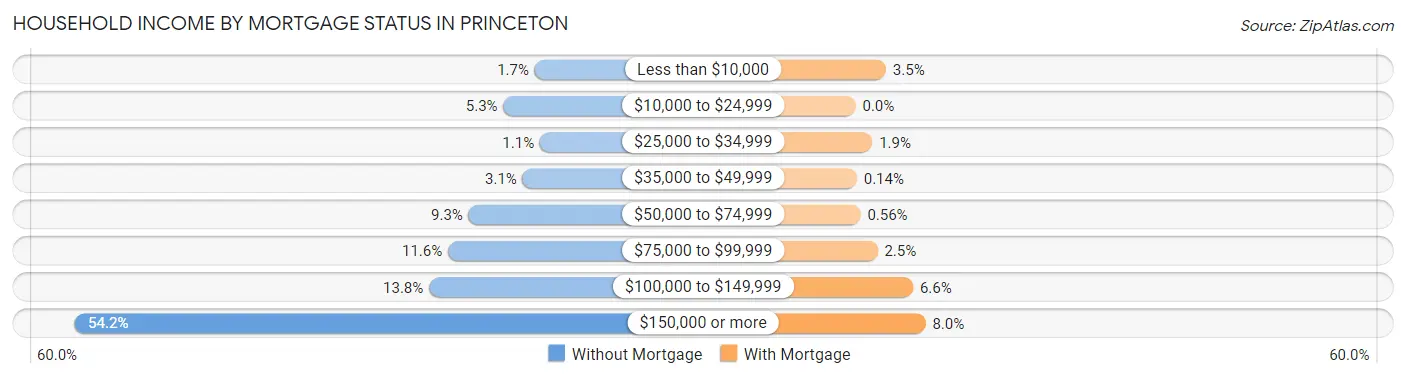
| Household Income | Without Mortgage | With Mortgage |
| Less than $10,000 | 40 (1.7%) | 100 (3.5%) |
| $10,000 to $24,999 | 125 (5.3%) | 0 (0.0%) |
| $25,000 to $34,999 | 26 (1.1%) | 55 (1.9%) |
| $35,000 to $49,999 | 73 (3.1%) | 4 (0.1%) |
| $50,000 to $74,999 | 219 (9.2%) | 16 (0.6%) |
| $75,000 to $99,999 | 275 (11.6%) | 72 (2.5%) |
| $100,000 to $149,999 | 326 (13.8%) | 189 (6.6%) |
| $150,000 or more | 1,284 (54.2%) | 230 (8.0%) |
| Total | 2,368 (100.0%) | 2,879 (100.0%) |
Property Value to Household Income Ratio in Princeton
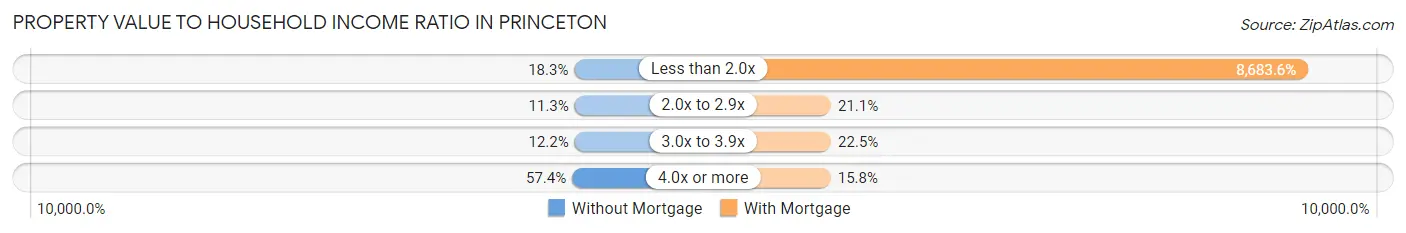
| Value-to-Income Ratio | Without Mortgage | With Mortgage |
| Less than 2.0x | 434 (18.3%) | 250,001 (8,683.6%) |
| 2.0x to 2.9x | 268 (11.3%) | 606 (21.0%) |
| 3.0x to 3.9x | 288 (12.2%) | 649 (22.5%) |
| 4.0x or more | 1,360 (57.4%) | 456 (15.8%) |
| Total | 2,368 (100.0%) | 2,879 (100.0%) |
Real Estate Taxes by Mortgage Status in Princeton
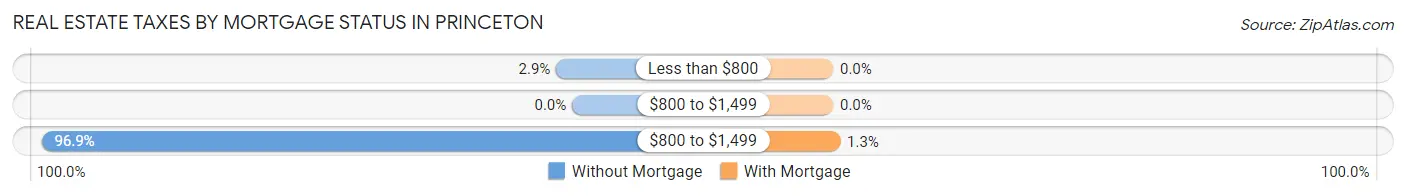
| Property Taxes | Without Mortgage | With Mortgage |
| Less than $800 | 69 (2.9%) | 0 (0.0%) |
| $800 to $1,499 | 0 (0.0%) | 0 (0.0%) |
| $800 to $1,499 | 2,295 (96.9%) | 37 (1.3%) |
| Total | 2,368 (100.0%) | 2,879 (100.0%) |
Health & Disability in Princeton
Health Insurance Coverage by Age in Princeton
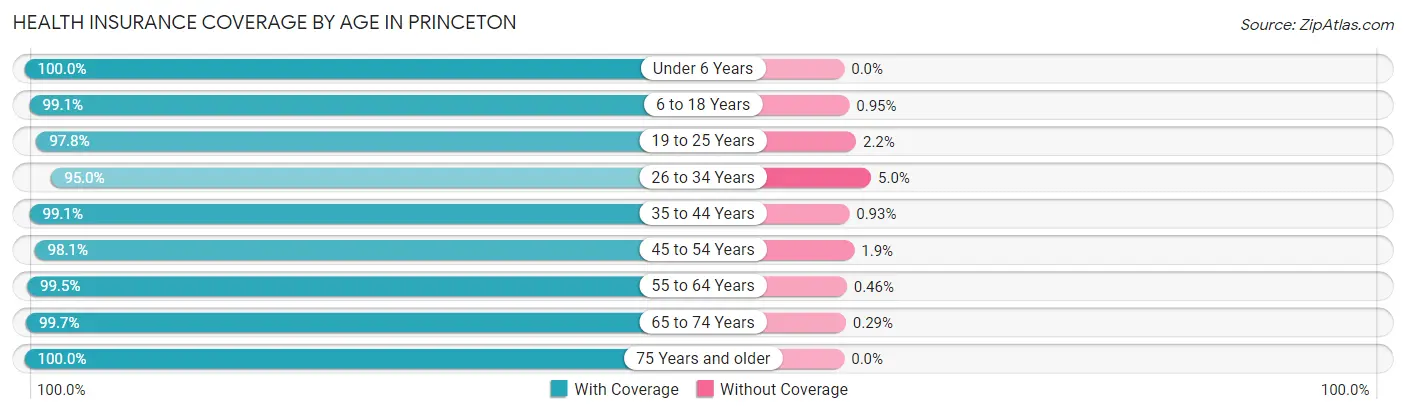
| Age Bracket | With Coverage | Without Coverage |
| Under 6 Years | 1,133 (100.0%) | 0 (0.0%) |
| 6 to 18 Years | 6,032 (99.1%) | 58 (0.9%) |
| 19 to 25 Years | 6,699 (97.8%) | 150 (2.2%) |
| 26 to 34 Years | 2,606 (95.0%) | 137 (5.0%) |
| 35 to 44 Years | 2,675 (99.1%) | 25 (0.9%) |
| 45 to 54 Years | 3,774 (98.1%) | 72 (1.9%) |
| 55 to 64 Years | 3,037 (99.5%) | 14 (0.5%) |
| 65 to 74 Years | 2,085 (99.7%) | 6 (0.3%) |
| 75 Years and older | 1,732 (100.0%) | 0 (0.0%) |
| Total | 29,773 (98.5%) | 462 (1.5%) |
Health Insurance Coverage by Citizenship Status in Princeton
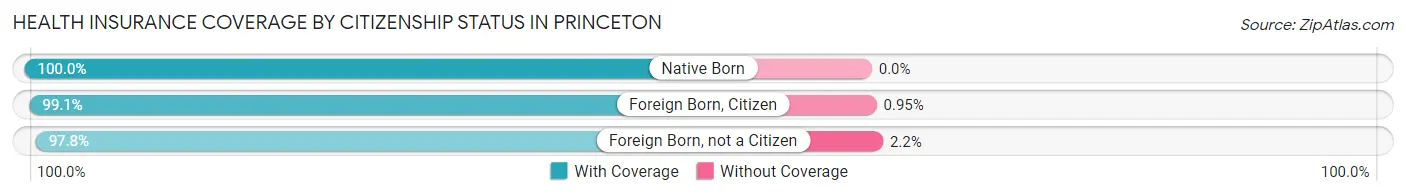
| Citizenship Status | With Coverage | Without Coverage |
| Native Born | 1,133 (100.0%) | 0 (0.0%) |
| Foreign Born, Citizen | 6,032 (99.1%) | 58 (0.9%) |
| Foreign Born, not a Citizen | 6,699 (97.8%) | 150 (2.2%) |
Health Insurance Coverage by Household Income in Princeton
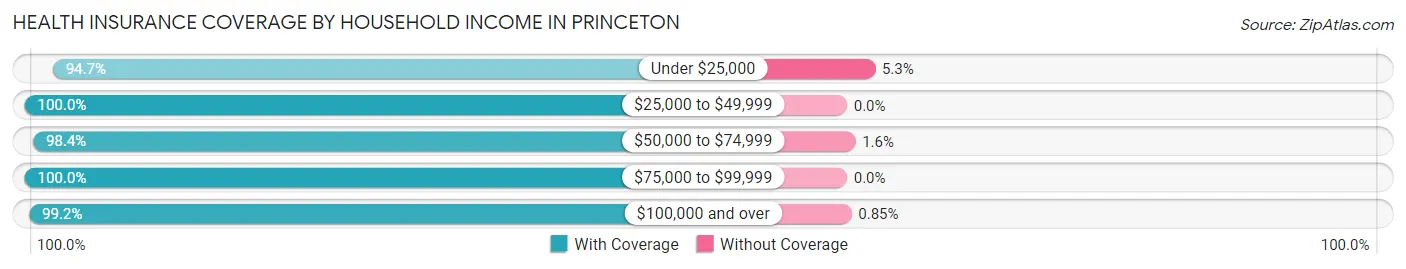
| Household Income | With Coverage | Without Coverage |
| Under $25,000 | 1,259 (94.7%) | 70 (5.3%) |
| $25,000 to $49,999 | 1,088 (100.0%) | 0 (0.0%) |
| $50,000 to $74,999 | 1,190 (98.4%) | 19 (1.6%) |
| $75,000 to $99,999 | 2,175 (100.0%) | 0 (0.0%) |
| $100,000 and over | 17,522 (99.2%) | 151 (0.9%) |
Public vs Private Health Insurance Coverage by Age in Princeton
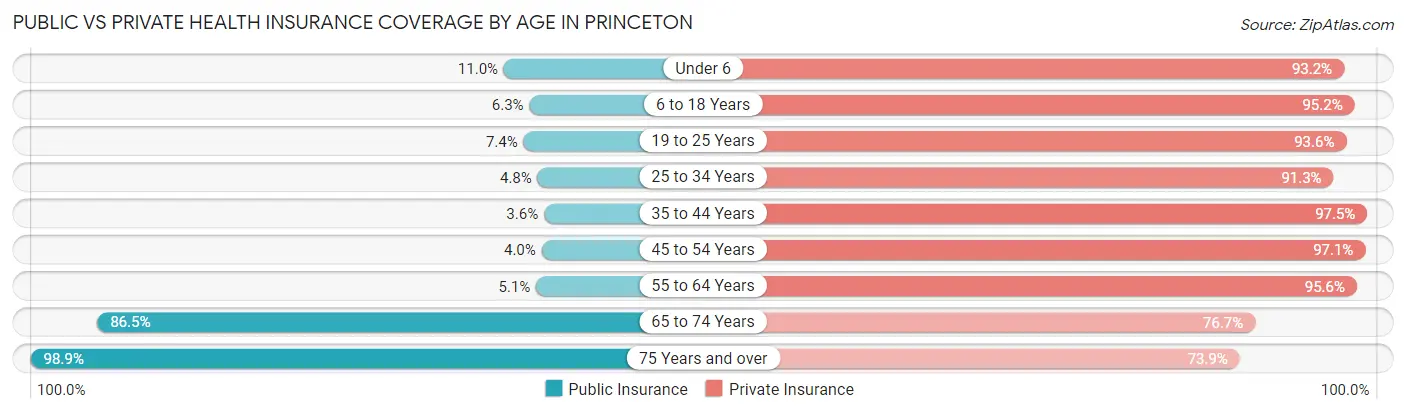
| Age Bracket | Public Insurance | Private Insurance |
| Under 6 | 125 (11.0%) | 1,056 (93.2%) |
| 6 to 18 Years | 383 (6.3%) | 5,795 (95.2%) |
| 19 to 25 Years | 506 (7.4%) | 6,412 (93.6%) |
| 25 to 34 Years | 131 (4.8%) | 2,503 (91.2%) |
| 35 to 44 Years | 97 (3.6%) | 2,633 (97.5%) |
| 45 to 54 Years | 155 (4.0%) | 3,736 (97.1%) |
| 55 to 64 Years | 154 (5.1%) | 2,916 (95.6%) |
| 65 to 74 Years | 1,809 (86.5%) | 1,604 (76.7%) |
| 75 Years and over | 1,713 (98.9%) | 1,279 (73.9%) |
| Total | 5,073 (16.8%) | 27,934 (92.4%) |
Disability Status by Sex by Age in Princeton
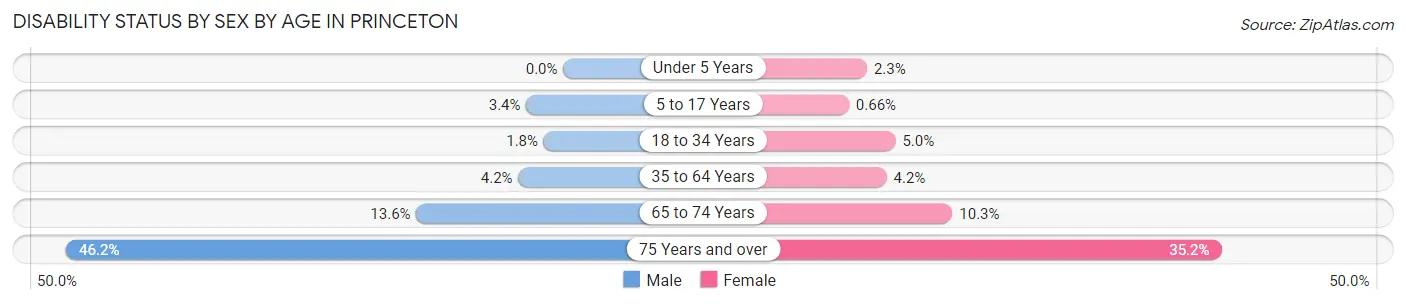
| Age Bracket | Male | Female |
| Under 5 Years | 0 (0.0%) | 10 (2.3%) |
| 5 to 17 Years | 77 (3.4%) | 17 (0.7%) |
| 18 to 34 Years | 106 (1.8%) | 258 (5.0%) |
| 35 to 64 Years | 195 (4.2%) | 205 (4.2%) |
| 65 to 74 Years | 135 (13.6%) | 113 (10.3%) |
| 75 Years and over | 384 (46.2%) | 317 (35.2%) |
Disability Class by Sex by Age in Princeton
Disability Class: Hearing Difficulty
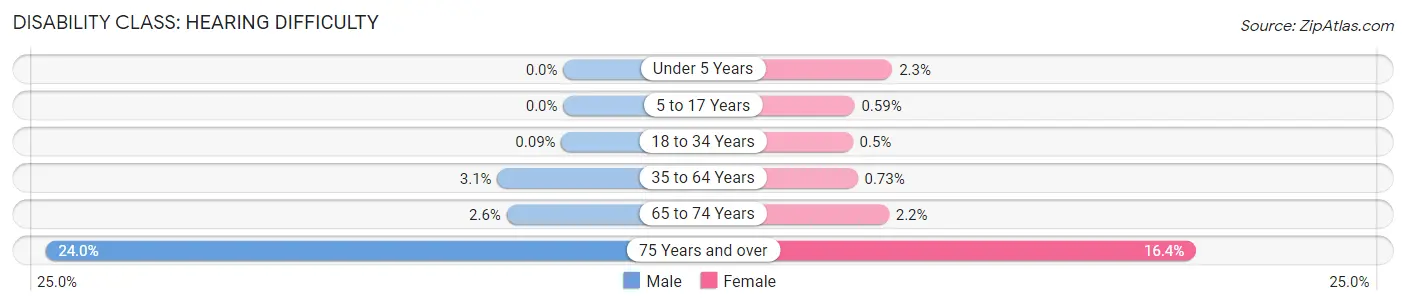
| Age Bracket | Male | Female |
| Under 5 Years | 0 (0.0%) | 10 (2.3%) |
| 5 to 17 Years | 0 (0.0%) | 15 (0.6%) |
| 18 to 34 Years | 5 (0.1%) | 26 (0.5%) |
| 35 to 64 Years | 143 (3.1%) | 36 (0.7%) |
| 65 to 74 Years | 26 (2.6%) | 24 (2.2%) |
| 75 Years and over | 200 (24.0%) | 148 (16.4%) |
Disability Class: Vision Difficulty
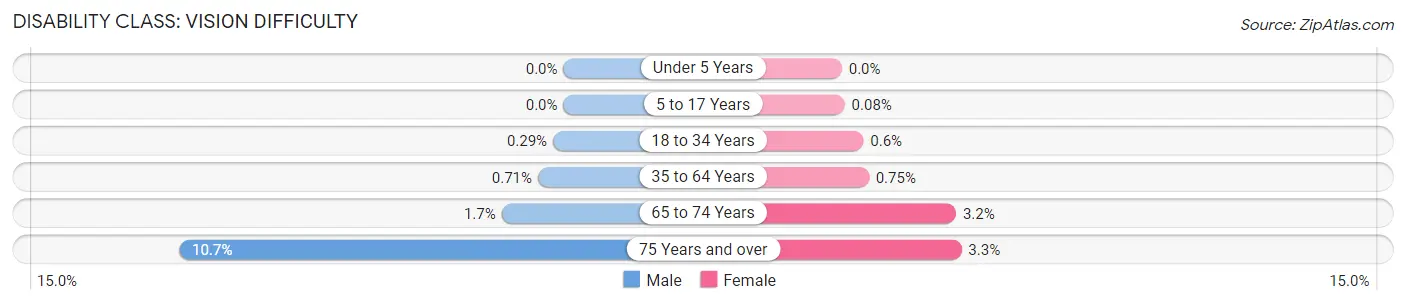
| Age Bracket | Male | Female |
| Under 5 Years | 0 (0.0%) | 0 (0.0%) |
| 5 to 17 Years | 0 (0.0%) | 2 (0.1%) |
| 18 to 34 Years | 17 (0.3%) | 31 (0.6%) |
| 35 to 64 Years | 33 (0.7%) | 37 (0.7%) |
| 65 to 74 Years | 17 (1.7%) | 35 (3.2%) |
| 75 Years and over | 89 (10.7%) | 30 (3.3%) |
Disability Class: Cognitive Difficulty
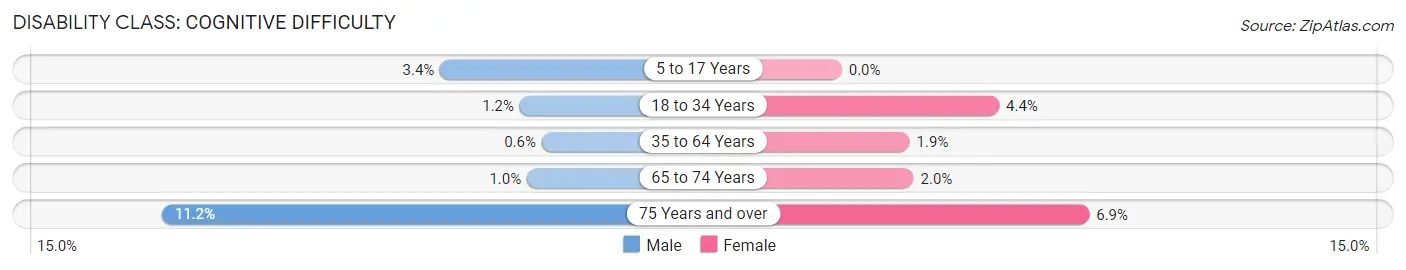
| Age Bracket | Male | Female |
| 5 to 17 Years | 77 (3.4%) | 0 (0.0%) |
| 18 to 34 Years | 71 (1.2%) | 227 (4.4%) |
| 35 to 64 Years | 28 (0.6%) | 93 (1.9%) |
| 65 to 74 Years | 10 (1.0%) | 22 (2.0%) |
| 75 Years and over | 93 (11.2%) | 62 (6.9%) |
Disability Class: Ambulatory Difficulty
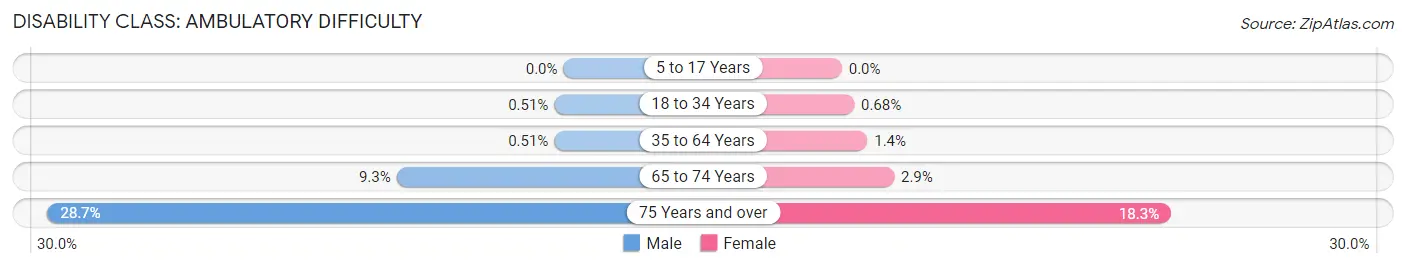
| Age Bracket | Male | Female |
| 5 to 17 Years | 0 (0.0%) | 0 (0.0%) |
| 18 to 34 Years | 30 (0.5%) | 35 (0.7%) |
| 35 to 64 Years | 24 (0.5%) | 70 (1.4%) |
| 65 to 74 Years | 92 (9.3%) | 32 (2.9%) |
| 75 Years and over | 239 (28.7%) | 165 (18.3%) |
Disability Class: Self-Care Difficulty
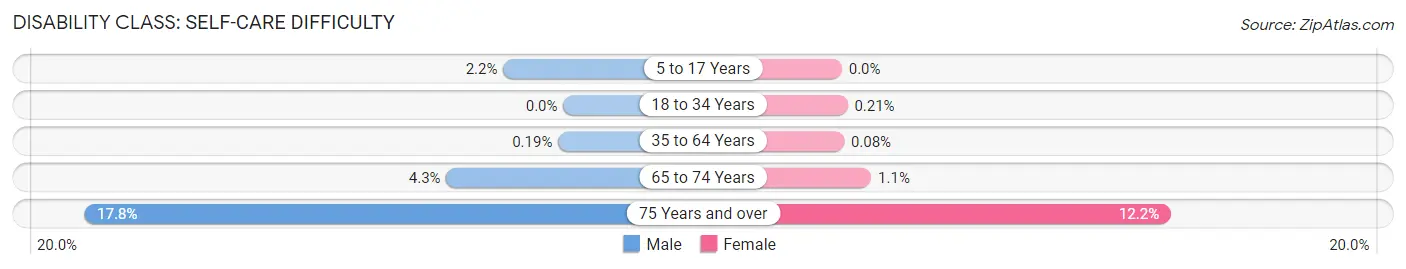
| Age Bracket | Male | Female |
| 5 to 17 Years | 50 (2.2%) | 0 (0.0%) |
| 18 to 34 Years | 0 (0.0%) | 11 (0.2%) |
| 35 to 64 Years | 9 (0.2%) | 4 (0.1%) |
| 65 to 74 Years | 43 (4.3%) | 12 (1.1%) |
| 75 Years and over | 148 (17.8%) | 110 (12.2%) |
Technology Access in Princeton
Computing Device Access in Princeton
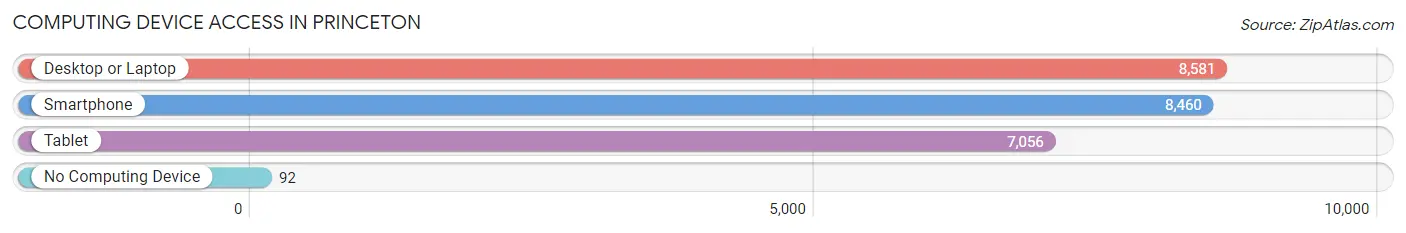
| Device Type | # Households | % Households |
| Desktop or Laptop | 8,581 | 95.9% |
| Smartphone | 8,460 | 94.5% |
| Tablet | 7,056 | 78.8% |
| No Computing Device | 92 | 1.0% |
| Total | 8,951 | 100.0% |
Internet Access in Princeton
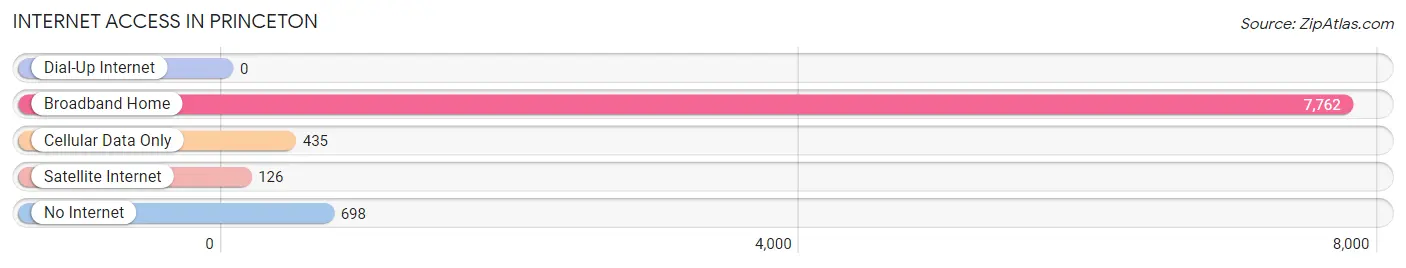
| Internet Type | # Households | % Households |
| Dial-Up Internet | 0 | 0.0% |
| Broadband Home | 7,762 | 86.7% |
| Cellular Data Only | 435 | 4.9% |
| Satellite Internet | 126 | 1.4% |
| No Internet | 698 | 7.8% |
| Total | 8,951 | 100.0% |
Princeton Summary
Princeton, NJ is a small town located in Mercer County, New Jersey. It is situated in the heart of the state, about halfway between New York City and Philadelphia. The town is home to Princeton University, one of the most prestigious universities in the world.
History
The area that is now Princeton was originally inhabited by the Lenni Lenape Native Americans. The first European settlers arrived in the area in 1683, led by William Penn. The town was officially founded in 1702 and named after the British royal family’s House of Princeton.
In 1756, the College of New Jersey (now Princeton University) was founded in the town. The college quickly became a major center of learning and culture in the region. During the Revolutionary War, the town was the site of several battles, including the Battle of Princeton in 1777.
Geography
Princeton is located in central New Jersey, about halfway between New York City and Philadelphia. The town is situated on the banks of the Millstone River, which flows through the town and into the Raritan River. The town is bordered by Montgomery Township to the north, West Windsor Township to the east, and Plainsboro Township to the south.
The town has a total area of 15.3 square miles, of which 14.9 square miles is land and 0.4 square miles is water. The town is located in the humid subtropical climate zone, with hot, humid summers and cold, wet winters.
Economy
The economy of Princeton is largely driven by the presence of Princeton University. The university is the largest employer in the town, with over 6,000 employees. Other major employers in the town include the Princeton HealthCare System, the Institute for Advanced Study, and the Princeton Plasma Physics Laboratory.
The town also has a vibrant retail sector, with a variety of shops, restaurants, and other businesses. The town is home to several major corporations, including Bristol-Myers Squibb, Dow Jones & Company, and NRG Energy.
Demographics
As of the 2010 census, the population of Princeton was 28,572. The racial makeup of the town was 79.2% White, 8.2% African American, 0.2% Native American, 8.7% Asian, 0.1% Pacific Islander, and 2.7% from other races. The median household income was $117,811, and the median family income was $140,936.
The town is home to a diverse population, with a variety of religious and cultural backgrounds. The town is also home to a large number of international students, due to the presence of Princeton University.
Conclusion
Princeton, NJ is a small town located in Mercer County, New Jersey. It is situated in the heart of the state, about halfway between New York City and Philadelphia. The town is home to Princeton University, one of the most prestigious universities in the world. The town has a rich history, and its economy is largely driven by the presence of the university. The town is also home to a diverse population, with a variety of religious and cultural backgrounds.
Common Questions
What is Per Capita Income in Princeton?
Per Capita income in Princeton is $83,200.
What is the Median Family Income in Princeton?
Median Family Income in Princeton is $239,306.
What is the Median Household income in Princeton?
Median Household Income in Princeton is $176,695.
What is Income or Wage Gap in Princeton?
Income or Wage Gap in Princeton is 45.5%.
Women in Princeton earn 54.5 cents for every dollar earned by a man.
What is Family Income Deficit in Princeton?
Family Income Deficit in Princeton is $9,416.
Families that are below poverty line in Princeton earn $9,416 less on average than the poverty threshold level.
What is Inequality or Gini Index in Princeton?
Inequality or Gini Index in Princeton is 0.52.
What is the Total Population of Princeton?
Total Population of Princeton is 30,450.
What is the Total Male Population of Princeton?
Total Male Population of Princeton is 15,212.
What is the Total Female Population of Princeton?
Total Female Population of Princeton is 15,238.
What is the Ratio of Males per 100 Females in Princeton?
There are 99.83 Males per 100 Females in Princeton.
What is the Ratio of Females per 100 Males in Princeton?
There are 100.17 Females per 100 Males in Princeton.
What is the Median Population Age in Princeton?
Median Population Age in Princeton is 28.6 Years.
What is the Average Family Size in Princeton
Average Family Size in Princeton is 3.1 People.
What is the Average Household Size in Princeton
Average Household Size in Princeton is 2.6 People.
How Large is the Labor Force in Princeton?
There are 15,615 People in the Labor Forcein in Princeton.
What is the Percentage of People in the Labor Force in Princeton?
61.7% of People are in the Labor Force in Princeton.
What is the Unemployment Rate in Princeton?
Unemployment Rate in Princeton is 4.8%.