Cities with the Highest Percentage of Population Walking to Work in New Jersey
RELATED REPORTS & OPTIONS
Walk to Work
New Jersey
Compare Cities
Map of Cities with the Highest Percentage of Population Walking to Work in New Jersey
0.0%
100.0%
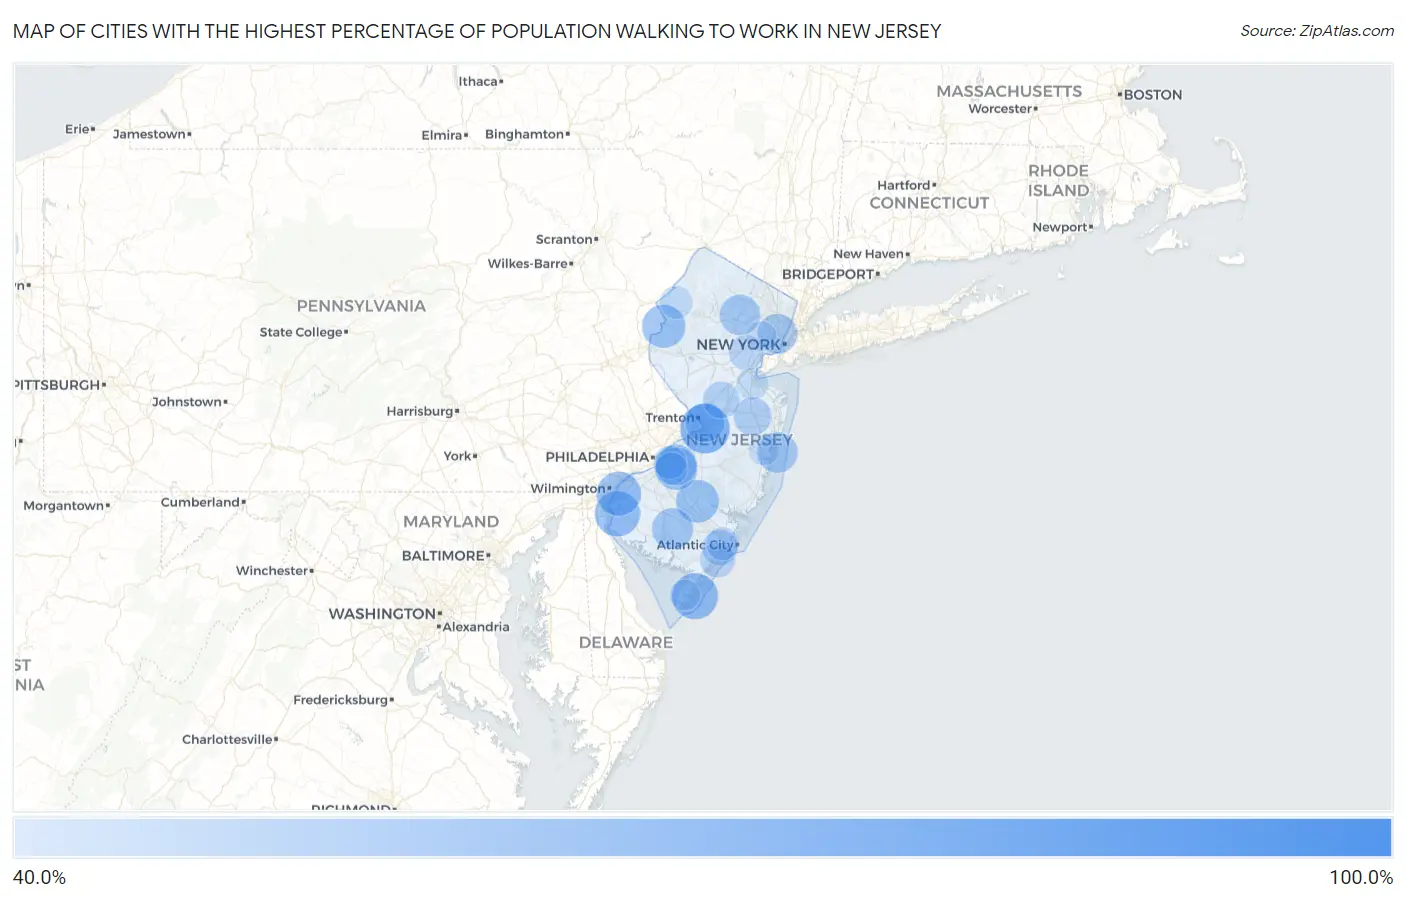
Cities with the Highest Percentage of Population Walking to Work in New Jersey
| City | % Walk to Work | vs State | vs National | |
| 1. | West Wildwood Borough | 81.1% | 38.0% (+43.1)#1 | 33.4% (+47.7)#8 |
| 2. | Mount Ephraim Borough | 75.2% | 38.0% (+37.2)#2 | 33.4% (+41.8)#43 |
| 3. | Island Heights Borough | 74.2% | 38.0% (+36.2)#3 | 33.4% (+40.8)#52 |
| 4. | Millstone Borough | 71.5% | 38.0% (+33.5)#4 | 33.4% (+38.1)#79 |
| 5. | Butler Borough | 71.0% | 38.0% (+33.0)#5 | 33.4% (+37.6)#95 |
| 6. | Waldwick Borough | 68.1% | 38.0% (+30.1)#6 | 33.4% (+34.7)#177 |
| 7. | Lebanon Borough | 67.5% | 38.0% (+29.5)#7 | 33.4% (+34.1)#198 |
| 8. | Rockaway Borough | 66.5% | 38.0% (+28.5)#8 | 33.4% (+33.1)#248 |
| 9. | Brielle Borough | 66.4% | 38.0% (+28.4)#9 | 33.4% (+33.0)#259 |
| 10. | Bordentown | 66.4% | 38.0% (+28.4)#10 | 33.4% (+33.0)#260 |
| 11. | Saddle River Borough | 65.6% | 38.0% (+27.6)#11 | 33.4% (+32.2)#304 |
| 12. | Mendham Borough | 65.5% | 38.0% (+27.5)#12 | 33.4% (+32.1)#308 |
| 13. | Milford Borough | 65.4% | 38.0% (+27.4)#13 | 33.4% (+32.0)#320 |
| 14. | Sea Girt Borough | 65.3% | 38.0% (+27.3)#14 | 33.4% (+31.9)#327 |
| 15. | North Arlington Borough | 64.0% | 38.0% (+26.0)#15 | 33.4% (+30.6)#416 |
| 16. | Paulsboro Borough | 63.6% | 38.0% (+25.6)#16 | 33.4% (+30.2)#439 |
| 17. | Union | 63.4% | 38.0% (+25.4)#17 | 33.4% (+30.0)#467 |
| 18. | North Wildwood | 63.2% | 38.0% (+25.2)#18 | 33.4% (+29.8)#485 |
| 19. | Belmar Borough | 63.1% | 38.0% (+25.1)#19 | 33.4% (+29.7)#495 |
| 20. | Wood Ridge Borough | 62.7% | 38.0% (+24.7)#20 | 33.4% (+29.3)#522 |
| 21. | Bedminster | 62.7% | 38.0% (+24.7)#21 | 33.4% (+29.3)#526 |
| 22. | Clayton Borough | 62.5% | 38.0% (+24.5)#22 | 33.4% (+29.1)#538 |
| 23. | Eatontown Borough | 62.4% | 38.0% (+24.4)#23 | 33.4% (+29.0)#557 |
| 24. | Salem | 62.3% | 38.0% (+24.3)#24 | 33.4% (+28.9)#570 |
| 25. | Westville Borough | 61.6% | 38.0% (+23.6)#25 | 33.4% (+28.2)#640 |
| 26. | Wildwood Crest Borough | 61.5% | 38.0% (+23.5)#26 | 33.4% (+28.1)#648 |
| 27. | Carneys Point | 61.3% | 38.0% (+23.3)#27 | 33.4% (+27.9)#683 |
| 28. | Lincoln Park Borough | 61.2% | 38.0% (+23.2)#28 | 33.4% (+27.8)#704 |
| 29. | Preakness | 60.8% | 38.0% (+22.8)#29 | 33.4% (+27.4)#739 |
| 30. | Washington Borough | 60.8% | 38.0% (+22.8)#30 | 33.4% (+27.4)#740 |
| 31. | The Hills | 60.7% | 38.0% (+22.7)#31 | 33.4% (+27.3)#746 |
| 32. | Belvidere | 60.4% | 38.0% (+22.4)#32 | 33.4% (+27.0)#808 |
| 33. | Midland Park Borough | 60.3% | 38.0% (+22.3)#33 | 33.4% (+26.9)#819 |
| 34. | Hammonton | 59.9% | 38.0% (+21.9)#34 | 33.4% (+26.5)#875 |
| 35. | Little Ferry Borough | 59.9% | 38.0% (+21.9)#35 | 33.4% (+26.5)#877 |
| 36. | Springdale | 59.4% | 38.0% (+21.4)#36 | 33.4% (+26.0)#935 |
| 37. | National Park Borough | 59.1% | 38.0% (+21.1)#37 | 33.4% (+25.7)#999 |
| 38. | Longport Borough | 59.1% | 38.0% (+21.1)#38 | 33.4% (+25.7)#1,009 |
| 39. | Bernardsville Borough | 58.9% | 38.0% (+20.9)#39 | 33.4% (+25.5)#1,020 |
| 40. | Pompton Plains | 58.4% | 38.0% (+20.4)#40 | 33.4% (+25.0)#1,099 |
| 41. | Swedesboro Borough | 58.4% | 38.0% (+20.4)#41 | 33.4% (+25.0)#1,105 |
| 42. | Vineland | 58.3% | 38.0% (+20.3)#42 | 33.4% (+24.9)#1,115 |
| 43. | Greentree | 58.2% | 38.0% (+20.2)#43 | 33.4% (+24.8)#1,136 |
| 44. | Boonton | 57.7% | 38.0% (+19.7)#44 | 33.4% (+24.3)#1,191 |
| 45. | Dover Beaches North | 57.7% | 38.0% (+19.7)#45 | 33.4% (+24.3)#1,197 |
| 46. | Spring Lake Heights Borough | 57.5% | 38.0% (+19.5)#46 | 33.4% (+24.1)#1,222 |
| 47. | Silver Lake Cdp Essex County | 57.3% | 38.0% (+19.3)#47 | 33.4% (+23.9)#1,259 |
| 48. | Secaucus | 56.9% | 38.0% (+18.9)#48 | 33.4% (+23.5)#1,326 |
| 49. | Fanwood Borough | 56.9% | 38.0% (+18.9)#49 | 33.4% (+23.5)#1,329 |
| 50. | Emerson Borough | 56.5% | 38.0% (+18.5)#50 | 33.4% (+23.1)#1,384 |
| 51. | Alpine Borough | 56.5% | 38.0% (+18.5)#51 | 33.4% (+23.1)#1,395 |
| 52. | White Horse | 56.4% | 38.0% (+18.4)#52 | 33.4% (+23.0)#1,421 |
| 53. | Fieldsboro Borough | 56.4% | 38.0% (+18.4)#53 | 33.4% (+23.0)#1,436 |
| 54. | Elmwood Park Borough | 56.1% | 38.0% (+18.1)#54 | 33.4% (+22.7)#1,480 |
| 55. | Allendale Borough | 55.6% | 38.0% (+17.6)#55 | 33.4% (+22.2)#1,539 |
| 56. | Chatham Borough | 55.5% | 38.0% (+17.5)#56 | 33.4% (+22.1)#1,553 |
| 57. | Menlo Park Terrace | 55.5% | 38.0% (+17.5)#57 | 33.4% (+22.1)#1,558 |
| 58. | West Freehold | 55.1% | 38.0% (+17.1)#58 | 33.4% (+21.7)#1,658 |
| 59. | Oaklyn Borough | 55.0% | 38.0% (+17.0)#59 | 33.4% (+21.6)#1,679 |
| 60. | Allentown Borough | 55.0% | 38.0% (+17.0)#60 | 33.4% (+21.6)#1,683 |
| 61. | Avalon Borough | 54.5% | 38.0% (+16.5)#61 | 33.4% (+21.1)#1,750 |
| 62. | Kinnelon Borough | 54.4% | 38.0% (+16.4)#62 | 33.4% (+21.0)#1,769 |
| 63. | Beach Haven Borough | 54.3% | 38.0% (+16.3)#63 | 33.4% (+20.9)#1,795 |
| 64. | Parsippany | 54.2% | 38.0% (+16.2)#64 | 33.4% (+20.8)#1,805 |
| 65. | Peapack And Gladstone Borough | 54.2% | 38.0% (+16.2)#65 | 33.4% (+20.8)#1,816 |
| 66. | Lodi Borough | 54.1% | 38.0% (+16.1)#66 | 33.4% (+20.7)#1,827 |
| 67. | Carlstadt Borough | 54.1% | 38.0% (+16.1)#67 | 33.4% (+20.7)#1,834 |
| 68. | Princeton Meadows | 54.0% | 38.0% (+16.0)#68 | 33.4% (+20.6)#1,843 |
| 69. | Flanders | 54.0% | 38.0% (+16.0)#69 | 33.4% (+20.6)#1,845 |
| 70. | Franklin Lakes Borough | 53.7% | 38.0% (+15.7)#70 | 33.4% (+20.3)#1,883 |
| 71. | Glen Rock Borough | 53.3% | 38.0% (+15.3)#71 | 33.4% (+19.9)#1,969 |
| 72. | Avon By The Sea Borough | 52.9% | 38.0% (+14.9)#72 | 33.4% (+19.5)#2,049 |
| 73. | Linwood | 52.7% | 38.0% (+14.7)#73 | 33.4% (+19.3)#2,081 |
| 74. | Pine Brook | 52.5% | 38.0% (+14.5)#74 | 33.4% (+19.1)#2,109 |
| 75. | Ocean City | 52.3% | 38.0% (+14.3)#75 | 33.4% (+18.9)#2,163 |
| 76. | Westfield | 52.1% | 38.0% (+14.1)#76 | 33.4% (+18.7)#2,210 |
| 77. | Pompton Lakes Borough | 52.0% | 38.0% (+14.0)#77 | 33.4% (+18.6)#2,237 |
| 78. | Sicklerville | 51.6% | 38.0% (+13.6)#78 | 33.4% (+18.2)#2,274 |
| 79. | Paramus Borough | 51.5% | 38.0% (+13.5)#79 | 33.4% (+18.1)#2,290 |
| 80. | Harrington Park Borough | 51.3% | 38.0% (+13.3)#80 | 33.4% (+17.9)#2,348 |
| 81. | East Newark Borough | 51.3% | 38.0% (+13.3)#81 | 33.4% (+17.9)#2,350 |
| 82. | Westwood Borough | 51.0% | 38.0% (+13.0)#82 | 33.4% (+17.6)#2,400 |
| 83. | Brooklawn Borough | 51.0% | 38.0% (+13.0)#83 | 33.4% (+17.6)#2,406 |
| 84. | Fairview Borough | 50.5% | 38.0% (+12.5)#84 | 33.4% (+17.1)#2,484 |
| 85. | Wanaque Borough | 50.4% | 38.0% (+12.4)#85 | 33.4% (+17.0)#2,517 |
| 86. | Northfield | 50.4% | 38.0% (+12.4)#86 | 33.4% (+17.0)#2,520 |
| 87. | Ellisburg | 50.4% | 38.0% (+12.4)#87 | 33.4% (+17.0)#2,524 |
| 88. | Maywood Borough | 50.3% | 38.0% (+12.3)#88 | 33.4% (+16.9)#2,544 |
| 89. | Frenchtown Borough | 50.1% | 38.0% (+12.1)#89 | 33.4% (+16.7)#2,592 |
| 90. | Blairstown | 50.1% | 38.0% (+12.1)#90 | 33.4% (+16.7)#2,599 |
| 91. | Ashland | 50.0% | 38.0% (+12.0)#91 | 33.4% (+16.6)#2,605 |
| 92. | Lawnside Borough | 49.9% | 38.0% (+11.9)#92 | 33.4% (+16.5)#2,626 |
| 93. | Kenilworth Borough | 49.5% | 38.0% (+11.5)#93 | 33.4% (+16.1)#2,688 |
| 94. | Laurel Springs Borough | 49.5% | 38.0% (+11.5)#94 | 33.4% (+16.1)#2,699 |
| 95. | Leonia Borough | 49.4% | 38.0% (+11.4)#95 | 33.4% (+16.0)#2,727 |
| 96. | Madison Park | 49.3% | 38.0% (+11.3)#96 | 33.4% (+15.9)#2,743 |
| 97. | Toms River | 48.2% | 38.0% (+10.2)#97 | 33.4% (+14.8)#2,950 |
| 98. | Rio Grande | 48.2% | 38.0% (+10.2)#98 | 33.4% (+14.8)#2,966 |
| 99. | East Orange | 47.7% | 38.0% (+9.70)#99 | 33.4% (+14.3)#3,035 |
| 100. | Woodland Park Borough | 47.6% | 38.0% (+9.60)#100 | 33.4% (+14.2)#3,058 |
Common Questions
What are the Top 10 Cities with the Highest Percentage of Population Walking to Work in New Jersey?
Top 10 Cities with the Highest Percentage of Population Walking to Work in New Jersey are:
#1
66.4%
#2
63.2%
#3
62.3%
#4
61.3%
#5
60.4%
#6
59.9%
#7
59.4%
#8
58.3%
#9
58.2%
#10
57.7%
What city has the Highest Percentage of Population Walking to Work in New Jersey?
Bordentown has the Highest Percentage of Population Walking to Work in New Jersey with 66.4%.
What is the Percentage of Population Walking to Work in the State of New Jersey?
Percentage of Population Walking to Work in New Jersey is 38.0%.
What is the Percentage of Population Walking to Work in the United States?
Percentage of Population Walking to Work in the United States is 33.4%.