Cities with the Most Immigrants from Chile in New Jersey
RELATED REPORTS & OPTIONS
Chile
New Jersey
Compare Cities
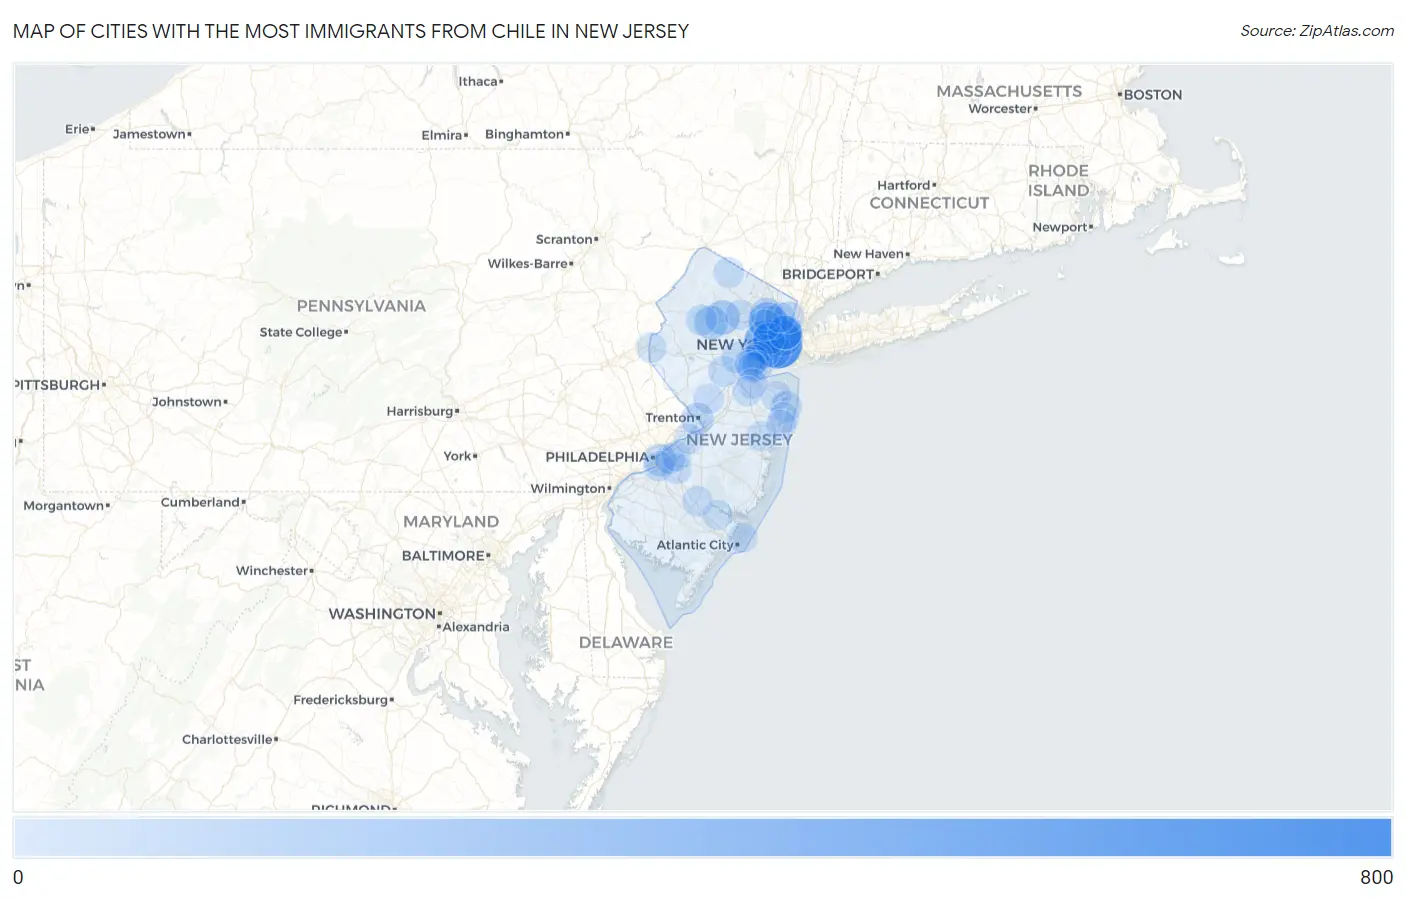
Map of Cities with the Most Immigrants from Chile in New Jersey
0
800
Cities with the Most Immigrants from Chile in New Jersey
| City | Chile | vs State | vs National | |
| 1. | Jersey City | 692 | 7,153(9.67%)#1 | 106,565(0.65%)#8 |
| 2. | Newark | 390 | 7,153(5.45%)#2 | 106,565(0.37%)#25 |
| 3. | Union City | 324 | 7,153(4.53%)#3 | 106,565(0.30%)#33 |
| 4. | Clifton | 272 | 7,153(3.80%)#4 | 106,565(0.26%)#44 |
| 5. | Kearny | 216 | 7,153(3.02%)#5 | 106,565(0.20%)#71 |
| 6. | Dover | 157 | 7,153(2.19%)#6 | 106,565(0.15%)#113 |
| 7. | Bayonne | 156 | 7,153(2.18%)#7 | 106,565(0.15%)#115 |
| 8. | Guttenberg | 154 | 7,153(2.15%)#8 | 106,565(0.14%)#117 |
| 9. | Passaic | 132 | 7,153(1.85%)#9 | 106,565(0.12%)#135 |
| 10. | Elizabeth | 130 | 7,153(1.82%)#10 | 106,565(0.12%)#138 |
| 11. | Succasunna | 130 | 7,153(1.82%)#11 | 106,565(0.12%)#140 |
| 12. | West New York | 123 | 7,153(1.72%)#12 | 106,565(0.12%)#153 |
| 13. | Port Morris | 116 | 7,153(1.62%)#13 | 106,565(0.11%)#168 |
| 14. | Lake Hiawatha | 114 | 7,153(1.59%)#14 | 106,565(0.11%)#171 |
| 15. | Wharton Borough | 112 | 7,153(1.57%)#15 | 106,565(0.11%)#176 |
| 16. | Highland Park Borough | 97 | 7,153(1.36%)#16 | 106,565(0.09%)#210 |
| 17. | Fair Lawn Borough | 91 | 7,153(1.27%)#17 | 106,565(0.09%)#232 |
| 18. | Rutherford Borough | 87 | 7,153(1.22%)#18 | 106,565(0.08%)#238 |
| 19. | North Plainfield Borough | 85 | 7,153(1.19%)#19 | 106,565(0.08%)#244 |
| 20. | Camden | 82 | 7,153(1.15%)#20 | 106,565(0.08%)#254 |
| 21. | Riverdale Borough | 79 | 7,153(1.10%)#21 | 106,565(0.07%)#267 |
| 22. | Trenton | 78 | 7,153(1.09%)#22 | 106,565(0.07%)#270 |
| 23. | Paterson | 77 | 7,153(1.08%)#23 | 106,565(0.07%)#277 |
| 24. | Bergenfield Borough | 69 | 7,153(0.96%)#24 | 106,565(0.06%)#311 |
| 25. | East Newark Borough | 69 | 7,153(0.96%)#25 | 106,565(0.06%)#314 |
| 26. | Tenafly Borough | 65 | 7,153(0.91%)#26 | 106,565(0.06%)#335 |
| 27. | Englewood | 61 | 7,153(0.85%)#27 | 106,565(0.06%)#353 |
| 28. | Harrison | 55 | 7,153(0.77%)#28 | 106,565(0.05%)#392 |
| 29. | South Bound Brook Borough | 50 | 7,153(0.70%)#29 | 106,565(0.05%)#428 |
| 30. | Fieldsboro Borough | 50 | 7,153(0.70%)#30 | 106,565(0.05%)#429 |
| 31. | Tinton Falls Borough | 48 | 7,153(0.67%)#31 | 106,565(0.05%)#443 |
| 32. | Long Branch | 47 | 7,153(0.66%)#32 | 106,565(0.04%)#450 |
| 33. | Plainfield | 46 | 7,153(0.64%)#33 | 106,565(0.04%)#460 |
| 34. | Chatham Borough | 45 | 7,153(0.63%)#34 | 106,565(0.04%)#473 |
| 35. | Hasbrouck Heights Borough | 44 | 7,153(0.62%)#35 | 106,565(0.04%)#481 |
| 36. | Franklin Center | 40 | 7,153(0.56%)#36 | 106,565(0.04%)#538 |
| 37. | Colonia | 38 | 7,153(0.53%)#37 | 106,565(0.04%)#550 |
| 38. | Edgewater Borough | 38 | 7,153(0.53%)#38 | 106,565(0.04%)#551 |
| 39. | Hamburg Borough | 38 | 7,153(0.53%)#39 | 106,565(0.04%)#553 |
| 40. | South Plainfield Borough | 35 | 7,153(0.49%)#40 | 106,565(0.03%)#590 |
| 41. | Brookdale | 35 | 7,153(0.49%)#41 | 106,565(0.03%)#595 |
| 42. | Budd Lake | 35 | 7,153(0.49%)#42 | 106,565(0.03%)#596 |
| 43. | Victory Gardens Borough | 33 | 7,153(0.46%)#43 | 106,565(0.03%)#626 |
| 44. | Rumson Borough | 31 | 7,153(0.43%)#44 | 106,565(0.03%)#651 |
| 45. | Wood Ridge Borough | 29 | 7,153(0.41%)#45 | 106,565(0.03%)#681 |
| 46. | Fairview Borough | 24 | 7,153(0.34%)#46 | 106,565(0.02%)#767 |
| 47. | River Edge Borough | 24 | 7,153(0.34%)#47 | 106,565(0.02%)#770 |
| 48. | Millington | 24 | 7,153(0.34%)#48 | 106,565(0.02%)#776 |
| 49. | Springdale | 23 | 7,153(0.32%)#49 | 106,565(0.02%)#790 |
| 50. | Phillipsburg | 23 | 7,153(0.32%)#50 | 106,565(0.02%)#791 |
| 51. | Linden | 22 | 7,153(0.31%)#51 | 106,565(0.02%)#801 |
| 52. | Paramus Borough | 22 | 7,153(0.31%)#52 | 106,565(0.02%)#805 |
| 53. | Roselle Borough | 22 | 7,153(0.31%)#53 | 106,565(0.02%)#808 |
| 54. | Bloomingdale Borough | 22 | 7,153(0.31%)#54 | 106,565(0.02%)#814 |
| 55. | Emerson Borough | 22 | 7,153(0.31%)#55 | 106,565(0.02%)#815 |
| 56. | Port Reading | 22 | 7,153(0.31%)#56 | 106,565(0.02%)#816 |
| 57. | Lincoln Park Borough | 20 | 7,153(0.28%)#57 | 106,565(0.02%)#857 |
| 58. | Palisades Park Borough | 19 | 7,153(0.27%)#58 | 106,565(0.02%)#888 |
| 59. | Eatontown Borough | 19 | 7,153(0.27%)#59 | 106,565(0.02%)#891 |
| 60. | Cherry Hill Mall | 19 | 7,153(0.27%)#60 | 106,565(0.02%)#893 |
| 61. | Mendham Borough | 19 | 7,153(0.27%)#61 | 106,565(0.02%)#897 |
| 62. | Vernon Center | 19 | 7,153(0.27%)#62 | 106,565(0.02%)#899 |
| 63. | Cliffside Park Borough | 18 | 7,153(0.25%)#63 | 106,565(0.02%)#909 |
| 64. | Leonia Borough | 18 | 7,153(0.25%)#64 | 106,565(0.02%)#921 |
| 65. | Madison Borough | 17 | 7,153(0.24%)#65 | 106,565(0.02%)#949 |
| 66. | Gloucester City | 17 | 7,153(0.24%)#66 | 106,565(0.02%)#952 |
| 67. | Packanack Lake | 17 | 7,153(0.24%)#67 | 106,565(0.02%)#958 |
| 68. | Sayreville Borough | 15 | 7,153(0.21%)#68 | 106,565(0.01%)#999 |
| 69. | Princeton | 15 | 7,153(0.21%)#69 | 106,565(0.01%)#1,006 |
| 70. | Rahway | 15 | 7,153(0.21%)#70 | 106,565(0.01%)#1,007 |
| 71. | Iselin | 15 | 7,153(0.21%)#71 | 106,565(0.01%)#1,014 |
| 72. | Hammonton | 15 | 7,153(0.21%)#72 | 106,565(0.01%)#1,018 |
| 73. | Franklin Borough | 15 | 7,153(0.21%)#73 | 106,565(0.01%)#1,032 |
| 74. | Lakewood | 14 | 7,153(0.20%)#74 | 106,565(0.01%)#1,042 |
| 75. | Woodbridge | 14 | 7,153(0.20%)#75 | 106,565(0.01%)#1,052 |
| 76. | Somerville Borough | 14 | 7,153(0.20%)#76 | 106,565(0.01%)#1,058 |
| 77. | Ledgewood | 14 | 7,153(0.20%)#77 | 106,565(0.01%)#1,062 |
| 78. | Fairview | 14 | 7,153(0.20%)#78 | 106,565(0.01%)#1,064 |
| 79. | Moorestown Lenola | 13 | 7,153(0.18%)#79 | 106,565(0.01%)#1,098 |
| 80. | Hillsdale Borough | 13 | 7,153(0.18%)#80 | 106,565(0.01%)#1,104 |
| 81. | Boonton | 13 | 7,153(0.18%)#81 | 106,565(0.01%)#1,108 |
| 82. | Flemington Borough | 13 | 7,153(0.18%)#82 | 106,565(0.01%)#1,112 |
| 83. | Gillette | 13 | 7,153(0.18%)#83 | 106,565(0.01%)#1,114 |
| 84. | Asbury Park | 12 | 7,153(0.17%)#84 | 106,565(0.01%)#1,143 |
| 85. | Roselle Park Borough | 12 | 7,153(0.17%)#85 | 106,565(0.01%)#1,144 |
| 86. | Ampere North | 12 | 7,153(0.17%)#86 | 106,565(0.01%)#1,150 |
| 87. | West Belmar | 12 | 7,153(0.17%)#87 | 106,565(0.01%)#1,154 |
| 88. | Madison Park | 11 | 7,153(0.15%)#88 | 106,565(0.01%)#1,193 |
| 89. | Little Ferry Borough | 10 | 7,153(0.14%)#89 | 106,565(0.01%)#1,236 |
| 90. | Old Bridge | 9 | 7,153(0.13%)#90 | 106,565(0.01%)#1,264 |
| 91. | Burlington | 8 | 7,153(0.11%)#91 | 106,565(0.01%)#1,324 |
| 92. | Egg Harbor City | 8 | 7,153(0.11%)#92 | 106,565(0.01%)#1,333 |
| 93. | Folsom Borough | 8 | 7,153(0.11%)#93 | 106,565(0.01%)#1,337 |
| 94. | Brigantine | 7 | 7,153(0.10%)#94 | 106,565(0.01%)#1,377 |
| 95. | Hackensack | 6 | 7,153(0.08%)#95 | 106,565(0.01%)#1,393 |
| 96. | North Arlington Borough | 5 | 7,153(0.07%)#96 | 106,565(0.00%)#1,439 |
| 97. | Elmwood Park Borough | 4 | 7,153(0.06%)#97 | 106,565(0.00%)#1,461 |
| 98. | Ogdensburg Borough | 3 | 7,153(0.04%)#98 | 106,565(0.00%)#1,512 |
| 99. | Bay Head Borough | 3 | 7,153(0.04%)#99 | 106,565(0.00%)#1,519 |
Common Questions
What are the Top 10 Cities with the Most Immigrants from Chile in New Jersey?
Top 10 Cities with the Most Immigrants from Chile in New Jersey are:
#1
692
#2
390
#3
324
#4
272
#5
216
#6
157
#7
156
#8
154
#9
132
#10
130
What city has the Most Immigrants from Chile in New Jersey?
Jersey City has the Most Immigrants from Chile in New Jersey with 692.
What is the Total Immigrants from Chile in the State of New Jersey?
Total Immigrants from Chile in New Jersey is 7,153.
What is the Total Immigrants from Chile in the United States?
Total Immigrants from Chile in the United States is 106,565.