Cities with the Largest Spanish Community in New Jersey
RELATED REPORTS & OPTIONS
Spanish
New Jersey
Compare Cities
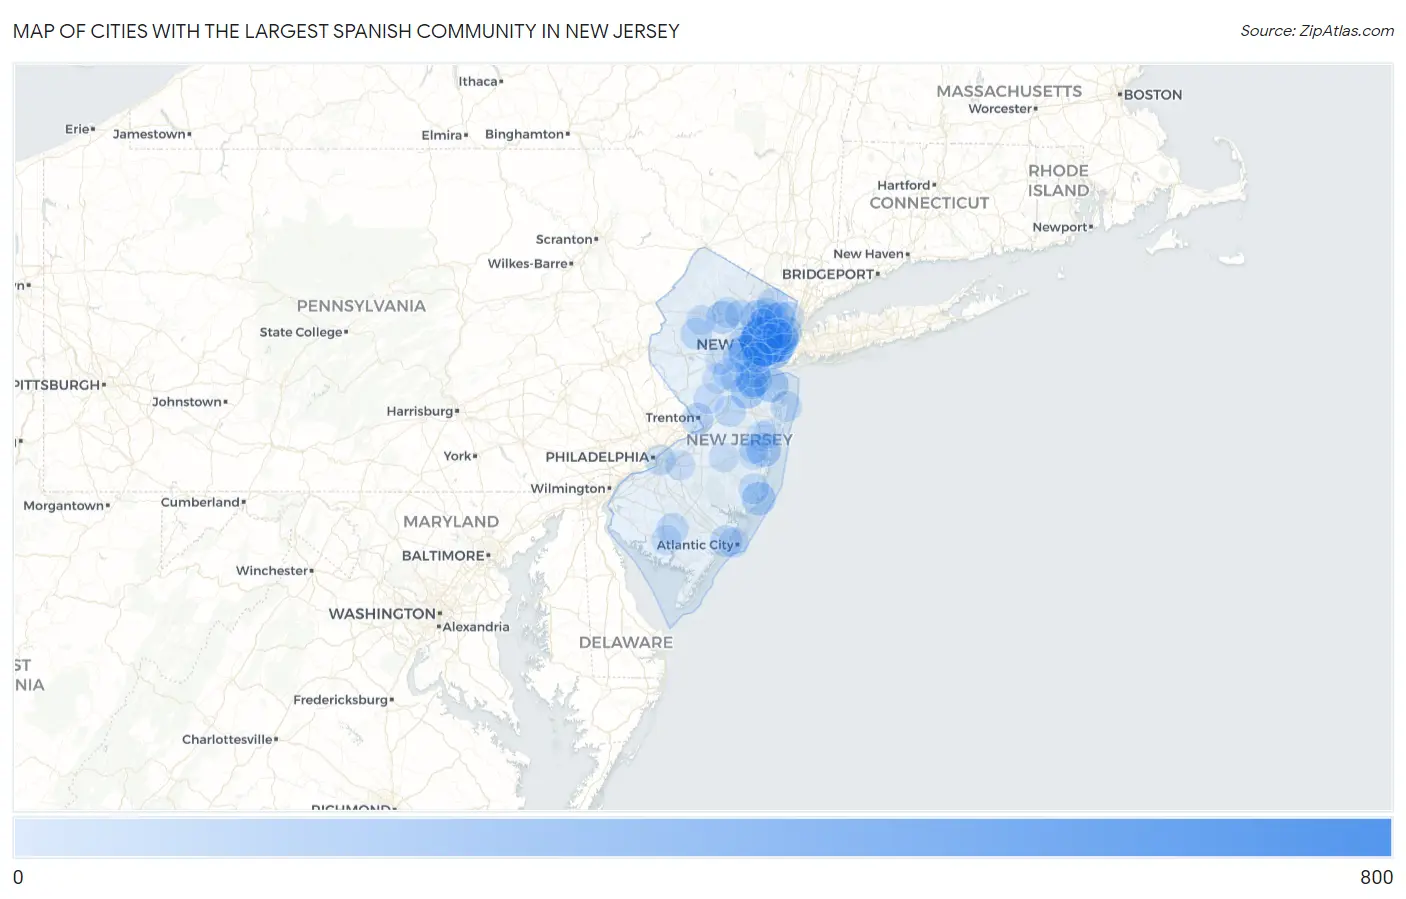
Map of Cities with the Largest Spanish Community in New Jersey
0
800
Cities with the Largest Spanish Community in New Jersey
| City | Spanish | vs State | vs National | |
| 1. | Newark | 673 | 15,741(4.28%)#1 | 776,448(0.09%)#131 |
| 2. | Sayreville Borough | 268 | 15,741(1.70%)#2 | 776,448(0.03%)#467 |
| 3. | Bayonne | 266 | 15,741(1.69%)#3 | 776,448(0.03%)#473 |
| 4. | Jersey City | 263 | 15,741(1.67%)#4 | 776,448(0.03%)#481 |
| 5. | South Amboy | 222 | 15,741(1.41%)#5 | 776,448(0.03%)#583 |
| 6. | North Plainfield Borough | 219 | 15,741(1.39%)#6 | 776,448(0.03%)#592 |
| 7. | Westfield | 198 | 15,741(1.26%)#7 | 776,448(0.03%)#668 |
| 8. | Wharton Borough | 194 | 15,741(1.23%)#8 | 776,448(0.02%)#684 |
| 9. | Old Bridge | 173 | 15,741(1.10%)#9 | 776,448(0.02%)#768 |
| 10. | North Middletown | 173 | 15,741(1.10%)#10 | 776,448(0.02%)#774 |
| 11. | Singac | 170 | 15,741(1.08%)#11 | 776,448(0.02%)#798 |
| 12. | Fair Lawn Borough | 166 | 15,741(1.05%)#12 | 776,448(0.02%)#816 |
| 13. | Toms River | 158 | 15,741(1.00%)#13 | 776,448(0.02%)#847 |
| 14. | West New York | 148 | 15,741(0.94%)#14 | 776,448(0.02%)#901 |
| 15. | Neshanic Station | 145 | 15,741(0.92%)#15 | 776,448(0.02%)#918 |
| 16. | Beach Haven West | 145 | 15,741(0.92%)#16 | 776,448(0.02%)#919 |
| 17. | Somerville Borough | 138 | 15,741(0.88%)#17 | 776,448(0.02%)#964 |
| 18. | Summit | 133 | 15,741(0.84%)#18 | 776,448(0.02%)#991 |
| 19. | Garwood Borough | 130 | 15,741(0.83%)#19 | 776,448(0.02%)#1,012 |
| 20. | Hawthorne Borough | 125 | 15,741(0.79%)#20 | 776,448(0.02%)#1,041 |
| 21. | Clifton | 123 | 15,741(0.78%)#21 | 776,448(0.02%)#1,050 |
| 22. | Dover | 116 | 15,741(0.74%)#22 | 776,448(0.01%)#1,111 |
| 23. | Union City | 111 | 15,741(0.71%)#23 | 776,448(0.01%)#1,145 |
| 24. | Ho Ho Kus Borough | 108 | 15,741(0.69%)#24 | 776,448(0.01%)#1,172 |
| 25. | Hoboken | 106 | 15,741(0.67%)#25 | 776,448(0.01%)#1,181 |
| 26. | Carteret Borough | 95 | 15,741(0.60%)#26 | 776,448(0.01%)#1,306 |
| 27. | Hillsborough | 95 | 15,741(0.60%)#27 | 776,448(0.01%)#1,308 |
| 28. | Pleasantville | 95 | 15,741(0.60%)#28 | 776,448(0.01%)#1,309 |
| 29. | Bergenfield Borough | 90 | 15,741(0.57%)#29 | 776,448(0.01%)#1,366 |
| 30. | Hopatcong Borough | 89 | 15,741(0.57%)#30 | 776,448(0.01%)#1,388 |
| 31. | Ridgefield Borough | 88 | 15,741(0.56%)#31 | 776,448(0.01%)#1,403 |
| 32. | Garfield | 87 | 15,741(0.55%)#32 | 776,448(0.01%)#1,416 |
| 33. | Lodi Borough | 87 | 15,741(0.55%)#33 | 776,448(0.01%)#1,418 |
| 34. | Trenton | 86 | 15,741(0.55%)#34 | 776,448(0.01%)#1,426 |
| 35. | Vineland | 83 | 15,741(0.53%)#35 | 776,448(0.01%)#1,476 |
| 36. | Madison Borough | 83 | 15,741(0.53%)#36 | 776,448(0.01%)#1,487 |
| 37. | Paterson | 82 | 15,741(0.52%)#37 | 776,448(0.01%)#1,496 |
| 38. | Hillsdale Borough | 82 | 15,741(0.52%)#38 | 776,448(0.01%)#1,506 |
| 39. | Pompton Lakes Borough | 81 | 15,741(0.51%)#39 | 776,448(0.01%)#1,521 |
| 40. | Ridgewood | 79 | 15,741(0.50%)#40 | 776,448(0.01%)#1,546 |
| 41. | Englewood | 78 | 15,741(0.50%)#41 | 776,448(0.01%)#1,556 |
| 42. | Cliffside Park Borough | 78 | 15,741(0.50%)#42 | 776,448(0.01%)#1,557 |
| 43. | Hackensack | 75 | 15,741(0.48%)#43 | 776,448(0.01%)#1,585 |
| 44. | Twin Rivers | 74 | 15,741(0.47%)#44 | 776,448(0.01%)#1,610 |
| 45. | Long Valley | 74 | 15,741(0.47%)#45 | 776,448(0.01%)#1,617 |
| 46. | Colonia | 70 | 15,741(0.44%)#46 | 776,448(0.01%)#1,674 |
| 47. | Spotswood Borough | 70 | 15,741(0.44%)#47 | 776,448(0.01%)#1,675 |
| 48. | Long Branch | 68 | 15,741(0.43%)#48 | 776,448(0.01%)#1,698 |
| 49. | Mountain Lakes Borough | 68 | 15,741(0.43%)#49 | 776,448(0.01%)#1,714 |
| 50. | Elizabeth | 64 | 15,741(0.41%)#50 | 776,448(0.01%)#1,778 |
| 51. | Keansburg Borough | 64 | 15,741(0.41%)#51 | 776,448(0.01%)#1,787 |
| 52. | White Meadow Lake | 61 | 15,741(0.39%)#52 | 776,448(0.01%)#1,858 |
| 53. | Madison Park | 58 | 15,741(0.37%)#53 | 776,448(0.01%)#1,920 |
| 54. | Belmar Borough | 58 | 15,741(0.37%)#54 | 776,448(0.01%)#1,922 |
| 55. | Parsippany | 56 | 15,741(0.36%)#55 | 776,448(0.01%)#1,947 |
| 56. | Camden | 55 | 15,741(0.35%)#56 | 776,448(0.01%)#1,969 |
| 57. | Somerset | 55 | 15,741(0.35%)#57 | 776,448(0.01%)#1,974 |
| 58. | Ocean Acres | 55 | 15,741(0.35%)#58 | 776,448(0.01%)#1,976 |
| 59. | The Hills | 55 | 15,741(0.35%)#59 | 776,448(0.01%)#1,985 |
| 60. | Hightstown Borough | 55 | 15,741(0.35%)#60 | 776,448(0.01%)#1,989 |
| 61. | Oak Ridge | 51 | 15,741(0.32%)#61 | 776,448(0.01%)#2,083 |
| 62. | Boonton | 49 | 15,741(0.31%)#62 | 776,448(0.01%)#2,140 |
| 63. | Florham Park Borough | 48 | 15,741(0.30%)#63 | 776,448(0.01%)#2,166 |
| 64. | Kearny | 46 | 15,741(0.29%)#64 | 776,448(0.01%)#2,212 |
| 65. | Dorothy | 44 | 15,741(0.28%)#65 | 776,448(0.01%)#2,294 |
| 66. | South Plainfield Borough | 43 | 15,741(0.27%)#66 | 776,448(0.01%)#2,309 |
| 67. | Bound Brook Borough | 42 | 15,741(0.27%)#67 | 776,448(0.01%)#2,352 |
| 68. | Flanders | 41 | 15,741(0.26%)#68 | 776,448(0.01%)#2,388 |
| 69. | Millville | 40 | 15,741(0.25%)#69 | 776,448(0.01%)#2,411 |
| 70. | Perth Amboy | 38 | 15,741(0.24%)#70 | 776,448(0.00%)#2,488 |
| 71. | Princeton | 37 | 15,741(0.24%)#71 | 776,448(0.00%)#2,525 |
| 72. | Prospect Park Borough | 37 | 15,741(0.24%)#72 | 776,448(0.00%)#2,540 |
| 73. | Harrison | 36 | 15,741(0.23%)#73 | 776,448(0.00%)#2,563 |
| 74. | Rutherford Borough | 35 | 15,741(0.22%)#74 | 776,448(0.00%)#2,608 |
| 75. | Budd Lake | 35 | 15,741(0.22%)#75 | 776,448(0.00%)#2,620 |
| 76. | Upper Montclair | 34 | 15,741(0.22%)#76 | 776,448(0.00%)#2,658 |
| 77. | Lakewood | 33 | 15,741(0.21%)#77 | 776,448(0.00%)#2,684 |
| 78. | Palisades Park Borough | 33 | 15,741(0.21%)#78 | 776,448(0.00%)#2,701 |
| 79. | North Arlington Borough | 33 | 15,741(0.21%)#79 | 776,448(0.00%)#2,704 |
| 80. | Pompton Plains | 33 | 15,741(0.21%)#80 | 776,448(0.00%)#2,713 |
| 81. | Marlton | 33 | 15,741(0.21%)#81 | 776,448(0.00%)#2,715 |
| 82. | Audubon Borough | 33 | 15,741(0.21%)#82 | 776,448(0.00%)#2,721 |
| 83. | Holiday City Berkeley | 32 | 15,741(0.20%)#83 | 776,448(0.00%)#2,768 |
| 84. | Ledgewood | 32 | 15,741(0.20%)#84 | 776,448(0.00%)#2,779 |
| 85. | Atlantic City | 31 | 15,741(0.20%)#85 | 776,448(0.00%)#2,806 |
| 86. | South River Borough | 31 | 15,741(0.20%)#86 | 776,448(0.00%)#2,815 |
| 87. | Blackwells Mills | 31 | 15,741(0.20%)#87 | 776,448(0.00%)#2,825 |
| 88. | Harrington Park Borough | 31 | 15,741(0.20%)#88 | 776,448(0.00%)#2,831 |
| 89. | Whippany | 30 | 15,741(0.19%)#89 | 776,448(0.00%)#2,874 |
| 90. | New Brunswick | 29 | 15,741(0.18%)#90 | 776,448(0.00%)#2,897 |
| 91. | New Milford Borough | 29 | 15,741(0.18%)#91 | 776,448(0.00%)#2,912 |
| 92. | Martinsville | 29 | 15,741(0.18%)#92 | 776,448(0.00%)#2,918 |
| 93. | Linden | 28 | 15,741(0.18%)#93 | 776,448(0.00%)#2,953 |
| 94. | Country Lake Estates | 28 | 15,741(0.18%)#94 | 776,448(0.00%)#2,982 |
| 95. | Basking Ridge | 27 | 15,741(0.17%)#95 | 776,448(0.00%)#3,023 |
| 96. | Ramtown | 27 | 15,741(0.17%)#96 | 776,448(0.00%)#3,029 |
| 97. | Essex Fells Borough | 27 | 15,741(0.17%)#97 | 776,448(0.00%)#3,038 |
| 98. | Secaucus | 26 | 15,741(0.17%)#98 | 776,448(0.00%)#3,061 |
| 99. | Leisure Village West | 26 | 15,741(0.17%)#99 | 776,448(0.00%)#3,085 |
| 100. | Plainfield | 25 | 15,741(0.16%)#100 | 776,448(0.00%)#3,106 |
Common Questions
What are the Top 10 Cities with the Largest Spanish Community in New Jersey?
Top 10 Cities with the Largest Spanish Community in New Jersey are:
#1
673
#2
266
#3
263
#4
222
#5
198
#6
173
#7
173
#8
170
#9
158
#10
148
What city has the Largest Spanish Community in New Jersey?
Newark has the Largest Spanish Community in New Jersey with 673.
What is the Total Spanish Population in the State of New Jersey?
Total Spanish Population in New Jersey is 15,741.
What is the Total Spanish Population in the United States?
Total Spanish Population in the United States is 776,448.