Cities with the Highest Percentage of Population Taking Taxi / Cab to Work in New Jersey
RELATED REPORTS & OPTIONS
Taxi / Cab
New Jersey
Compare Cities
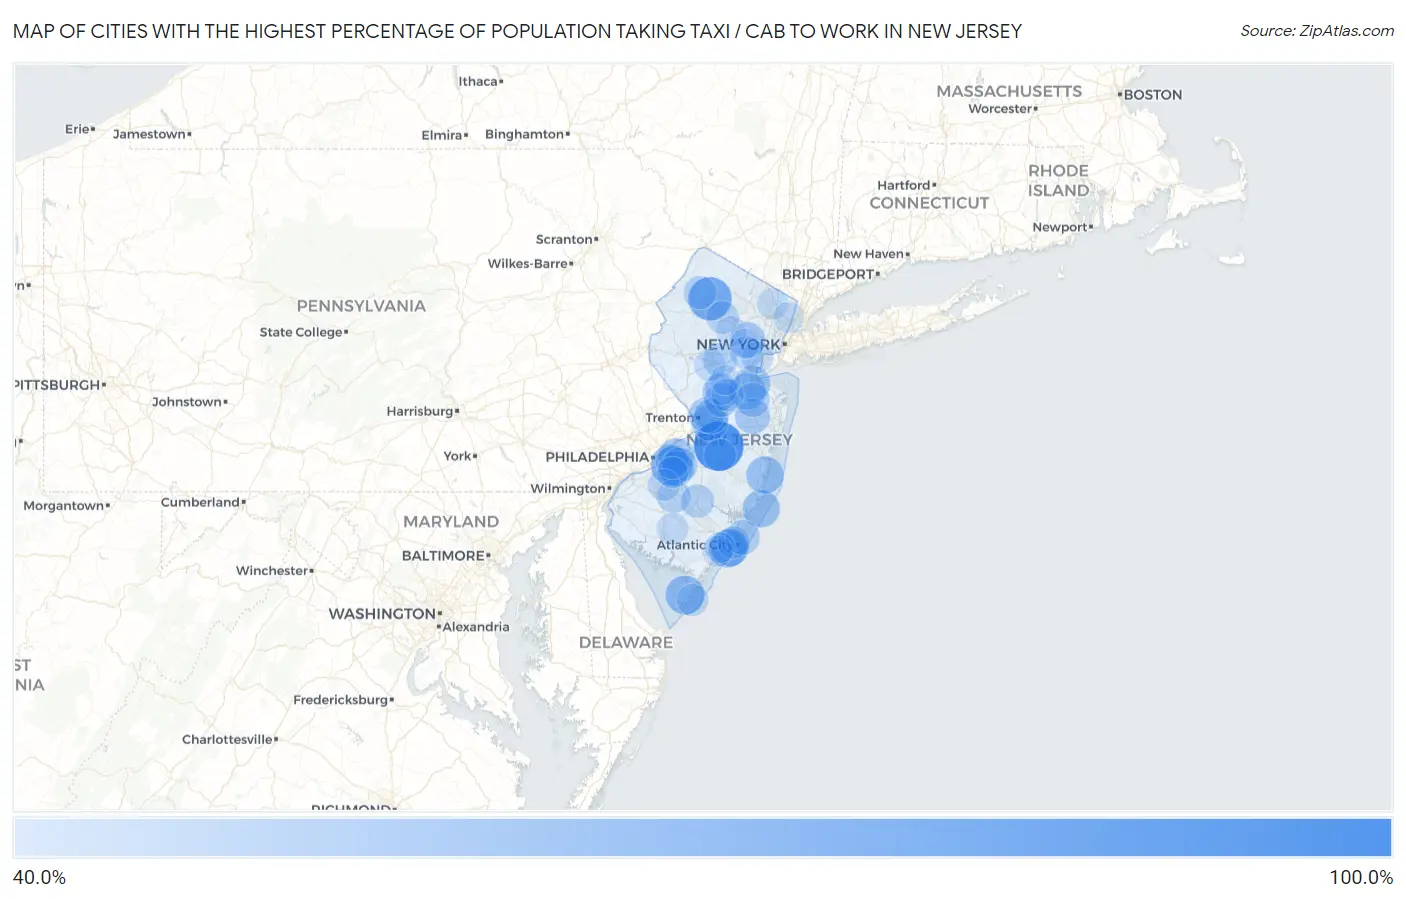
Map of Cities with the Highest Percentage of Population Taking Taxi / Cab to Work in New Jersey
0.0%
100.0%
Cities with the Highest Percentage of Population Taking Taxi / Cab to Work in New Jersey
| City | % Take Taxi / Cab | vs State | vs National | |
| 1. | Mcguire Afb | 85.2% | 39.4%(+45.8)#1 | 38.2%(+47.0)#1 |
| 2. | Lake Mohawk | 71.3% | 39.4%(+31.9)#2 | 38.2%(+33.1)#21 |
| 3. | Stone Harbor Borough | 70.5% | 39.4%(+31.1)#3 | 38.2%(+32.3)#32 |
| 4. | Franklin Lakes Borough | 68.7% | 39.4%(+29.3)#4 | 38.2%(+30.5)#54 |
| 5. | Barclay | 66.0% | 39.4%(+26.6)#5 | 38.2%(+27.8)#101 |
| 6. | Woodlynne Borough | 65.6% | 39.4%(+26.2)#6 | 38.2%(+27.4)#103 |
| 7. | Riverton Borough | 62.0% | 39.4%(+22.6)#7 | 38.2%(+23.8)#246 |
| 8. | Monmouth Beach Borough | 61.7% | 39.4%(+22.3)#8 | 38.2%(+23.5)#257 |
| 9. | Rio Grande | 61.6% | 39.4%(+22.2)#9 | 38.2%(+23.4)#261 |
| 10. | Madison Borough | 61.1% | 39.4%(+21.7)#10 | 38.2%(+22.9)#291 |
| 11. | Florham Park Borough | 60.5% | 39.4%(+21.1)#11 | 38.2%(+22.3)#318 |
| 12. | Ho Ho Kus Borough | 60.4% | 39.4%(+21.0)#12 | 38.2%(+22.2)#326 |
| 13. | Flemington Borough | 60.0% | 39.4%(+20.6)#13 | 38.2%(+21.8)#365 |
| 14. | Margate City | 59.4% | 39.4%(+20.0)#14 | 38.2%(+21.2)#407 |
| 15. | Beach Haven Borough | 59.4% | 39.4%(+20.0)#15 | 38.2%(+21.2)#410 |
| 16. | Point Pleasant Beach Borough | 59.1% | 39.4%(+19.7)#16 | 38.2%(+20.9)#442 |
| 17. | Ventnor City | 58.9% | 39.4%(+19.5)#17 | 38.2%(+20.7)#451 |
| 18. | Hopatcong Borough | 58.8% | 39.4%(+19.4)#18 | 38.2%(+20.6)#453 |
| 19. | Spotswood Borough | 58.3% | 39.4%(+18.9)#19 | 38.2%(+20.1)#497 |
| 20. | Franklin Borough | 58.3% | 39.4%(+18.9)#20 | 38.2%(+20.1)#499 |
| 21. | North Beach Haven | 58.3% | 39.4%(+18.9)#21 | 38.2%(+20.1)#500 |
| 22. | Forked River | 58.2% | 39.4%(+18.8)#22 | 38.2%(+20.0)#518 |
| 23. | Dunellen Borough | 58.1% | 39.4%(+18.7)#23 | 38.2%(+19.9)#523 |
| 24. | Mendham Borough | 57.9% | 39.4%(+18.5)#24 | 38.2%(+19.7)#543 |
| 25. | Sea Girt Borough | 57.5% | 39.4%(+18.1)#25 | 38.2%(+19.3)#578 |
| 26. | Milltown Borough | 57.4% | 39.4%(+18.0)#26 | 38.2%(+19.2)#589 |
| 27. | Old Bridge | 57.3% | 39.4%(+17.9)#27 | 38.2%(+19.1)#594 |
| 28. | East Rutherford Borough | 56.6% | 39.4%(+17.2)#28 | 38.2%(+18.4)#652 |
| 29. | Yardville | 56.4% | 39.4%(+17.0)#29 | 38.2%(+18.2)#682 |
| 30. | Avon By The Sea Borough | 56.4% | 39.4%(+17.0)#30 | 38.2%(+18.2)#683 |
| 31. | Highlands Borough | 56.0% | 39.4%(+16.6)#31 | 38.2%(+17.8)#729 |
| 32. | Moorestown Lenola | 55.5% | 39.4%(+16.1)#32 | 38.2%(+17.3)#776 |
| 33. | Madison Park | 55.3% | 39.4%(+15.9)#33 | 38.2%(+17.1)#810 |
| 34. | Gibbsboro Borough | 55.1% | 39.4%(+15.7)#34 | 38.2%(+16.9)#849 |
| 35. | Carteret Borough | 54.5% | 39.4%(+15.1)#35 | 38.2%(+16.3)#891 |
| 36. | Springdale | 54.3% | 39.4%(+14.9)#36 | 38.2%(+16.1)#919 |
| 37. | Heathcote | 54.1% | 39.4%(+14.7)#37 | 38.2%(+15.9)#964 |
| 38. | West Freehold | 54.0% | 39.4%(+14.6)#39 | 38.2%(+15.8)#971 |
| 39. | Short Hills | 54.0% | 39.4%(+14.6)#40 | 38.2%(+15.8)#972 |
| 40. | Mercerville | 53.9% | 39.4%(+14.5)#41 | 38.2%(+15.7)#983 |
| 41. | Ship Bottom Borough | 53.3% | 39.4%(+13.9)#42 | 38.2%(+15.1)#1,041 |
| 42. | Park Ridge Borough | 53.1% | 39.4%(+13.7)#43 | 38.2%(+14.9)#1,062 |
| 43. | Hamilton Square | 52.9% | 39.4%(+13.5)#44 | 38.2%(+14.7)#1,085 |
| 44. | Marlton | 52.7% | 39.4%(+13.3)#45 | 38.2%(+14.5)#1,100 |
| 45. | Brigantine | 52.4% | 39.4%(+13.0)#46 | 38.2%(+14.2)#1,136 |
| 46. | Chatham Borough | 52.3% | 39.4%(+12.9)#47 | 38.2%(+14.1)#1,161 |
| 47. | New Milford Borough | 51.6% | 39.4%(+12.2)#48 | 38.2%(+13.4)#1,241 |
| 48. | Robertsville | 51.6% | 39.4%(+12.2)#49 | 38.2%(+13.4)#1,242 |
| 49. | Audubon Borough | 51.5% | 39.4%(+12.1)#50 | 38.2%(+13.3)#1,261 |
| 50. | Princeton Meadows | 51.4% | 39.4%(+12.0)#51 | 38.2%(+13.2)#1,285 |
| 51. | Caldwell Borough | 51.4% | 39.4%(+12.0)#52 | 38.2%(+13.2)#1,290 |
| 52. | Carlstadt Borough | 51.3% | 39.4%(+11.9)#53 | 38.2%(+13.1)#1,309 |
| 53. | Lincoln Park Borough | 50.9% | 39.4%(+11.5)#54 | 38.2%(+12.7)#1,357 |
| 54. | Hillsdale Borough | 50.9% | 39.4%(+11.5)#55 | 38.2%(+12.7)#1,358 |
| 55. | Martinsville | 50.8% | 39.4%(+11.4)#56 | 38.2%(+12.6)#1,365 |
| 56. | Wanaque Borough | 50.4% | 39.4%(+11.0)#57 | 38.2%(+12.2)#1,419 |
| 57. | Williamstown | 50.3% | 39.4%(+10.9)#58 | 38.2%(+12.1)#1,435 |
| 58. | River Edge Borough | 50.0% | 39.4%(+10.6)#59 | 38.2%(+11.8)#1,477 |
| 59. | Hammonton | 49.8% | 39.4%(+10.4)#60 | 38.2%(+11.6)#1,502 |
| 60. | Sicklerville | 49.6% | 39.4%(+10.2)#61 | 38.2%(+11.4)#1,526 |
| 61. | Newton | 49.6% | 39.4%(+10.2)#62 | 38.2%(+11.4)#1,534 |
| 62. | Union Beach Borough | 49.6% | 39.4%(+10.2)#63 | 38.2%(+11.4)#1,535 |
| 63. | East Newark Borough | 49.3% | 39.4%(+9.90)#64 | 38.2%(+11.1)#1,598 |
| 64. | Waldwick Borough | 49.2% | 39.4%(+9.80)#65 | 38.2%(+11.0)#1,614 |
| 65. | Kingston Estates | 49.1% | 39.4%(+9.70)#66 | 38.2%(+10.9)#1,635 |
| 66. | Interlaken Borough | 49.0% | 39.4%(+9.60)#67 | 38.2%(+10.8)#1,657 |
| 67. | Eatontown Borough | 48.7% | 39.4%(+9.30)#68 | 38.2%(+10.5)#1,710 |
| 68. | Swedesboro Borough | 48.6% | 39.4%(+9.20)#69 | 38.2%(+10.4)#1,730 |
| 69. | Bergenfield Borough | 48.5% | 39.4%(+9.10)#70 | 38.2%(+10.3)#1,739 |
| 70. | Dover | 48.5% | 39.4%(+9.10)#71 | 38.2%(+10.3)#1,741 |
| 71. | New Providence Borough | 48.3% | 39.4%(+8.90)#72 | 38.2%(+10.1)#1,791 |
| 72. | Fair Lawn Borough | 48.2% | 39.4%(+8.80)#73 | 38.2%(+10.0)#1,806 |
| 73. | Westfield | 48.1% | 39.4%(+8.70)#74 | 38.2%(+9.90)#1,818 |
| 74. | Kendall Park | 48.0% | 39.4%(+8.60)#75 | 38.2%(+9.80)#1,844 |
| 75. | Dayton | 48.0% | 39.4%(+8.60)#76 | 38.2%(+9.80)#1,846 |
| 76. | Linden | 47.6% | 39.4%(+8.20)#77 | 38.2%(+9.40)#1,898 |
| 77. | Browns Mills | 47.6% | 39.4%(+8.20)#78 | 38.2%(+9.40)#1,901 |
| 78. | Atlantic City | 47.5% | 39.4%(+8.10)#79 | 38.2%(+9.30)#1,915 |
| 79. | Lakehurst Borough | 47.4% | 39.4%(+8.00)#80 | 38.2%(+9.20)#1,946 |
| 80. | Wildwood | 47.1% | 39.4%(+7.70)#81 | 38.2%(+8.90)#2,009 |
| 81. | Rutherford Borough | 47.0% | 39.4%(+7.60)#82 | 38.2%(+8.80)#2,014 |
| 82. | Turnersville | 46.9% | 39.4%(+7.50)#83 | 38.2%(+8.70)#2,032 |
| 83. | Bradley Gardens | 46.7% | 39.4%(+7.30)#84 | 38.2%(+8.50)#2,060 |
| 84. | Hillsborough | 46.5% | 39.4%(+7.10)#85 | 38.2%(+8.30)#2,092 |
| 85. | Wenonah Borough | 46.5% | 39.4%(+7.10)#86 | 38.2%(+8.30)#2,104 |
| 86. | Vineland | 46.2% | 39.4%(+6.80)#87 | 38.2%(+8.00)#2,155 |
| 87. | Ridgewood | 45.8% | 39.4%(+6.40)#88 | 38.2%(+7.60)#2,190 |
| 88. | Watsessing | 45.8% | 39.4%(+6.40)#89 | 38.2%(+7.60)#2,197 |
| 89. | Magnolia Borough | 45.5% | 39.4%(+6.10)#90 | 38.2%(+7.30)#2,250 |
| 90. | Echelon | 45.4% | 39.4%(+6.00)#91 | 38.2%(+7.20)#2,269 |
| 91. | Englewood | 45.3% | 39.4%(+5.90)#92 | 38.2%(+7.10)#2,283 |
| 92. | Highland Park Borough | 45.1% | 39.4%(+5.70)#93 | 38.2%(+6.90)#2,318 |
| 93. | Morristown | 44.3% | 39.4%(+4.90)#94 | 38.2%(+6.10)#2,440 |
| 94. | Somers Point | 44.1% | 39.4%(+4.70)#95 | 38.2%(+5.90)#2,494 |
| 95. | Linwood | 43.9% | 39.4%(+4.50)#96 | 38.2%(+5.70)#2,523 |
| 96. | Lodi Borough | 43.3% | 39.4%(+3.90)#97 | 38.2%(+5.10)#2,631 |
| 97. | Roselle Borough | 43.3% | 39.4%(+3.90)#98 | 38.2%(+5.10)#2,634 |
| 98. | Old Tappan Borough | 43.3% | 39.4%(+3.90)#99 | 38.2%(+5.10)#2,640 |
| 99. | Six Mile Run | 43.2% | 39.4%(+3.80)#100 | 38.2%(+5.00)#2,666 |
| 100. | Summit | 43.0% | 39.4%(+3.60)#101 | 38.2%(+4.80)#2,683 |
Common Questions
What are the Top 10 Cities with the Highest Percentage of Population Taking Taxi / Cab to Work in New Jersey?
Top 10 Cities with the Highest Percentage of Population Taking Taxi / Cab to Work in New Jersey are:
#1
85.2%
#2
71.3%
#3
66.0%
#4
61.6%
#5
59.4%
#6
58.9%
#7
58.3%
#8
58.2%
#9
57.3%
#10
56.4%
What city has the Highest Percentage of Population Taking Taxi / Cab to Work in New Jersey?
McGuire AFB has the Highest Percentage of Population Taking Taxi / Cab to Work in New Jersey with 85.2%.
What is the Percentage of Population Taking Taxi / Cab to Work in the State of New Jersey?
Percentage of Population Taking Taxi / Cab to Work in New Jersey is 39.4%.
What is the Percentage of Population Taking Taxi / Cab to Work in the United States?
Percentage of Population Taking Taxi / Cab to Work in the United States is 38.2%.