Cities with the Most Immigrants from Jamaica in New Jersey
RELATED REPORTS & OPTIONS
Jamaica
New Jersey
Compare Cities
Map of Cities with the Most Immigrants from Jamaica in New Jersey
0
5,000
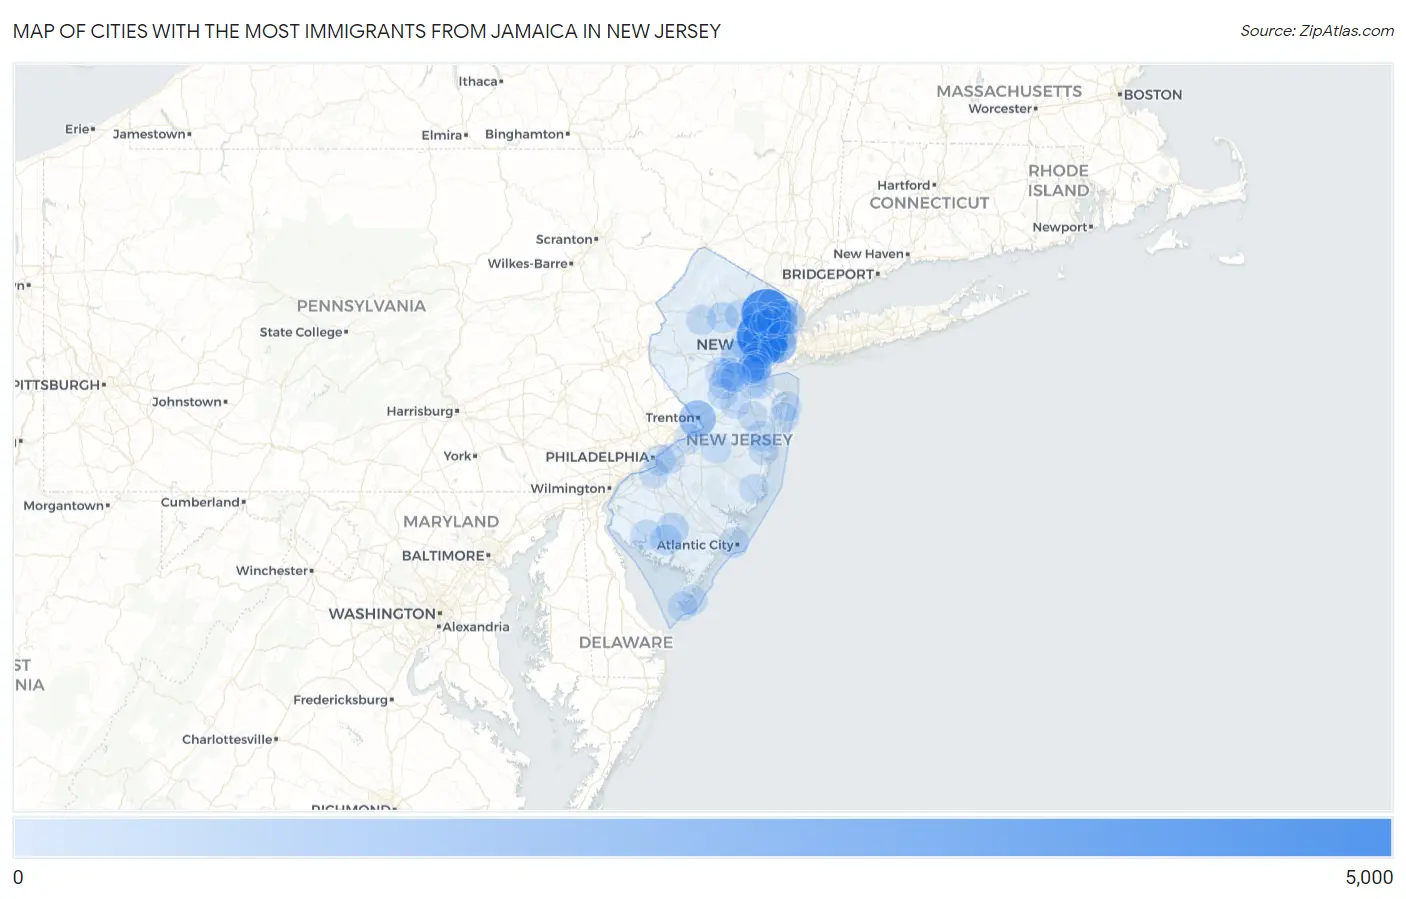
Cities with the Most Immigrants from Jamaica in New Jersey
| City | Jamaica | vs State | vs National | |
| 1. | Paterson | 4,151 | 47,365(8.76%)#1 | 785,998(0.53%)#20 |
| 2. | East Orange | 4,057 | 47,365(8.57%)#2 | 785,998(0.52%)#23 |
| 3. | Newark | 3,300 | 47,365(6.97%)#3 | 785,998(0.42%)#27 |
| 4. | Jersey City | 1,736 | 47,365(3.67%)#4 | 785,998(0.22%)#51 |
| 5. | Trenton | 1,424 | 47,365(3.01%)#5 | 785,998(0.18%)#63 |
| 6. | Hackensack | 1,136 | 47,365(2.40%)#6 | 785,998(0.14%)#76 |
| 7. | Plainfield | 839 | 47,365(1.77%)#7 | 785,998(0.11%)#102 |
| 8. | Englewood | 721 | 47,365(1.52%)#8 | 785,998(0.09%)#121 |
| 9. | Elizabeth | 685 | 47,365(1.45%)#9 | 785,998(0.09%)#126 |
| 10. | North Plainfield Borough | 525 | 47,365(1.11%)#10 | 785,998(0.07%)#173 |
| 11. | Vineland | 505 | 47,365(1.07%)#11 | 785,998(0.06%)#178 |
| 12. | Somerset | 502 | 47,365(1.06%)#12 | 785,998(0.06%)#181 |
| 13. | Lodi Borough | 370 | 47,365(0.78%)#13 | 785,998(0.05%)#245 |
| 14. | Elmwood Park Borough | 358 | 47,365(0.76%)#14 | 785,998(0.05%)#253 |
| 15. | Roselle Borough | 331 | 47,365(0.70%)#15 | 785,998(0.04%)#264 |
| 16. | Fair Lawn Borough | 294 | 47,365(0.62%)#16 | 785,998(0.04%)#289 |
| 17. | Millville | 275 | 47,365(0.58%)#17 | 785,998(0.03%)#303 |
| 18. | Bogota Borough | 253 | 47,365(0.53%)#18 | 785,998(0.03%)#317 |
| 19. | Dover | 245 | 47,365(0.52%)#19 | 785,998(0.03%)#327 |
| 20. | Garfield | 238 | 47,365(0.50%)#20 | 785,998(0.03%)#333 |
| 21. | Camden | 236 | 47,365(0.50%)#21 | 785,998(0.03%)#334 |
| 22. | Lindenwold Borough | 236 | 47,365(0.50%)#22 | 785,998(0.03%)#335 |
| 23. | Sayreville Borough | 233 | 47,365(0.49%)#23 | 785,998(0.03%)#340 |
| 24. | Silver Lake Cdp Essex County | 230 | 47,365(0.49%)#24 | 785,998(0.03%)#346 |
| 25. | Bergenfield Borough | 217 | 47,365(0.46%)#25 | 785,998(0.03%)#360 |
| 26. | Bridgeton | 195 | 47,365(0.41%)#26 | 785,998(0.02%)#399 |
| 27. | Watsessing | 190 | 47,365(0.40%)#27 | 785,998(0.02%)#411 |
| 28. | Perth Amboy | 176 | 47,365(0.37%)#28 | 785,998(0.02%)#436 |
| 29. | Boonton | 173 | 47,365(0.37%)#29 | 785,998(0.02%)#446 |
| 30. | Ridgefield Park | 164 | 47,365(0.35%)#30 | 785,998(0.02%)#473 |
| 31. | Hasbrouck Heights Borough | 163 | 47,365(0.34%)#31 | 785,998(0.02%)#475 |
| 32. | Sicklerville | 158 | 47,365(0.33%)#32 | 785,998(0.02%)#485 |
| 33. | New Providence Borough | 154 | 47,365(0.33%)#33 | 785,998(0.02%)#501 |
| 34. | Budd Lake | 153 | 47,365(0.32%)#34 | 785,998(0.02%)#502 |
| 35. | Clifton | 152 | 47,365(0.32%)#35 | 785,998(0.02%)#505 |
| 36. | Neptune City Borough | 150 | 47,365(0.32%)#36 | 785,998(0.02%)#516 |
| 37. | Atlantic City | 148 | 47,365(0.31%)#37 | 785,998(0.02%)#518 |
| 38. | Brookdale | 140 | 47,365(0.30%)#38 | 785,998(0.02%)#542 |
| 39. | Rahway | 139 | 47,365(0.29%)#39 | 785,998(0.02%)#546 |
| 40. | Fairview Borough | 139 | 47,365(0.29%)#40 | 785,998(0.02%)#550 |
| 41. | Franklin Park | 128 | 47,365(0.27%)#41 | 785,998(0.02%)#585 |
| 42. | River Edge Borough | 126 | 47,365(0.27%)#42 | 785,998(0.02%)#596 |
| 43. | Tinton Falls Borough | 124 | 47,365(0.26%)#43 | 785,998(0.02%)#606 |
| 44. | North Caldwell Borough | 123 | 47,365(0.26%)#44 | 785,998(0.02%)#611 |
| 45. | Wildwood | 115 | 47,365(0.24%)#45 | 785,998(0.01%)#646 |
| 46. | Landing | 114 | 47,365(0.24%)#46 | 785,998(0.01%)#653 |
| 47. | Lakewood | 108 | 47,365(0.23%)#47 | 785,998(0.01%)#675 |
| 48. | Avenel | 108 | 47,365(0.23%)#48 | 785,998(0.01%)#677 |
| 49. | Toms River | 107 | 47,365(0.23%)#49 | 785,998(0.01%)#683 |
| 50. | Linden | 105 | 47,365(0.22%)#50 | 785,998(0.01%)#696 |
| 51. | Dunellen Borough | 105 | 47,365(0.22%)#51 | 785,998(0.01%)#699 |
| 52. | Bayonne | 103 | 47,365(0.22%)#52 | 785,998(0.01%)#710 |
| 53. | Totowa Borough | 101 | 47,365(0.21%)#53 | 785,998(0.01%)#720 |
| 54. | Madison Park | 99 | 47,365(0.21%)#54 | 785,998(0.01%)#732 |
| 55. | South Plainfield Borough | 98 | 47,365(0.21%)#55 | 785,998(0.01%)#737 |
| 56. | Fort Lee Borough | 97 | 47,365(0.20%)#56 | 785,998(0.01%)#741 |
| 57. | Monmouth Junction | 86 | 47,365(0.18%)#57 | 785,998(0.01%)#808 |
| 58. | Carteret Borough | 83 | 47,365(0.18%)#58 | 785,998(0.01%)#827 |
| 59. | Maywood Borough | 83 | 47,365(0.18%)#59 | 785,998(0.01%)#833 |
| 60. | Weston | 82 | 47,365(0.17%)#60 | 785,998(0.01%)#837 |
| 61. | Hawthorne Borough | 80 | 47,365(0.17%)#61 | 785,998(0.01%)#846 |
| 62. | Woodbridge | 79 | 47,365(0.17%)#62 | 785,998(0.01%)#854 |
| 63. | Red Bank Borough | 79 | 47,365(0.17%)#63 | 785,998(0.01%)#855 |
| 64. | Passaic | 75 | 47,365(0.16%)#64 | 785,998(0.01%)#871 |
| 65. | Summit | 75 | 47,365(0.16%)#65 | 785,998(0.01%)#874 |
| 66. | Burlington | 75 | 47,365(0.16%)#66 | 785,998(0.01%)#875 |
| 67. | Cliffwood Beach | 73 | 47,365(0.15%)#67 | 785,998(0.01%)#899 |
| 68. | Metuchen Borough | 71 | 47,365(0.15%)#68 | 785,998(0.01%)#922 |
| 69. | Fort Dix | 71 | 47,365(0.15%)#69 | 785,998(0.01%)#924 |
| 70. | New Milford Borough | 69 | 47,365(0.15%)#70 | 785,998(0.01%)#937 |
| 71. | Ringwood Borough | 68 | 47,365(0.14%)#71 | 785,998(0.01%)#954 |
| 72. | Somerville Borough | 67 | 47,365(0.14%)#72 | 785,998(0.01%)#963 |
| 73. | Concordia | 65 | 47,365(0.14%)#73 | 785,998(0.01%)#989 |
| 74. | Flanders | 64 | 47,365(0.14%)#74 | 785,998(0.01%)#995 |
| 75. | Singac | 64 | 47,365(0.14%)#75 | 785,998(0.01%)#997 |
| 76. | Long Branch | 63 | 47,365(0.13%)#76 | 785,998(0.01%)#1,005 |
| 77. | Middlesex Borough | 63 | 47,365(0.13%)#77 | 785,998(0.01%)#1,008 |
| 78. | West Freehold | 61 | 47,365(0.13%)#78 | 785,998(0.01%)#1,028 |
| 79. | Asbury Park | 60 | 47,365(0.13%)#79 | 785,998(0.01%)#1,040 |
| 80. | Woodcliff Lake Borough | 60 | 47,365(0.13%)#80 | 785,998(0.01%)#1,043 |
| 81. | Ridgewood | 59 | 47,365(0.12%)#81 | 785,998(0.01%)#1,046 |
| 82. | Palmyra Borough | 59 | 47,365(0.12%)#82 | 785,998(0.01%)#1,053 |
| 83. | Port Reading | 59 | 47,365(0.12%)#83 | 785,998(0.01%)#1,054 |
| 84. | Cherry Hill Mall | 58 | 47,365(0.12%)#84 | 785,998(0.01%)#1,061 |
| 85. | Union City | 57 | 47,365(0.12%)#85 | 785,998(0.01%)#1,069 |
| 86. | South Bound Brook Borough | 52 | 47,365(0.11%)#86 | 785,998(0.01%)#1,143 |
| 87. | Fords | 49 | 47,365(0.10%)#87 | 785,998(0.01%)#1,180 |
| 88. | Haledon Borough | 47 | 47,365(0.10%)#88 | 785,998(0.01%)#1,211 |
| 89. | Fanwood Borough | 47 | 47,365(0.10%)#89 | 785,998(0.01%)#1,212 |
| 90. | East Franklin | 46 | 47,365(0.10%)#90 | 785,998(0.01%)#1,225 |
| 91. | Hillsdale Borough | 45 | 47,365(0.10%)#91 | 785,998(0.01%)#1,235 |
| 92. | Pine Hill Borough | 43 | 47,365(0.09%)#92 | 785,998(0.01%)#1,269 |
| 93. | Sewaren | 43 | 47,365(0.09%)#93 | 785,998(0.01%)#1,273 |
| 94. | New Brunswick | 42 | 47,365(0.09%)#94 | 785,998(0.01%)#1,281 |
| 95. | Glassboro Borough | 41 | 47,365(0.09%)#95 | 785,998(0.01%)#1,296 |
| 96. | Woodbury | 41 | 47,365(0.09%)#96 | 785,998(0.01%)#1,304 |
| 97. | Paramus Borough | 40 | 47,365(0.08%)#97 | 785,998(0.01%)#1,313 |
| 98. | Netcong Borough | 39 | 47,365(0.08%)#98 | 785,998(0.00%)#1,342 |
| 99. | Cape May | 38 | 47,365(0.08%)#99 | 785,998(0.00%)#1,358 |
| 100. | Ocean Acres | 37 | 47,365(0.08%)#100 | 785,998(0.00%)#1,368 |
Common Questions
What are the Top 10 Cities with the Most Immigrants from Jamaica in New Jersey?
Top 10 Cities with the Most Immigrants from Jamaica in New Jersey are:
#1
4,151
#2
4,057
#3
3,300
#4
1,736
#5
1,424
#6
1,136
#7
839
#8
721
#9
685
#10
505
What city has the Most Immigrants from Jamaica in New Jersey?
Paterson has the Most Immigrants from Jamaica in New Jersey with 4,151.
What is the Total Immigrants from Jamaica in the State of New Jersey?
Total Immigrants from Jamaica in New Jersey is 47,365.
What is the Total Immigrants from Jamaica in the United States?
Total Immigrants from Jamaica in the United States is 785,998.