Cities with the Most Immigrants from Belgium in New Jersey
RELATED REPORTS & OPTIONS
Belgium
New Jersey
Compare Cities
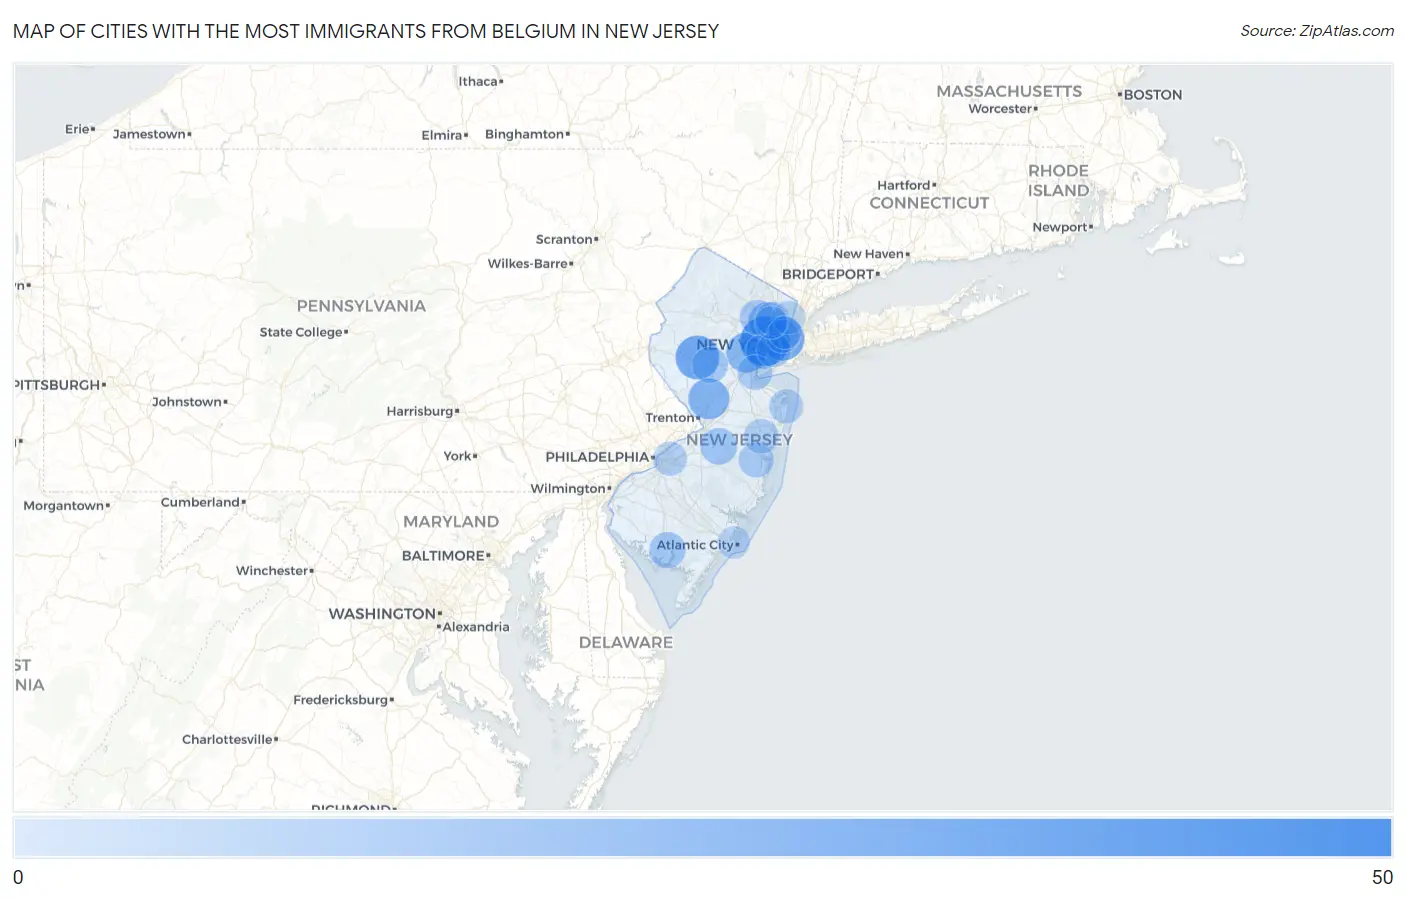
Map of Cities with the Most Immigrants from Belgium in New Jersey
0
50
Cities with the Most Immigrants from Belgium in New Jersey
| City | Belgium | vs State | vs National | |
| 1. | Newark | 49 | 1,090(4.50%)#1 | 34,732(0.14%)#106 |
| 2. | Lodi Borough | 43 | 1,090(3.94%)#2 | 34,732(0.12%)#126 |
| 3. | Hoboken | 34 | 1,090(3.12%)#3 | 34,732(0.10%)#171 |
| 4. | White House Station | 34 | 1,090(3.12%)#4 | 34,732(0.10%)#175 |
| 5. | Princeton | 27 | 1,090(2.48%)#5 | 34,732(0.08%)#224 |
| 6. | Westfield | 25 | 1,090(2.29%)#6 | 34,732(0.07%)#238 |
| 7. | Highlands Borough | 25 | 1,090(2.29%)#7 | 34,732(0.07%)#241 |
| 8. | Clifton | 20 | 1,090(1.83%)#8 | 34,732(0.06%)#303 |
| 9. | Englewood Cliffs Borough | 19 | 1,090(1.74%)#9 | 34,732(0.05%)#335 |
| 10. | Fair Lawn Borough | 18 | 1,090(1.65%)#10 | 34,732(0.05%)#349 |
| 11. | Mcguire Afb | 16 | 1,090(1.47%)#11 | 34,732(0.05%)#401 |
| 12. | Laurel Lake | 15 | 1,090(1.38%)#12 | 34,732(0.04%)#443 |
| 13. | Mauricetown | 15 | 1,090(1.38%)#13 | 34,732(0.04%)#445 |
| 14. | Bradley Gardens | 14 | 1,090(1.28%)#14 | 34,732(0.04%)#468 |
| 15. | Elizabeth | 13 | 1,090(1.19%)#15 | 34,732(0.04%)#482 |
| 16. | Basking Ridge | 13 | 1,090(1.19%)#16 | 34,732(0.04%)#500 |
| 17. | Singac | 13 | 1,090(1.19%)#17 | 34,732(0.04%)#504 |
| 18. | Perth Amboy | 12 | 1,090(1.10%)#18 | 34,732(0.03%)#524 |
| 19. | Leonia Borough | 12 | 1,090(1.10%)#19 | 34,732(0.03%)#538 |
| 20. | Holiday Heights | 12 | 1,090(1.10%)#20 | 34,732(0.03%)#547 |
| 21. | Lakewood | 11 | 1,090(1.01%)#21 | 34,732(0.03%)#556 |
| 22. | Ocean View | 11 | 1,090(1.01%)#22 | 34,732(0.03%)#583 |
| 23. | Bayonne | 10 | 1,090(0.92%)#23 | 34,732(0.03%)#596 |
| 24. | Long Branch | 10 | 1,090(0.92%)#24 | 34,732(0.03%)#602 |
| 25. | Cherry Hill Mall | 10 | 1,090(0.92%)#25 | 34,732(0.03%)#613 |
| 26. | Garfield | 9 | 1,090(0.83%)#26 | 34,732(0.03%)#665 |
| 27. | Allendale Borough | 9 | 1,090(0.83%)#27 | 34,732(0.03%)#684 |
| 28. | Union City | 8 | 1,090(0.73%)#28 | 34,732(0.02%)#698 |
| 29. | Englewood | 8 | 1,090(0.73%)#29 | 34,732(0.02%)#713 |
| 30. | Bridgewater Center | 8 | 1,090(0.73%)#30 | 34,732(0.02%)#735 |
| 31. | Seaside Park Borough | 8 | 1,090(0.73%)#31 | 34,732(0.02%)#743 |
| 32. | West New York | 7 | 1,090(0.64%)#32 | 34,732(0.02%)#766 |
| 33. | Passaic | 6 | 1,090(0.55%)#33 | 34,732(0.02%)#802 |
| 34. | Atlantic City | 6 | 1,090(0.55%)#34 | 34,732(0.02%)#814 |
| 35. | Hillsborough | 6 | 1,090(0.55%)#35 | 34,732(0.02%)#820 |
| 36. | Sea Girt Borough | 5 | 1,090(0.46%)#36 | 34,732(0.01%)#866 |
| 37. | Riverton Borough | 4 | 1,090(0.37%)#37 | 34,732(0.01%)#886 |
| 38. | Rocky Hill Borough | 2 | 1,090(0.18%)#38 | 34,732(0.01%)#951 |
Common Questions
What are the Top 10 Cities with the Most Immigrants from Belgium in New Jersey?
Top 10 Cities with the Most Immigrants from Belgium in New Jersey are:
#1
49
#2
34
#3
34
#4
27
#5
25
#6
20
#7
16
#8
15
#9
14
#10
13
What city has the Most Immigrants from Belgium in New Jersey?
Newark has the Most Immigrants from Belgium in New Jersey with 49.
What is the Total Immigrants from Belgium in the State of New Jersey?
Total Immigrants from Belgium in New Jersey is 1,090.
What is the Total Immigrants from Belgium in the United States?
Total Immigrants from Belgium in the United States is 34,732.