Cities with the Most Immigrants from Costa Rica in New Jersey
RELATED REPORTS & OPTIONS
Costa Rica
New Jersey
Compare Cities
Map of Cities with the Most Immigrants from Costa Rica in New Jersey
0
1,000
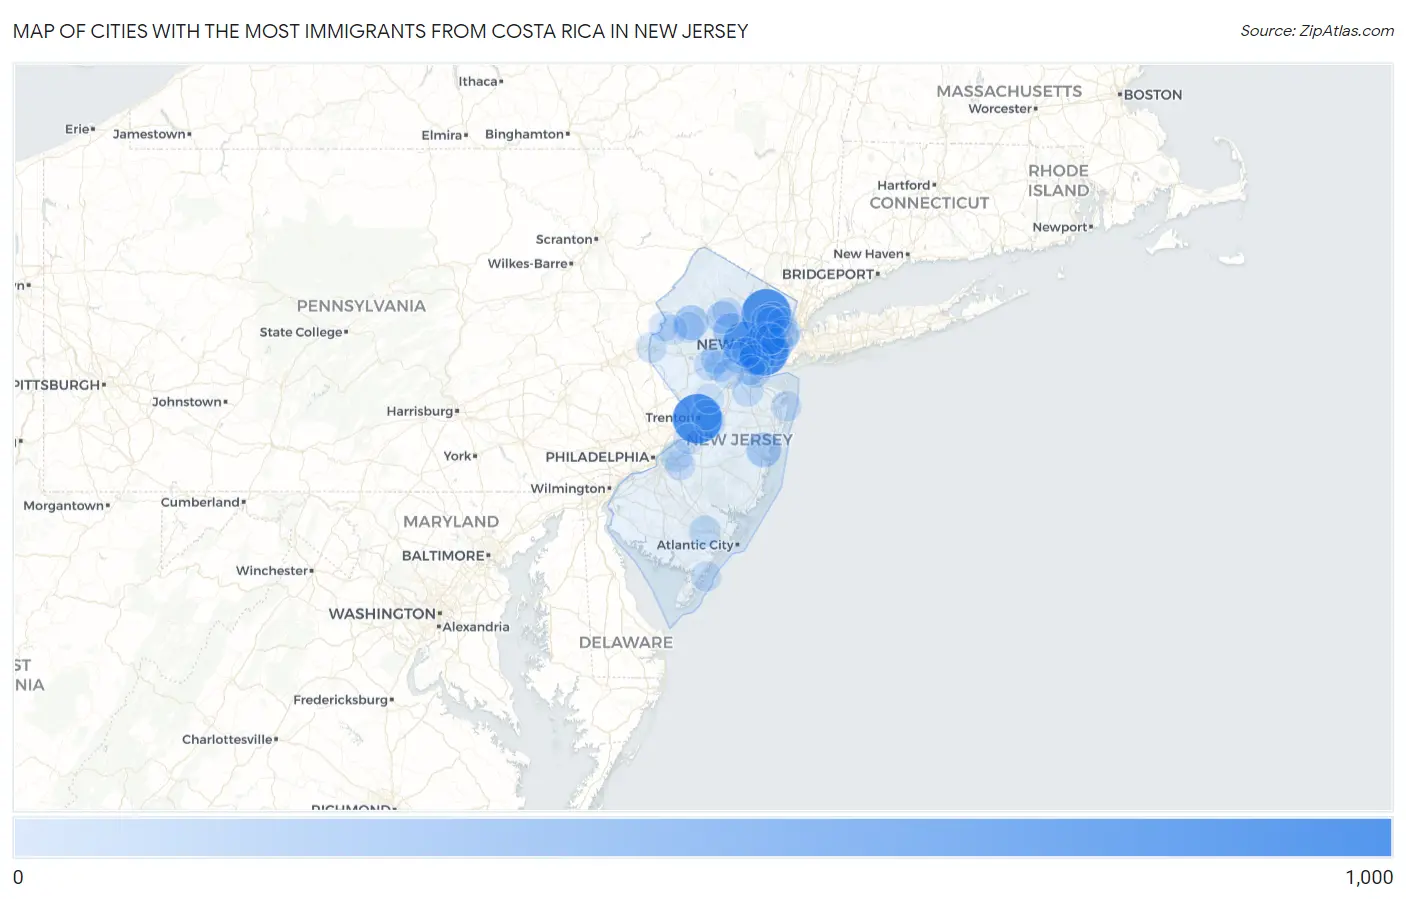
Cities with the Most Immigrants from Costa Rica in New Jersey
| City | Costa Rica | vs State | vs National | |
| 1. | Trenton | 848 | 14,848(5.71%)#1 | 95,844(0.88%)#5 |
| 2. | Paterson | 840 | 14,848(5.66%)#2 | 95,844(0.88%)#6 |
| 3. | Elizabeth | 822 | 14,848(5.54%)#3 | 95,844(0.86%)#7 |
| 4. | Bound Brook Borough | 754 | 14,848(5.08%)#4 | 95,844(0.79%)#9 |
| 5. | Summit | 616 | 14,848(4.15%)#5 | 95,844(0.64%)#12 |
| 6. | Newark | 349 | 14,848(2.35%)#6 | 95,844(0.36%)#29 |
| 7. | Morristown | 263 | 14,848(1.77%)#7 | 95,844(0.27%)#39 |
| 8. | Linden | 254 | 14,848(1.71%)#8 | 95,844(0.27%)#40 |
| 9. | Raritan Borough | 241 | 14,848(1.62%)#9 | 95,844(0.25%)#46 |
| 10. | North Plainfield Borough | 224 | 14,848(1.51%)#10 | 95,844(0.23%)#53 |
| 11. | Toms River | 209 | 14,848(1.41%)#11 | 95,844(0.22%)#58 |
| 12. | Hillsborough | 203 | 14,848(1.37%)#12 | 95,844(0.21%)#60 |
| 13. | Hackettstown | 201 | 14,848(1.35%)#13 | 95,844(0.21%)#62 |
| 14. | Belmar Borough | 160 | 14,848(1.08%)#14 | 95,844(0.17%)#87 |
| 15. | Somerville Borough | 154 | 14,848(1.04%)#15 | 95,844(0.16%)#92 |
| 16. | Garfield | 146 | 14,848(0.98%)#16 | 95,844(0.15%)#98 |
| 17. | Manville Borough | 141 | 14,848(0.95%)#17 | 95,844(0.15%)#105 |
| 18. | Union City | 139 | 14,848(0.94%)#18 | 95,844(0.15%)#107 |
| 19. | Sayreville Borough | 123 | 14,848(0.83%)#19 | 95,844(0.13%)#123 |
| 20. | Lyons | 122 | 14,848(0.82%)#20 | 95,844(0.13%)#126 |
| 21. | Dover | 121 | 14,848(0.81%)#21 | 95,844(0.13%)#128 |
| 22. | Clifton | 120 | 14,848(0.81%)#22 | 95,844(0.13%)#129 |
| 23. | Bayonne | 119 | 14,848(0.80%)#23 | 95,844(0.12%)#132 |
| 24. | Millstone Borough | 117 | 14,848(0.79%)#24 | 95,844(0.12%)#134 |
| 25. | Harrison | 115 | 14,848(0.77%)#25 | 95,844(0.12%)#137 |
| 26. | South Bound Brook Borough | 110 | 14,848(0.74%)#26 | 95,844(0.11%)#147 |
| 27. | New Providence Borough | 104 | 14,848(0.70%)#27 | 95,844(0.11%)#161 |
| 28. | Madison Borough | 94 | 14,848(0.63%)#28 | 95,844(0.10%)#180 |
| 29. | Caldwell Borough | 94 | 14,848(0.63%)#29 | 95,844(0.10%)#182 |
| 30. | Stirling | 94 | 14,848(0.63%)#30 | 95,844(0.10%)#183 |
| 31. | Jersey City | 93 | 14,848(0.63%)#31 | 95,844(0.10%)#184 |
| 32. | Prospect Park Borough | 89 | 14,848(0.60%)#32 | 95,844(0.09%)#196 |
| 33. | Midland Park Borough | 88 | 14,848(0.59%)#33 | 95,844(0.09%)#200 |
| 34. | Paramus Borough | 85 | 14,848(0.57%)#34 | 95,844(0.09%)#211 |
| 35. | Mays Landing | 75 | 14,848(0.51%)#35 | 95,844(0.08%)#250 |
| 36. | Elmwood Park Borough | 74 | 14,848(0.50%)#36 | 95,844(0.08%)#254 |
| 37. | Bradley Gardens | 74 | 14,848(0.50%)#37 | 95,844(0.08%)#255 |
| 38. | Bergenfield Borough | 68 | 14,848(0.46%)#38 | 95,844(0.07%)#281 |
| 39. | Roselle Borough | 67 | 14,848(0.45%)#39 | 95,844(0.07%)#286 |
| 40. | Palisades Park Borough | 67 | 14,848(0.45%)#40 | 95,844(0.07%)#287 |
| 41. | Yardville | 62 | 14,848(0.42%)#41 | 95,844(0.06%)#309 |
| 42. | Finderne | 61 | 14,848(0.41%)#42 | 95,844(0.06%)#318 |
| 43. | West New York | 60 | 14,848(0.40%)#43 | 95,844(0.06%)#322 |
| 44. | Moorestown Lenola | 60 | 14,848(0.40%)#44 | 95,844(0.06%)#324 |
| 45. | Allendale Borough | 60 | 14,848(0.40%)#45 | 95,844(0.06%)#325 |
| 46. | Green Knoll | 60 | 14,848(0.40%)#46 | 95,844(0.06%)#327 |
| 47. | Plainfield | 59 | 14,848(0.40%)#47 | 95,844(0.06%)#332 |
| 48. | Point Pleasant Borough | 59 | 14,848(0.40%)#48 | 95,844(0.06%)#335 |
| 49. | Old Bridge | 56 | 14,848(0.38%)#49 | 95,844(0.06%)#345 |
| 50. | Flemington Borough | 51 | 14,848(0.34%)#50 | 95,844(0.05%)#373 |
| 51. | Middlesex Borough | 49 | 14,848(0.33%)#51 | 95,844(0.05%)#386 |
| 52. | Wallington Borough | 49 | 14,848(0.33%)#52 | 95,844(0.05%)#387 |
| 53. | Rahway | 48 | 14,848(0.32%)#53 | 95,844(0.05%)#395 |
| 54. | Perth Amboy | 47 | 14,848(0.32%)#54 | 95,844(0.05%)#401 |
| 55. | Lodi Borough | 46 | 14,848(0.31%)#55 | 95,844(0.05%)#412 |
| 56. | Florham Park Borough | 45 | 14,848(0.30%)#56 | 95,844(0.05%)#424 |
| 57. | Beattystown | 45 | 14,848(0.30%)#57 | 95,844(0.05%)#426 |
| 58. | Passaic | 43 | 14,848(0.29%)#58 | 95,844(0.04%)#435 |
| 59. | Rutherford Borough | 41 | 14,848(0.28%)#59 | 95,844(0.04%)#464 |
| 60. | Mercerville | 41 | 14,848(0.28%)#60 | 95,844(0.04%)#466 |
| 61. | Phillipsburg | 40 | 14,848(0.27%)#61 | 95,844(0.04%)#476 |
| 62. | Netcong Borough | 39 | 14,848(0.26%)#62 | 95,844(0.04%)#486 |
| 63. | Kearny | 35 | 14,848(0.24%)#63 | 95,844(0.04%)#522 |
| 64. | Parsippany | 33 | 14,848(0.22%)#64 | 95,844(0.03%)#552 |
| 65. | Tinton Falls Borough | 33 | 14,848(0.22%)#65 | 95,844(0.03%)#553 |
| 66. | Marlton | 33 | 14,848(0.22%)#66 | 95,844(0.03%)#554 |
| 67. | Burlington | 33 | 14,848(0.22%)#67 | 95,844(0.03%)#555 |
| 68. | Long Branch | 32 | 14,848(0.22%)#68 | 95,844(0.03%)#566 |
| 69. | Westwood Borough | 32 | 14,848(0.22%)#69 | 95,844(0.03%)#574 |
| 70. | Bogota Borough | 32 | 14,848(0.22%)#70 | 95,844(0.03%)#576 |
| 71. | Fords | 31 | 14,848(0.21%)#71 | 95,844(0.03%)#585 |
| 72. | Kenilworth Borough | 30 | 14,848(0.20%)#72 | 95,844(0.03%)#602 |
| 73. | Sea Isle City | 29 | 14,848(0.20%)#73 | 95,844(0.03%)#626 |
| 74. | Victory Gardens Borough | 29 | 14,848(0.20%)#74 | 95,844(0.03%)#627 |
| 75. | Bedminster | 29 | 14,848(0.20%)#75 | 95,844(0.03%)#629 |
| 76. | Lake Como Borough | 28 | 14,848(0.19%)#76 | 95,844(0.03%)#643 |
| 77. | New Vernon | 28 | 14,848(0.19%)#77 | 95,844(0.03%)#644 |
| 78. | Upper Saddle River Borough | 27 | 14,848(0.18%)#78 | 95,844(0.03%)#653 |
| 79. | Union | 27 | 14,848(0.18%)#79 | 95,844(0.03%)#657 |
| 80. | Highland Park Borough | 25 | 14,848(0.17%)#80 | 95,844(0.03%)#684 |
| 81. | Hawthorne Borough | 24 | 14,848(0.16%)#81 | 95,844(0.03%)#701 |
| 82. | Keansburg Borough | 24 | 14,848(0.16%)#82 | 95,844(0.03%)#706 |
| 83. | Fair Lawn Borough | 23 | 14,848(0.15%)#83 | 95,844(0.02%)#722 |
| 84. | Wharton Borough | 23 | 14,848(0.15%)#84 | 95,844(0.02%)#732 |
| 85. | Rockaway Borough | 23 | 14,848(0.15%)#85 | 95,844(0.02%)#733 |
| 86. | Deal Borough | 23 | 14,848(0.15%)#86 | 95,844(0.02%)#734 |
| 87. | Ringwood Borough | 20 | 14,848(0.13%)#87 | 95,844(0.02%)#799 |
| 88. | Oxford | 20 | 14,848(0.13%)#88 | 95,844(0.02%)#806 |
| 89. | Ridgefield Park | 18 | 14,848(0.12%)#89 | 95,844(0.02%)#837 |
| 90. | Freehold Borough | 18 | 14,848(0.12%)#90 | 95,844(0.02%)#838 |
| 91. | Franklin Borough | 18 | 14,848(0.12%)#91 | 95,844(0.02%)#844 |
| 92. | Dunellen Borough | 16 | 14,848(0.11%)#92 | 95,844(0.02%)#897 |
| 93. | Princeton | 15 | 14,848(0.10%)#93 | 95,844(0.02%)#913 |
| 94. | Somerset | 15 | 14,848(0.10%)#94 | 95,844(0.02%)#916 |
| 95. | White Meadow Lake | 15 | 14,848(0.10%)#95 | 95,844(0.02%)#929 |
| 96. | Haledon Borough | 15 | 14,848(0.10%)#96 | 95,844(0.02%)#930 |
| 97. | Belvidere | 15 | 14,848(0.10%)#97 | 95,844(0.02%)#936 |
| 98. | East Vineland | 14 | 14,848(0.09%)#98 | 95,844(0.01%)#972 |
| 99. | Butler Borough | 13 | 14,848(0.09%)#99 | 95,844(0.01%)#1,002 |
| 100. | Westfield | 12 | 14,848(0.08%)#100 | 95,844(0.01%)#1,031 |
Common Questions
What are the Top 10 Cities with the Most Immigrants from Costa Rica in New Jersey?
Top 10 Cities with the Most Immigrants from Costa Rica in New Jersey are:
#1
848
#2
840
#3
822
#4
616
#5
349
#6
263
#7
254
#8
209
#9
201
#10
146
What city has the Most Immigrants from Costa Rica in New Jersey?
Trenton has the Most Immigrants from Costa Rica in New Jersey with 848.
What is the Total Immigrants from Costa Rica in the State of New Jersey?
Total Immigrants from Costa Rica in New Jersey is 14,848.
What is the Total Immigrants from Costa Rica in the United States?
Total Immigrants from Costa Rica in the United States is 95,844.