Cities with the Largest South American Indian Community in New Jersey
RELATED REPORTS & OPTIONS
South American Indian
New Jersey
Compare Cities
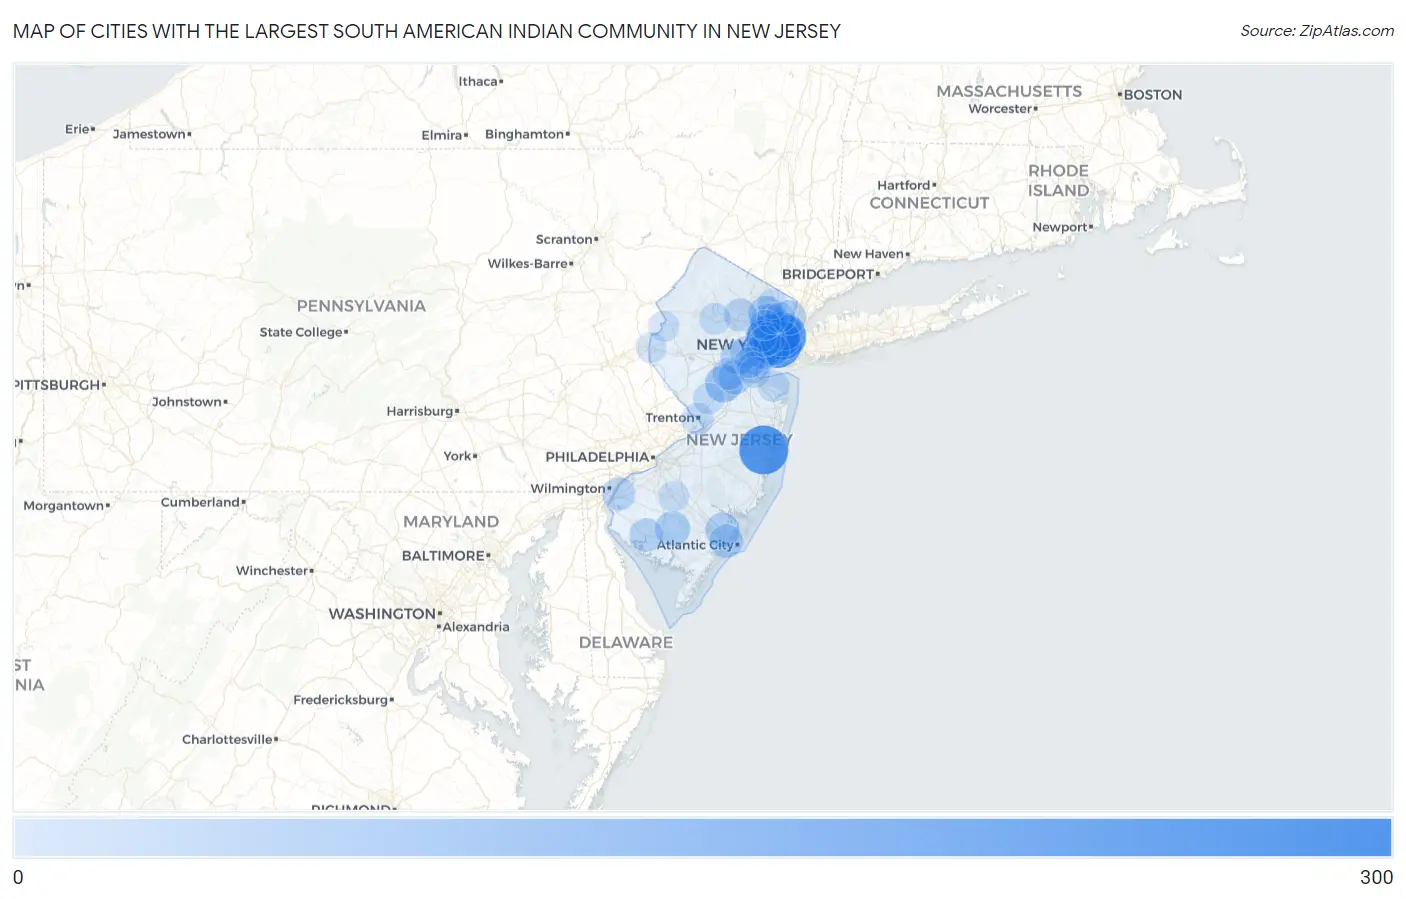
Map of Cities with the Largest South American Indian Community in New Jersey
0
300
Cities with the Largest South American Indian Community in New Jersey
| City | South American Indian | vs State | vs National | |
| 1. | Kearny | 251 | 4,785(5.25%)#1 | 61,478(0.41%)#23 |
| 2. | Toms River | 243 | 4,785(5.08%)#2 | 61,478(0.40%)#25 |
| 3. | Jersey City | 236 | 4,785(4.93%)#3 | 61,478(0.38%)#28 |
| 4. | Union City | 220 | 4,785(4.60%)#4 | 61,478(0.36%)#34 |
| 5. | Prospect Park Borough | 186 | 4,785(3.89%)#5 | 61,478(0.30%)#46 |
| 6. | Cliffside Park Borough | 148 | 4,785(3.09%)#6 | 61,478(0.24%)#67 |
| 7. | North Plainfield Borough | 124 | 4,785(2.59%)#7 | 61,478(0.20%)#82 |
| 8. | Little Ferry Borough | 110 | 4,785(2.30%)#8 | 61,478(0.18%)#95 |
| 9. | Franklin Park | 88 | 4,785(1.84%)#9 | 61,478(0.14%)#128 |
| 10. | Linden | 75 | 4,785(1.57%)#10 | 61,478(0.12%)#153 |
| 11. | New Milford Borough | 73 | 4,785(1.53%)#11 | 61,478(0.12%)#161 |
| 12. | Paterson | 71 | 4,785(1.48%)#12 | 61,478(0.12%)#166 |
| 13. | Elizabeth | 71 | 4,785(1.48%)#13 | 61,478(0.12%)#167 |
| 14. | Haledon Borough | 71 | 4,785(1.48%)#14 | 61,478(0.12%)#171 |
| 15. | West New York | 68 | 4,785(1.42%)#15 | 61,478(0.11%)#179 |
| 16. | Hoboken | 65 | 4,785(1.36%)#16 | 61,478(0.11%)#192 |
| 17. | Clifton | 63 | 4,785(1.32%)#17 | 61,478(0.10%)#196 |
| 18. | Vineland | 61 | 4,785(1.27%)#18 | 61,478(0.10%)#203 |
| 19. | South Bound Brook Borough | 60 | 4,785(1.25%)#19 | 61,478(0.10%)#213 |
| 20. | Englewood | 58 | 4,785(1.21%)#20 | 61,478(0.09%)#221 |
| 21. | Pomona | 56 | 4,785(1.17%)#21 | 61,478(0.09%)#233 |
| 22. | New Brunswick | 51 | 4,785(1.07%)#22 | 61,478(0.08%)#258 |
| 23. | Bergenfield Borough | 50 | 4,785(1.04%)#23 | 61,478(0.08%)#268 |
| 24. | Plainfield | 49 | 4,785(1.02%)#24 | 61,478(0.08%)#276 |
| 25. | Elmwood Park Borough | 48 | 4,785(1.00%)#25 | 61,478(0.08%)#282 |
| 26. | Leonia Borough | 48 | 4,785(1.00%)#26 | 61,478(0.08%)#284 |
| 27. | Pleasantville | 46 | 4,785(0.96%)#27 | 61,478(0.07%)#301 |
| 28. | Bridgeton | 44 | 4,785(0.92%)#28 | 61,478(0.07%)#315 |
| 29. | Harrison | 40 | 4,785(0.84%)#29 | 61,478(0.07%)#350 |
| 30. | Carneys Point | 40 | 4,785(0.84%)#30 | 61,478(0.07%)#352 |
| 31. | Boonton | 35 | 4,785(0.73%)#31 | 61,478(0.06%)#378 |
| 32. | Brielle Borough | 35 | 4,785(0.73%)#32 | 61,478(0.06%)#380 |
| 33. | Glassboro Borough | 33 | 4,785(0.69%)#33 | 61,478(0.05%)#394 |
| 34. | Fort Lee Borough | 32 | 4,785(0.67%)#34 | 61,478(0.05%)#405 |
| 35. | Hawthorne Borough | 29 | 4,785(0.61%)#35 | 61,478(0.05%)#431 |
| 36. | Somerset | 28 | 4,785(0.59%)#36 | 61,478(0.05%)#440 |
| 37. | Harrington Park Borough | 28 | 4,785(0.59%)#37 | 61,478(0.05%)#443 |
| 38. | Westfield | 27 | 4,785(0.56%)#38 | 61,478(0.04%)#450 |
| 39. | Somerville Borough | 27 | 4,785(0.56%)#39 | 61,478(0.04%)#455 |
| 40. | Trenton | 24 | 4,785(0.50%)#40 | 61,478(0.04%)#495 |
| 41. | Parsippany | 24 | 4,785(0.50%)#41 | 61,478(0.04%)#504 |
| 42. | Maywood Borough | 20 | 4,785(0.42%)#42 | 61,478(0.03%)#566 |
| 43. | Kenvil | 20 | 4,785(0.42%)#43 | 61,478(0.03%)#569 |
| 44. | Raritan Borough | 19 | 4,785(0.40%)#44 | 61,478(0.03%)#581 |
| 45. | Sayreville Borough | 18 | 4,785(0.38%)#45 | 61,478(0.03%)#589 |
| 46. | Lodi Borough | 18 | 4,785(0.38%)#46 | 61,478(0.03%)#592 |
| 47. | Princeton | 17 | 4,785(0.36%)#47 | 61,478(0.03%)#611 |
| 48. | Carteret Borough | 17 | 4,785(0.36%)#48 | 61,478(0.03%)#613 |
| 49. | Port Monmouth | 17 | 4,785(0.36%)#49 | 61,478(0.03%)#618 |
| 50. | Bayonne | 16 | 4,785(0.33%)#50 | 61,478(0.03%)#625 |
| 51. | East Orange | 15 | 4,785(0.31%)#51 | 61,478(0.02%)#640 |
| 52. | Woodbridge | 15 | 4,785(0.31%)#52 | 61,478(0.02%)#648 |
| 53. | Madison Borough | 13 | 4,785(0.27%)#53 | 61,478(0.02%)#701 |
| 54. | Upper Saddle River Borough | 13 | 4,785(0.27%)#54 | 61,478(0.02%)#703 |
| 55. | Newark | 12 | 4,785(0.25%)#55 | 61,478(0.02%)#709 |
| 56. | Phillipsburg | 12 | 4,785(0.25%)#56 | 61,478(0.02%)#730 |
| 57. | Williamstown | 12 | 4,785(0.25%)#57 | 61,478(0.02%)#731 |
| 58. | New Providence Borough | 12 | 4,785(0.25%)#58 | 61,478(0.02%)#734 |
| 59. | Vauxhall | 12 | 4,785(0.25%)#59 | 61,478(0.02%)#742 |
| 60. | Perth Amboy | 11 | 4,785(0.23%)#60 | 61,478(0.02%)#756 |
| 61. | Garfield | 11 | 4,785(0.23%)#61 | 61,478(0.02%)#758 |
| 62. | Belvidere | 11 | 4,785(0.23%)#62 | 61,478(0.02%)#773 |
| 63. | Ridgewood | 9 | 4,785(0.19%)#63 | 61,478(0.01%)#835 |
| 64. | Colonia | 9 | 4,785(0.19%)#64 | 61,478(0.01%)#840 |
| 65. | Collingswood Borough | 9 | 4,785(0.19%)#65 | 61,478(0.01%)#841 |
| 66. | Manville Borough | 8 | 4,785(0.17%)#66 | 61,478(0.01%)#874 |
| 67. | South River Borough | 7 | 4,785(0.15%)#67 | 61,478(0.01%)#908 |
| 68. | Roselle Park Borough | 6 | 4,785(0.13%)#68 | 61,478(0.01%)#940 |
| 69. | Hackensack | 4 | 4,785(0.08%)#69 | 61,478(0.01%)#979 |
| 70. | Brookdale | 3 | 4,785(0.06%)#70 | 61,478(0.00%)#1,008 |
| 71. | Metuchen Borough | 2 | 4,785(0.04%)#71 | 61,478(0.00%)#1,030 |
| 72. | Sea Girt Borough | 2 | 4,785(0.04%)#72 | 61,478(0.00%)#1,040 |
| 73. | Allenhurst Borough | 2 | 4,785(0.04%)#73 | 61,478(0.00%)#1,049 |
Common Questions
What are the Top 10 Cities with the Largest South American Indian Community in New Jersey?
Top 10 Cities with the Largest South American Indian Community in New Jersey are:
#1
251
#2
243
#3
236
#4
220
#5
88
#6
75
#7
71
#8
71
#9
68
#10
65
What city has the Largest South American Indian Community in New Jersey?
Kearny has the Largest South American Indian Community in New Jersey with 251.
What is the Total South American Indian Population in the State of New Jersey?
Total South American Indian Population in New Jersey is 4,785.
What is the Total South American Indian Population in the United States?
Total South American Indian Population in the United States is 61,478.