Cities with the Highest Percentage of Hispanic or Latino Population in New Jersey
RELATED REPORTS & OPTIONS
Hispanic or Latino
New Jersey
Compare Cities
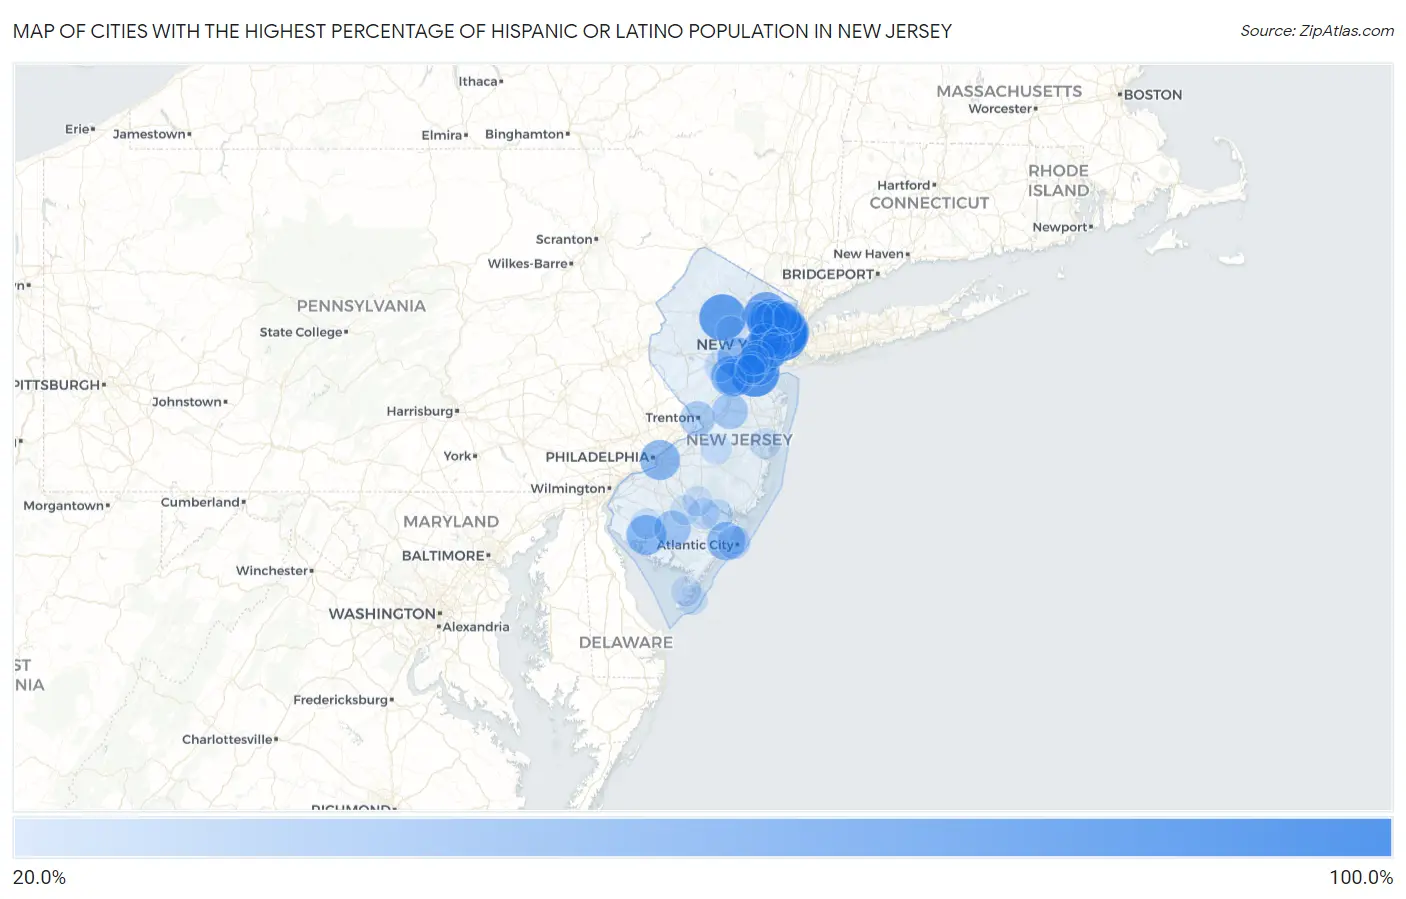
Map of Cities with the Highest Percentage of Hispanic or Latino Population in New Jersey
0.0%
100.0%
Cities with the Highest Percentage of Hispanic or Latino Population in New Jersey
| City | Hispanic or Latino | vs State | vs National | |
| 1. | Union City | 81.3% | 21.2%(+60.1)#1 | 18.7%(+62.7)#976 |
| 2. | Perth Amboy | 78.8% | 21.2%(+57.6)#2 | 18.7%(+60.1)#1,039 |
| 3. | Keasbey | 77.4% | 21.2%(+56.2)#3 | 18.7%(+58.8)#1,073 |
| 4. | West New York | 77.2% | 21.2%(+56.0)#4 | 18.7%(+58.5)#1,080 |
| 5. | Passaic | 74.1% | 21.2%(+52.8)#5 | 18.7%(+55.4)#1,149 |
| 6. | Victory Gardens Borough | 73.9% | 21.2%(+52.7)#6 | 18.7%(+55.3)#1,153 |
| 7. | Dover | 72.0% | 21.2%(+50.8)#7 | 18.7%(+53.4)#1,204 |
| 8. | Guttenberg | 67.3% | 21.2%(+46.1)#8 | 18.7%(+48.6)#1,333 |
| 9. | Heislerville | 66.4% | 21.2%(+45.2)#9 | 18.7%(+47.8)#1,358 |
| 10. | East Newark Borough | 65.8% | 21.2%(+44.6)#10 | 18.7%(+47.2)#1,382 |
| 11. | Elizabeth | 65.6% | 21.2%(+44.3)#11 | 18.7%(+46.9)#1,388 |
| 12. | Teterboro Borough | 63.7% | 21.2%(+42.5)#12 | 18.7%(+45.1)#1,441 |
| 13. | Paterson | 63.1% | 21.2%(+41.8)#13 | 18.7%(+44.4)#1,456 |
| 14. | Moonachie Borough | 61.2% | 21.2%(+40.0)#14 | 18.7%(+42.6)#1,518 |
| 15. | Prospect Park Borough | 56.0% | 21.2%(+34.8)#15 | 18.7%(+37.3)#1,689 |
| 16. | Fairview Borough | 55.0% | 21.2%(+33.8)#16 | 18.7%(+36.4)#1,729 |
| 17. | East Franklin | 55.0% | 21.2%(+33.8)#17 | 18.7%(+36.3)#1,735 |
| 18. | Kearny | 54.7% | 21.2%(+33.4)#18 | 18.7%(+36.0)#1,750 |
| 19. | Haledon Borough | 54.5% | 21.2%(+33.3)#19 | 18.7%(+35.8)#1,758 |
| 20. | Camden | 53.3% | 21.2%(+32.1)#20 | 18.7%(+34.6)#1,820 |
| 21. | Bridgeton | 52.7% | 21.2%(+31.5)#21 | 18.7%(+34.0)#1,844 |
| 22. | Woodlynne Borough | 52.6% | 21.2%(+31.4)#22 | 18.7%(+33.9)#1,848 |
| 23. | Plainfield | 52.4% | 21.2%(+31.1)#23 | 18.7%(+33.7)#1,856 |
| 24. | Bound Brook Borough | 51.6% | 21.2%(+30.4)#24 | 18.7%(+33.0)#1,882 |
| 25. | Ridgefield Park | 51.6% | 21.2%(+30.4)#25 | 18.7%(+32.9)#1,883 |
| 26. | Bogota Borough | 50.3% | 21.2%(+29.1)#26 | 18.7%(+31.7)#1,935 |
| 27. | Wharton Borough | 50.0% | 21.2%(+28.8)#27 | 18.7%(+31.4)#1,946 |
| 28. | Hopelawn | 49.6% | 21.2%(+28.4)#28 | 18.7%(+30.9)#1,973 |
| 29. | Silver Lake Cdp Essex County | 49.6% | 21.2%(+28.3)#29 | 18.7%(+30.9)#1,975 |
| 30. | Pleasantville | 48.7% | 21.2%(+27.4)#30 | 18.7%(+30.0)#2,026 |
| 31. | Port Reading | 48.6% | 21.2%(+27.4)#31 | 18.7%(+29.9)#2,031 |
| 32. | North Plainfield Borough | 48.2% | 21.2%(+27.0)#32 | 18.7%(+29.6)#2,054 |
| 33. | New Brunswick | 46.9% | 21.2%(+25.6)#33 | 18.7%(+28.2)#2,116 |
| 34. | Harrison | 46.9% | 21.2%(+25.6)#34 | 18.7%(+28.2)#2,119 |
| 35. | Dunellen Borough | 45.6% | 21.2%(+24.3)#35 | 18.7%(+26.9)#2,176 |
| 36. | Freehold Borough | 45.0% | 21.2%(+23.8)#36 | 18.7%(+26.3)#2,207 |
| 37. | Ampere North | 44.1% | 21.2%(+22.9)#37 | 18.7%(+25.4)#2,264 |
| 38. | Vineland | 43.1% | 21.2%(+21.9)#38 | 18.7%(+24.4)#2,321 |
| 39. | Roadstown | 42.1% | 21.2%(+20.8)#39 | 18.7%(+23.4)#2,386 |
| 40. | Twin Rivers | 41.0% | 21.2%(+19.8)#40 | 18.7%(+22.4)#2,441 |
| 41. | Harrisonville | 40.4% | 21.2%(+19.2)#41 | 18.7%(+21.8)#2,480 |
| 42. | Garfield | 40.4% | 21.2%(+19.2)#42 | 18.7%(+21.7)#2,485 |
| 43. | Mizpah | 39.7% | 21.2%(+18.5)#43 | 18.7%(+21.1)#2,525 |
| 44. | Lodi Borough | 39.6% | 21.2%(+18.4)#44 | 18.7%(+21.0)#2,533 |
| 45. | Trenton | 38.7% | 21.2%(+17.5)#45 | 18.7%(+20.1)#2,590 |
| 46. | Clifton | 38.5% | 21.2%(+17.3)#46 | 18.7%(+19.9)#2,606 |
| 47. | Three Bridges | 37.6% | 21.2%(+16.4)#47 | 18.7%(+19.0)#2,678 |
| 48. | Newark | 37.2% | 21.2%(+16.0)#48 | 18.7%(+18.6)#2,700 |
| 49. | Little Ferry Borough | 37.0% | 21.2%(+15.8)#49 | 18.7%(+18.3)#2,714 |
| 50. | Hackensack | 36.8% | 21.2%(+15.6)#50 | 18.7%(+18.2)#2,723 |
| 51. | Cliffside Park Borough | 36.2% | 21.2%(+15.0)#51 | 18.7%(+17.5)#2,787 |
| 52. | Ridgefield Borough | 35.8% | 21.2%(+14.5)#52 | 18.7%(+17.1)#2,825 |
| 53. | Carteret Borough | 35.2% | 21.2%(+14.0)#53 | 18.7%(+16.6)#2,870 |
| 54. | Bayonne | 34.7% | 21.2%(+13.5)#54 | 18.7%(+16.1)#2,910 |
| 55. | Linden | 34.4% | 21.2%(+13.2)#55 | 18.7%(+15.8)#2,938 |
| 56. | Roselle Borough | 34.3% | 21.2%(+13.1)#56 | 18.7%(+15.7)#2,940 |
| 57. | South Bound Brook Borough | 34.2% | 21.2%(+13.0)#57 | 18.7%(+15.6)#2,956 |
| 58. | Atlantic City | 33.4% | 21.2%(+12.2)#58 | 18.7%(+14.8)#3,024 |
| 59. | Roselle Park Borough | 32.7% | 21.2%(+11.4)#59 | 18.7%(+14.0)#3,093 |
| 60. | Penns Grove Borough | 32.3% | 21.2%(+11.1)#60 | 18.7%(+13.7)#3,135 |
| 61. | Elmwood Park Borough | 31.8% | 21.2%(+10.6)#61 | 18.7%(+13.1)#3,194 |
| 62. | Singac | 31.7% | 21.2%(+10.5)#62 | 18.7%(+13.1)#3,198 |
| 63. | Lindenwold Borough | 31.5% | 21.2%(+10.2)#63 | 18.7%(+12.8)#3,232 |
| 64. | North Arlington Borough | 30.9% | 21.2%(+9.71)#64 | 18.7%(+12.3)#3,291 |
| 65. | Hightstown Borough | 30.9% | 21.2%(+9.71)#65 | 18.7%(+12.3)#3,292 |
| 66. | South River Borough | 30.0% | 21.2%(+8.76)#66 | 18.7%(+11.3)#3,396 |
| 67. | South Toms River Borough | 29.9% | 21.2%(+8.70)#67 | 18.7%(+11.3)#3,403 |
| 68. | Kenilworth Borough | 29.8% | 21.2%(+8.57)#68 | 18.7%(+11.2)#3,419 |
| 69. | Jamesburg Borough | 29.7% | 21.2%(+8.48)#69 | 18.7%(+11.1)#3,434 |
| 70. | Bergenfield Borough | 29.2% | 21.2%(+7.96)#70 | 18.7%(+10.5)#3,483 |
| 71. | Englewood | 29.0% | 21.2%(+7.81)#71 | 18.7%(+10.4)#3,504 |
| 72. | Finderne | 28.6% | 21.2%(+7.34)#72 | 18.7%(+9.91)#3,552 |
| 73. | Egg Harbor City | 28.5% | 21.2%(+7.25)#73 | 18.7%(+9.82)#3,567 |
| 74. | Woodbine Borough | 28.3% | 21.2%(+7.08)#74 | 18.7%(+9.66)#3,591 |
| 75. | Voorhees | 28.1% | 21.2%(+6.91)#75 | 18.7%(+9.49)#3,611 |
| 76. | Elwood | 28.1% | 21.2%(+6.85)#76 | 18.7%(+9.42)#3,623 |
| 77. | Roosevelt Borough | 28.1% | 21.2%(+6.83)#77 | 18.7%(+9.41)#3,624 |
| 78. | Woodland Park Borough | 27.9% | 21.2%(+6.64)#78 | 18.7%(+9.22)#3,643 |
| 79. | Buena Borough | 27.4% | 21.2%(+6.19)#79 | 18.7%(+8.77)#3,703 |
| 80. | Woodbridge | 27.3% | 21.2%(+6.10)#80 | 18.7%(+8.68)#3,714 |
| 81. | Seabrook Farms | 27.3% | 21.2%(+6.07)#81 | 18.7%(+8.65)#3,718 |
| 82. | Millstone Borough | 27.2% | 21.2%(+6.00)#82 | 18.7%(+8.57)#3,730 |
| 83. | Jersey City | 27.2% | 21.2%(+5.96)#83 | 18.7%(+8.53)#3,737 |
| 84. | Watsessing | 26.9% | 21.2%(+5.70)#84 | 18.7%(+8.28)#3,774 |
| 85. | Fort Dix | 26.8% | 21.2%(+5.61)#85 | 18.7%(+8.18)#3,789 |
| 86. | Leisure Village | 26.8% | 21.2%(+5.59)#86 | 18.7%(+8.16)#3,791 |
| 87. | Middlesex Borough | 26.7% | 21.2%(+5.44)#87 | 18.7%(+8.01)#3,810 |
| 88. | Rahway | 26.1% | 21.2%(+4.88)#88 | 18.7%(+7.46)#3,874 |
| 89. | Morristown | 25.9% | 21.2%(+4.67)#89 | 18.7%(+7.24)#3,902 |
| 90. | Red Bank Borough | 25.6% | 21.2%(+4.41)#90 | 18.7%(+6.99)#3,935 |
| 91. | Flemington Borough | 25.6% | 21.2%(+4.33)#91 | 18.7%(+6.90)#3,952 |
| 92. | Maywood Borough | 25.2% | 21.2%(+3.93)#92 | 18.7%(+6.51)#3,993 |
| 93. | Wildwood | 25.2% | 21.2%(+3.93)#93 | 18.7%(+6.50)#3,994 |
| 94. | Whitesboro | 25.1% | 21.2%(+3.84)#94 | 18.7%(+6.42)#4,006 |
| 95. | Hasbrouck Heights Borough | 25.0% | 21.2%(+3.74)#95 | 18.7%(+6.32)#4,024 |
| 96. | Union | 24.9% | 21.2%(+3.69)#96 | 18.7%(+6.26)#4,028 |
| 97. | West Berlin | 24.8% | 21.2%(+3.58)#97 | 18.7%(+6.15)#4,043 |
| 98. | Collings Lakes | 24.7% | 21.2%(+3.50)#98 | 18.7%(+6.08)#4,052 |
| 99. | Hammonton | 24.7% | 21.2%(+3.46)#99 | 18.7%(+6.04)#4,059 |
| 100. | Fords | 24.5% | 21.2%(+3.24)#100 | 18.7%(+5.81)#4,104 |
Common Questions
What are the Top 10 Cities with the Highest Percentage of Hispanic or Latino Population in New Jersey?
Top 10 Cities with the Highest Percentage of Hispanic or Latino Population in New Jersey are:
#1
81.3%
#2
78.8%
#3
77.2%
#4
74.1%
#5
72.0%
#6
67.3%
#7
65.6%
#8
63.1%
#9
55.0%
#10
54.7%
What city has the Highest Percentage of Hispanic or Latino Population in New Jersey?
Union City has the Highest Percentage of Hispanic or Latino Population in New Jersey with 81.3%.
What is the Percentage of Hispanic or Latino Population in the State of New Jersey?
Percentage of Hispanic or Latino Population in New Jersey is 21.2%.
What is the Percentage of Hispanic or Latino Population in the United States?
Percentage of Hispanic or Latino Population in the United States is 18.7%.