Green Knoll, NJ Map & Demographics
Green Knoll Map
Green Knoll Overview
$60,508
PER CAPITA INCOME
$190,725
AVG FAMILY INCOME
$149,228
AVG HOUSEHOLD INCOME
43.1%
WAGE / INCOME GAP [ % ]
56.9¢/ $1
WAGE / INCOME GAP [ $ ]
0.41
INEQUALITY / GINI INDEX
6,635
TOTAL POPULATION
2,994
MALE POPULATION
3,641
FEMALE POPULATION
82.23
MALES / 100 FEMALES
121.61
FEMALES / 100 MALES
44.6
MEDIAN AGE
3.5
AVG FAMILY SIZE
2.7
AVG HOUSEHOLD SIZE
3,495
LABOR FORCE [ PEOPLE ]
64.9%
PERCENT IN LABOR FORCE
3.1%
UNEMPLOYMENT RATE
Income in Green Knoll
Income Overview in Green Knoll
Per Capita Income in Green Knoll is $60,508, while median incomes of families and households are $190,725 and $149,228 respectively.
| Characteristic | Number | Measure |
| Per Capita Income | 6,635 | $60,508 |
| Median Family Income | 1,584 | $190,725 |
| Mean Family Income | 1,584 | $206,605 |
| Median Household Income | 2,358 | $149,228 |
| Mean Household Income | 2,358 | $164,205 |
| Income Deficit | 1,584 | $0 |
| Wage / Income Gap (%) | 6,635 | 43.12% |
| Wage / Income Gap ($) | 6,635 | 56.88¢ per $1 |
| Gini / Inequality Index | 6,635 | 0.41 |
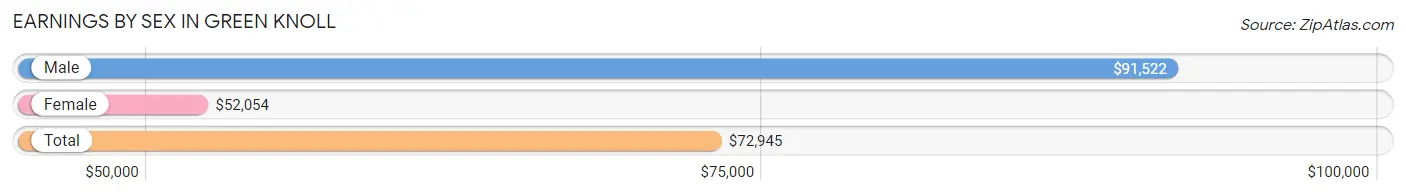
Earnings by Sex in Green Knoll
Average Earnings in Green Knoll are $72,945, $91,522 for men and $52,054 for women, a difference of 43.1%.
| Sex | Number | Average Earnings |
| Male | 1,896 (51.7%) | $91,522 |
| Female | 1,770 (48.3%) | $52,054 |
| Total | 3,666 (100.0%) | $72,945 |
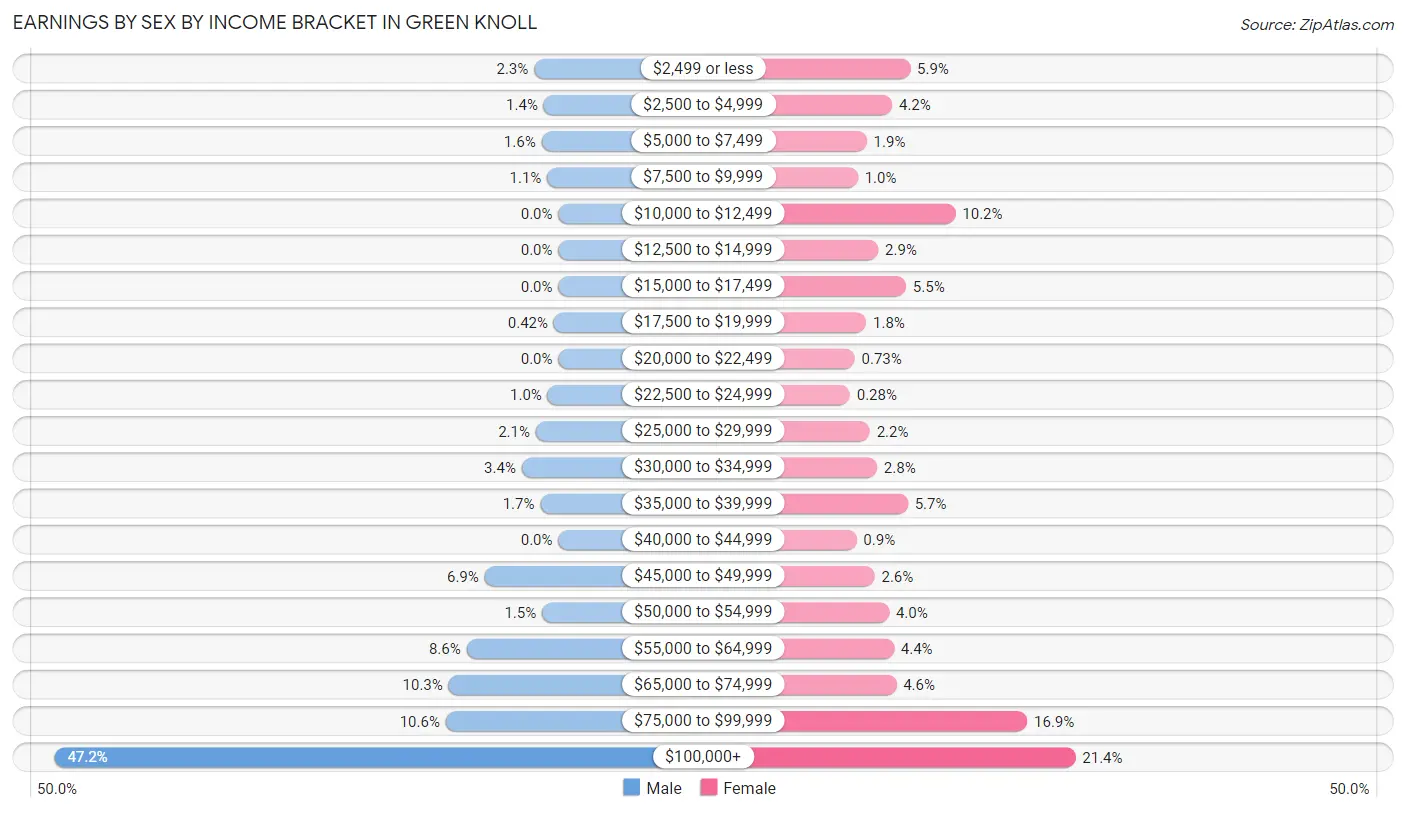
Earnings by Sex by Income Bracket in Green Knoll
The most common earnings brackets in Green Knoll are $100,000+ for men (895 | 47.2%) and $100,000+ for women (379 | 21.4%).
| Income | Male | Female |
| $2,499 or less | 43 (2.3%) | 105 (5.9%) |
| $2,500 to $4,999 | 26 (1.4%) | 75 (4.2%) |
| $5,000 to $7,499 | 30 (1.6%) | 33 (1.9%) |
| $7,500 to $9,999 | 20 (1.1%) | 18 (1.0%) |
| $10,000 to $12,499 | 0 (0.0%) | 180 (10.2%) |
| $12,500 to $14,999 | 0 (0.0%) | 52 (2.9%) |
| $15,000 to $17,499 | 0 (0.0%) | 98 (5.5%) |
| $17,500 to $19,999 | 8 (0.4%) | 32 (1.8%) |
| $20,000 to $22,499 | 0 (0.0%) | 13 (0.7%) |
| $22,500 to $24,999 | 19 (1.0%) | 5 (0.3%) |
| $25,000 to $29,999 | 40 (2.1%) | 38 (2.1%) |
| $30,000 to $34,999 | 65 (3.4%) | 50 (2.8%) |
| $35,000 to $39,999 | 32 (1.7%) | 101 (5.7%) |
| $40,000 to $44,999 | 0 (0.0%) | 16 (0.9%) |
| $45,000 to $49,999 | 131 (6.9%) | 46 (2.6%) |
| $50,000 to $54,999 | 29 (1.5%) | 70 (4.0%) |
| $55,000 to $64,999 | 163 (8.6%) | 78 (4.4%) |
| $65,000 to $74,999 | 195 (10.3%) | 82 (4.6%) |
| $75,000 to $99,999 | 200 (10.5%) | 299 (16.9%) |
| $100,000+ | 895 (47.2%) | 379 (21.4%) |
| Total | 1,896 (100.0%) | 1,770 (100.0%) |
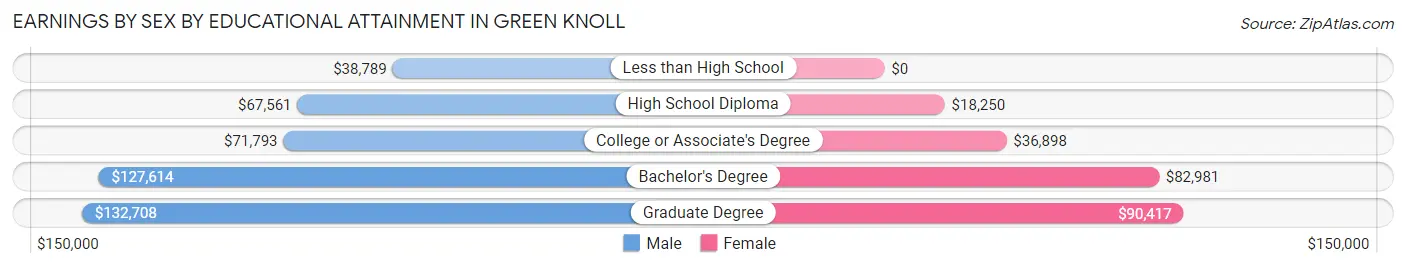
Earnings by Sex by Educational Attainment in Green Knoll
Average earnings in Green Knoll are $105,667 for men and $66,375 for women, a difference of 37.2%. Men with an educational attainment of graduate degree enjoy the highest average annual earnings of $132,708, while those with less than high school education earn the least with $38,789. Women with an educational attainment of graduate degree earn the most with the average annual earnings of $90,417, while those with high school diploma education have the smallest earnings of $18,250.
| Educational Attainment | Male Income | Female Income |
| Less than High School | $38,789 | $0 |
| High School Diploma | $67,561 | $18,250 |
| College or Associate's Degree | $71,793 | $36,898 |
| Bachelor's Degree | $127,614 | $82,981 |
| Graduate Degree | $132,708 | $90,417 |
| Total | $105,667 | $66,375 |
Family Income in Green Knoll
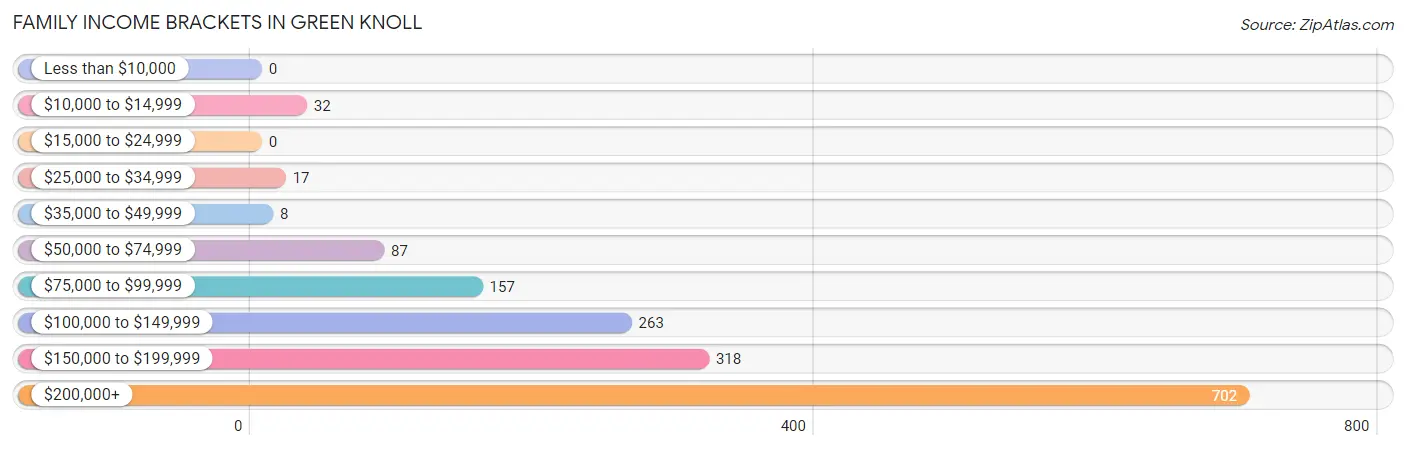
Family Income Brackets in Green Knoll
According to the Green Knoll family income data, there are 702 families falling into the $200,000+ income range, which is the most common income bracket and makes up 44.3% of all families.
| Income Bracket | # Families | % Families |
| Less than $10,000 | 0 | 0.0% |
| $10,000 to $14,999 | 32 | 2.0% |
| $15,000 to $24,999 | 0 | 0.0% |
| $25,000 to $34,999 | 17 | 1.1% |
| $35,000 to $49,999 | 8 | 0.5% |
| $50,000 to $74,999 | 87 | 5.5% |
| $75,000 to $99,999 | 157 | 9.9% |
| $100,000 to $149,999 | 263 | 16.6% |
| $150,000 to $199,999 | 318 | 20.1% |
| $200,000+ | 702 | 44.3% |
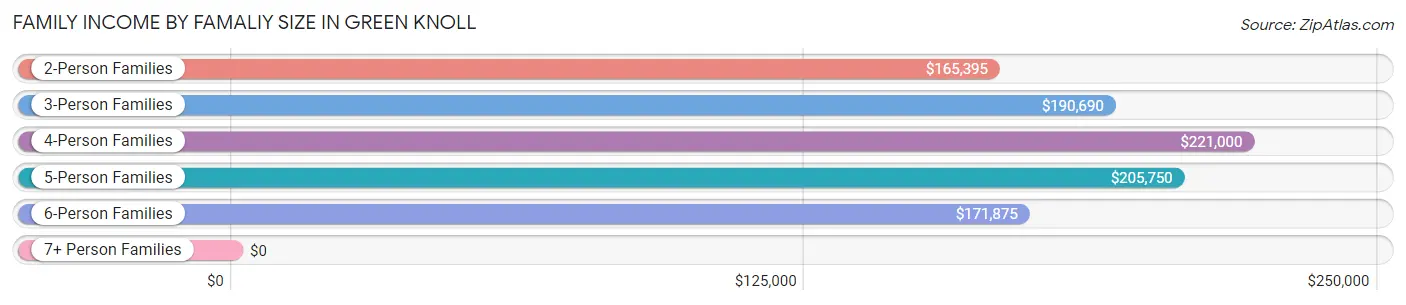
Family Income by Famaliy Size in Green Knoll
4-person families (342 | 21.6%) account for the highest median family income in Green Knoll with $221,000 per family, while 2-person families (492 | 31.1%) have the highest median income of $82,698 per family member.
| Income Bracket | # Families | Median Income |
| 2-Person Families | 492 (31.1%) | $165,395 |
| 3-Person Families | 518 (32.7%) | $190,690 |
| 4-Person Families | 342 (21.6%) | $221,000 |
| 5-Person Families | 91 (5.7%) | $205,750 |
| 6-Person Families | 119 (7.5%) | $171,875 |
| 7+ Person Families | 22 (1.4%) | $0 |
| Total | 1,584 (100.0%) | $190,725 |
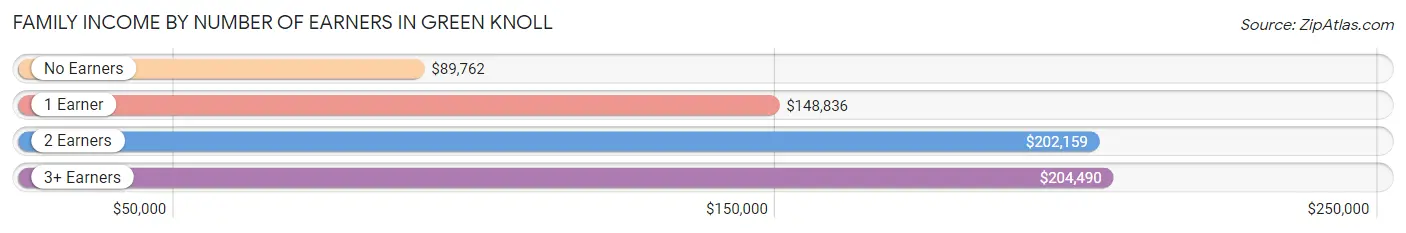
Family Income by Number of Earners in Green Knoll
The median family income in Green Knoll is $190,725, with families comprising 3+ earners (346) having the highest median family income of $204,490, while families with no earners (144) have the lowest median family income of $89,762, accounting for 21.8% and 9.1% of families, respectively.
| Number of Earners | # Families | Median Income |
| No Earners | 144 (9.1%) | $89,762 |
| 1 Earner | 425 (26.8%) | $148,836 |
| 2 Earners | 669 (42.2%) | $202,159 |
| 3+ Earners | 346 (21.8%) | $204,490 |
| Total | 1,584 (100.0%) | $190,725 |
Household Income in Green Knoll
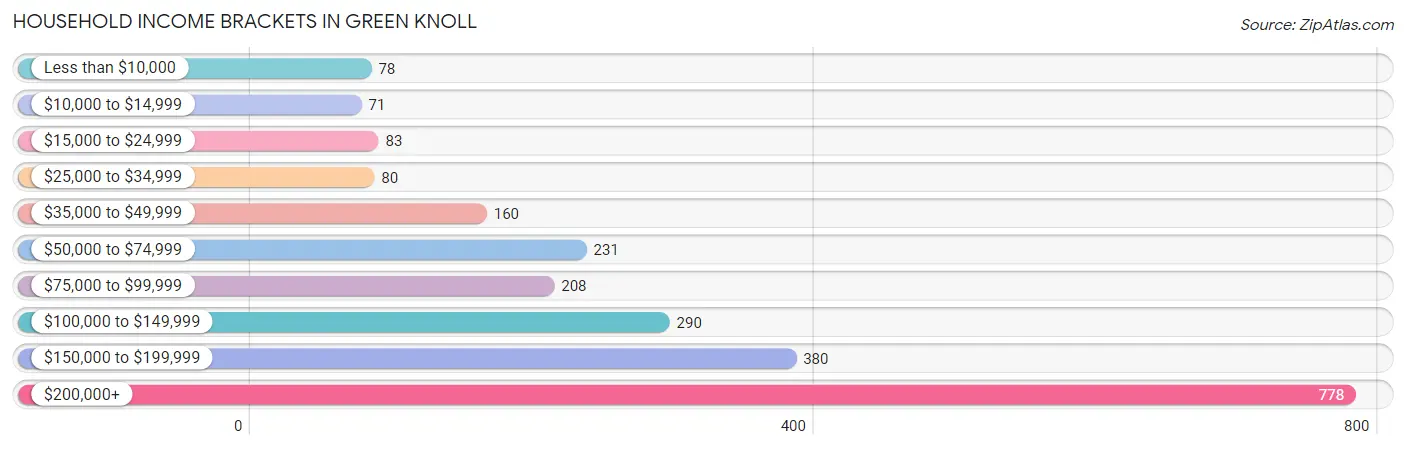
Household Income Brackets in Green Knoll
With 778 households falling in the category, the $200,000+ income range is the most frequent in Green Knoll, accounting for 33.0% of all households. In contrast, only 71 households (3.0%) fall into the $10,000 to $14,999 income bracket, making it the least populous group.
| Income Bracket | # Households | % Households |
| Less than $10,000 | 78 | 3.3% |
| $10,000 to $14,999 | 71 | 3.0% |
| $15,000 to $24,999 | 83 | 3.5% |
| $25,000 to $34,999 | 80 | 3.4% |
| $35,000 to $49,999 | 160 | 6.8% |
| $50,000 to $74,999 | 231 | 9.8% |
| $75,000 to $99,999 | 208 | 8.8% |
| $100,000 to $149,999 | 290 | 12.3% |
| $150,000 to $199,999 | 380 | 16.1% |
| $200,000+ | 778 | 33.0% |
Household Income by Householder Age in Green Knoll
The median household income in Green Knoll is $149,228, with the highest median household income of $202,105 found in the 45 to 64 years age bracket for the primary householder. A total of 934 households (39.6%) fall into this category. Meanwhile, the 15 to 24 years age bracket for the primary householder has the lowest median household income of $0, with 11 households (0.5%) in this group.
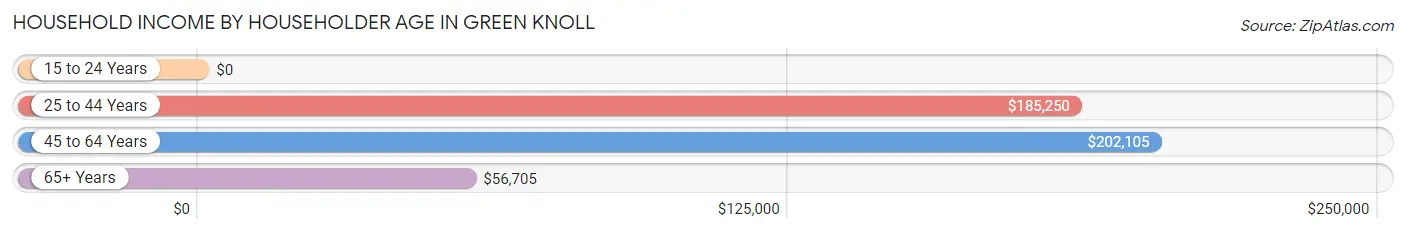
| Income Bracket | # Households | Median Income |
| 15 to 24 Years | 11 (0.5%) | $0 |
| 25 to 44 Years | 543 (23.0%) | $185,250 |
| 45 to 64 Years | 934 (39.6%) | $202,105 |
| 65+ Years | 870 (36.9%) | $56,705 |
| Total | 2,358 (100.0%) | $149,228 |
Poverty in Green Knoll
Income Below Poverty by Sex and Age in Green Knoll
With 2.8% poverty level for males and 5.6% for females among the residents of Green Knoll, 75 year old and over males and 75 year old and over females are the most vulnerable to poverty, with 54 males (26.7%) and 144 females (26.6%) in their respective age groups living below the poverty level.
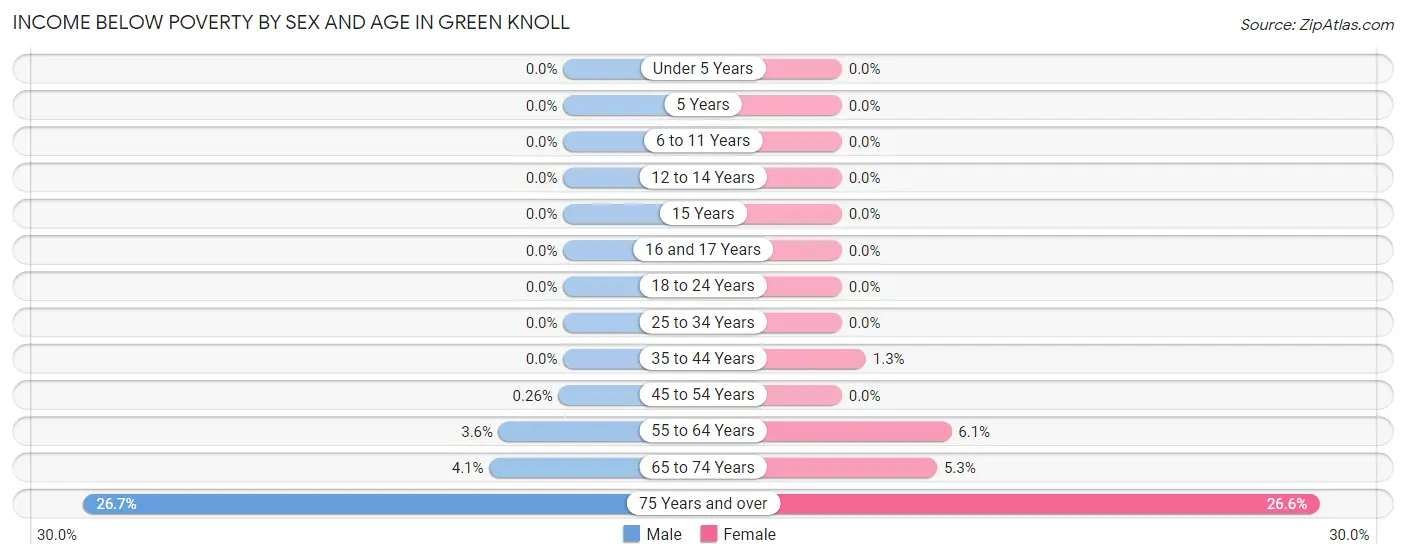
| Age Bracket | Male | Female |
| Under 5 Years | 0 (0.0%) | 0 (0.0%) |
| 5 Years | 0 (0.0%) | 0 (0.0%) |
| 6 to 11 Years | 0 (0.0%) | 0 (0.0%) |
| 12 to 14 Years | 0 (0.0%) | 0 (0.0%) |
| 15 Years | 0 (0.0%) | 0 (0.0%) |
| 16 and 17 Years | 0 (0.0%) | 0 (0.0%) |
| 18 to 24 Years | 0 (0.0%) | 0 (0.0%) |
| 25 to 34 Years | 0 (0.0%) | 0 (0.0%) |
| 35 to 44 Years | 0 (0.0%) | 6 (1.3%) |
| 45 to 54 Years | 1 (0.3%) | 0 (0.0%) |
| 55 to 64 Years | 17 (3.6%) | 25 (6.1%) |
| 65 to 74 Years | 11 (4.1%) | 22 (5.3%) |
| 75 Years and over | 54 (26.7%) | 144 (26.6%) |
| Total | 83 (2.8%) | 197 (5.6%) |
Income Above Poverty by Sex and Age in Green Knoll
According to the poverty statistics in Green Knoll, males aged under 5 years and females aged under 5 years are the age groups that are most secure financially, with 100.0% of males and 100.0% of females in these age groups living above the poverty line.
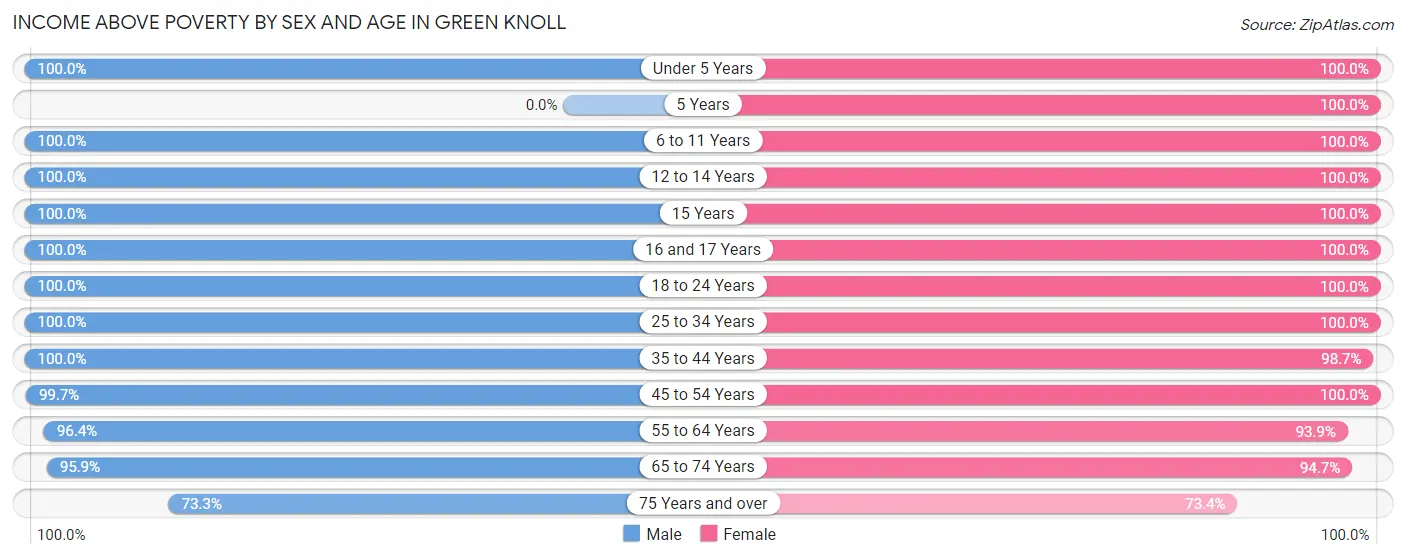
| Age Bracket | Male | Female |
| Under 5 Years | 148 (100.0%) | 138 (100.0%) |
| 5 Years | 0 (0.0%) | 10 (100.0%) |
| 6 to 11 Years | 289 (100.0%) | 272 (100.0%) |
| 12 to 14 Years | 94 (100.0%) | 179 (100.0%) |
| 15 Years | 52 (100.0%) | 62 (100.0%) |
| 16 and 17 Years | 78 (100.0%) | 99 (100.0%) |
| 18 to 24 Years | 161 (100.0%) | 318 (100.0%) |
| 25 to 34 Years | 370 (100.0%) | 204 (100.0%) |
| 35 to 44 Years | 433 (100.0%) | 442 (98.7%) |
| 45 to 54 Years | 387 (99.7%) | 445 (100.0%) |
| 55 to 64 Years | 456 (96.4%) | 385 (93.9%) |
| 65 to 74 Years | 256 (95.9%) | 393 (94.7%) |
| 75 Years and over | 148 (73.3%) | 398 (73.4%) |
| Total | 2,872 (97.2%) | 3,345 (94.4%) |
Income Below Poverty Among Married-Couple Families in Green Knoll
The poverty statistics for married-couple families in Green Knoll show that 2.2% or 31 of the total 1,409 families live below the poverty line. Families with no children have the highest poverty rate of 5.1%, comprising of 31 families. On the other hand, families with 1 or 2 children have the lowest poverty rate of 0.0%, which includes 0 families.
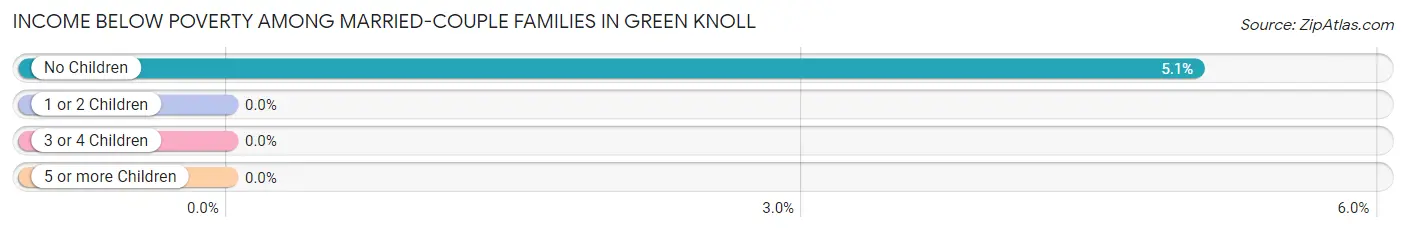
| Children | Above Poverty | Below Poverty |
| No Children | 583 (95.0%) | 31 (5.1%) |
| 1 or 2 Children | 672 (100.0%) | 0 (0.0%) |
| 3 or 4 Children | 123 (100.0%) | 0 (0.0%) |
| 5 or more Children | 0 (0.0%) | 0 (0.0%) |
| Total | 1,378 (97.8%) | 31 (2.2%) |
Income Below Poverty Among Single-Parent Households in Green Knoll
| Children | Single Father | Single Mother |
| No Children | 0 (0.0%) | 0 (0.0%) |
| 1 or 2 Children | 0 (0.0%) | 0 (0.0%) |
| 3 or 4 Children | 0 (0.0%) | 0 (0.0%) |
| 5 or more Children | 0 (0.0%) | 0 (0.0%) |
| Total | 0 (0.0%) | 0 (0.0%) |
Income Below Poverty Among Married-Couple vs Single-Parent Households in Green Knoll
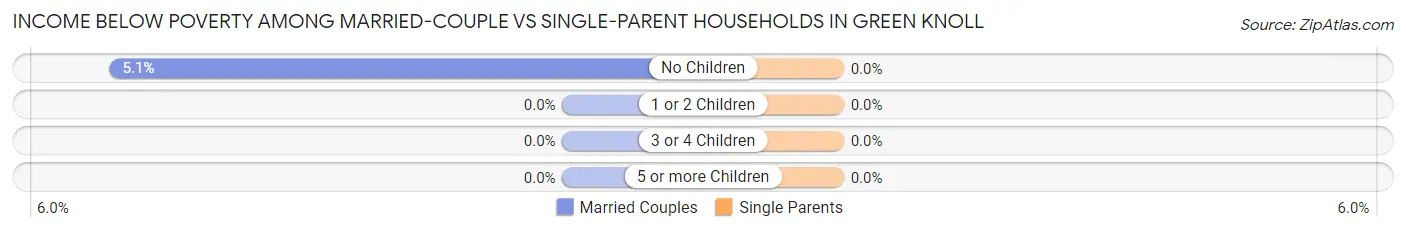
| Children | Married-Couple Families | Single-Parent Households |
| No Children | 31 (5.1%) | 0 (0.0%) |
| 1 or 2 Children | 0 (0.0%) | 0 (0.0%) |
| 3 or 4 Children | 0 (0.0%) | 0 (0.0%) |
| 5 or more Children | 0 (0.0%) | 0 (0.0%) |
| Total | 31 (2.2%) | 0 (0.0%) |
Race in Green Knoll
The most populous races in Green Knoll are White / Caucasian (4,349 | 65.5%), Asian (1,619 | 24.4%), and Hispanic or Latino (522 | 7.9%).
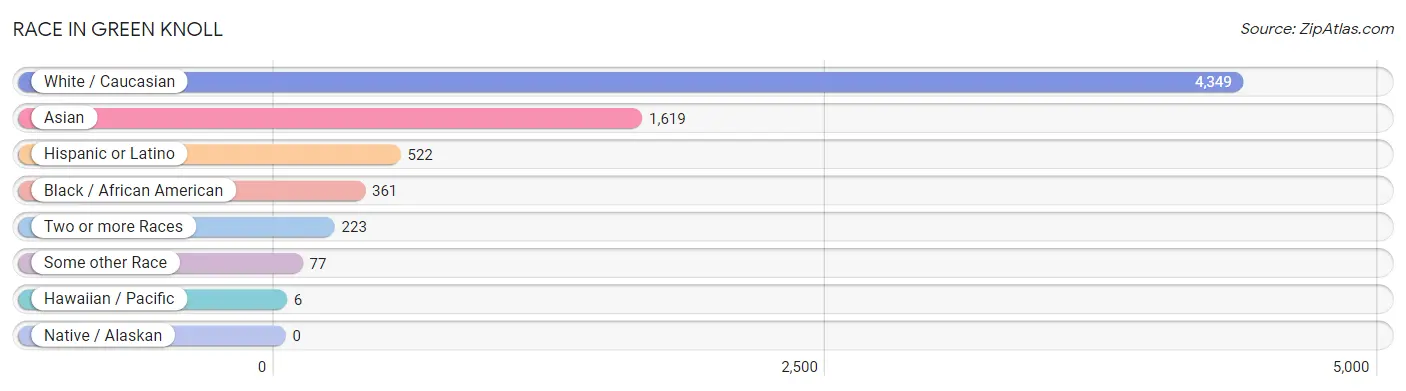
| Race | # Population | % Population |
| Asian | 1,619 | 24.4% |
| Black / African American | 361 | 5.4% |
| Hawaiian / Pacific | 6 | 0.1% |
| Hispanic or Latino | 522 | 7.9% |
| Native / Alaskan | 0 | 0.0% |
| White / Caucasian | 4,349 | 65.5% |
| Two or more Races | 223 | 3.4% |
| Some other Race | 77 | 1.2% |
| Total | 6,635 | 100.0% |
Ancestry in Green Knoll
The most populous ancestries reported in Green Knoll are Italian (888 | 13.4%), Thai (688 | 10.4%), Irish (678 | 10.2%), German (663 | 10.0%), and Scottish (553 | 8.3%), together accounting for 52.3% of all Green Knoll residents.
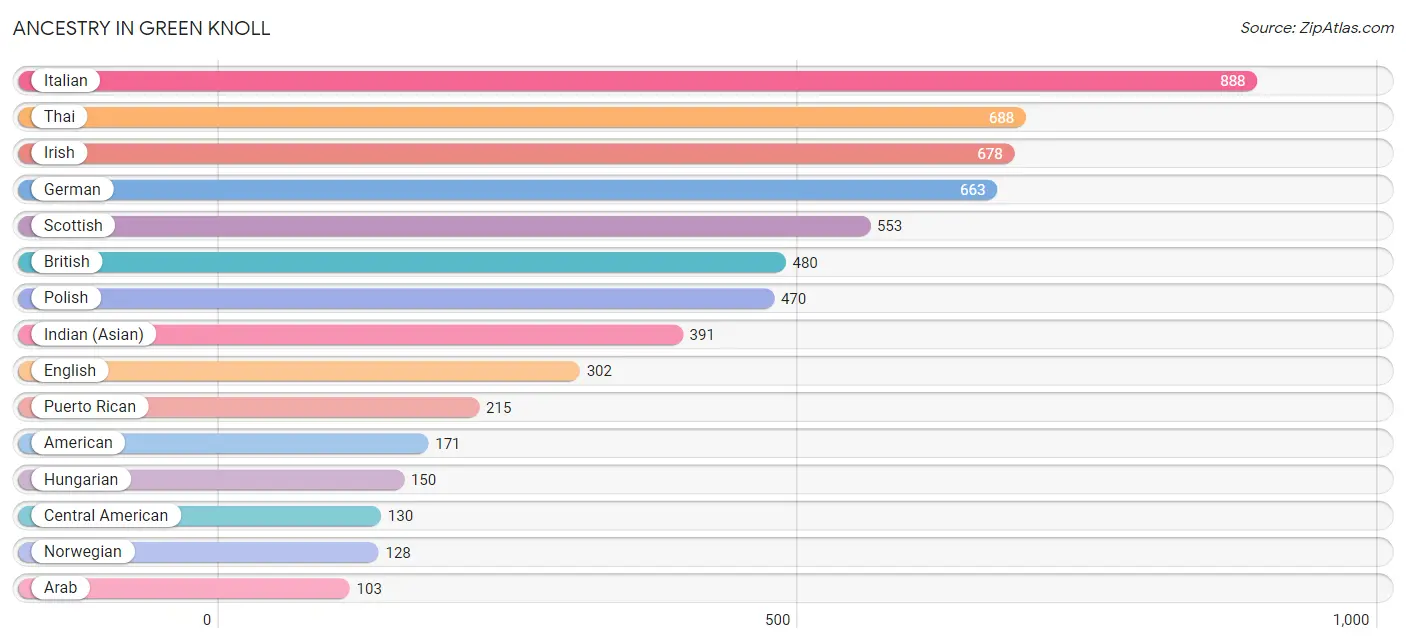
| Ancestry | # Population | % Population |
| American | 171 | 2.6% |
| Arab | 103 | 1.5% |
| Argentinean | 31 | 0.5% |
| Armenian | 23 | 0.4% |
| Austrian | 54 | 0.8% |
| British | 480 | 7.2% |
| Burmese | 18 | 0.3% |
| Central American | 130 | 2.0% |
| Central American Indian | 30 | 0.4% |
| Colombian | 37 | 0.6% |
| Costa Rican | 83 | 1.3% |
| Czech | 30 | 0.4% |
| Czechoslovakian | 15 | 0.2% |
| Danish | 36 | 0.5% |
| Dominican | 49 | 0.7% |
| Dutch | 46 | 0.7% |
| Eastern European | 43 | 0.6% |
| Egyptian | 103 | 1.5% |
| English | 302 | 4.5% |
| European | 102 | 1.5% |
| Filipino | 94 | 1.4% |
| French | 53 | 0.8% |
| German | 663 | 10.0% |
| Greek | 32 | 0.5% |
| Guatemalan | 12 | 0.2% |
| Honduran | 8 | 0.1% |
| Hungarian | 150 | 2.3% |
| Indian (Asian) | 391 | 5.9% |
| Irish | 678 | 10.2% |
| Italian | 888 | 13.4% |
| Korean | 22 | 0.3% |
| Lithuanian | 13 | 0.2% |
| Mexican | 6 | 0.1% |
| Mongolian | 75 | 1.1% |
| Native Hawaiian | 6 | 0.1% |
| Northern European | 29 | 0.4% |
| Norwegian | 128 | 1.9% |
| Peruvian | 6 | 0.1% |
| Polish | 470 | 7.1% |
| Portuguese | 49 | 0.7% |
| Puerto Rican | 215 | 3.2% |
| Romanian | 9 | 0.1% |
| Russian | 95 | 1.4% |
| Salvadoran | 27 | 0.4% |
| Scandinavian | 9 | 0.1% |
| Scotch-Irish | 43 | 0.6% |
| Scottish | 553 | 8.3% |
| Serbian | 10 | 0.2% |
| Slovak | 63 | 0.9% |
| Slovene | 23 | 0.4% |
| South American | 82 | 1.2% |
| Spaniard | 12 | 0.2% |
| Spanish | 25 | 0.4% |
| Sri Lankan | 45 | 0.7% |
| Swedish | 55 | 0.8% |
| Thai | 688 | 10.4% |
| U.S. Virgin Islander | 8 | 0.1% |
| Ukrainian | 13 | 0.2% |
| Venezuelan | 8 | 0.1% |
| Welsh | 25 | 0.4% | View All 60 Rows |
Immigrants in Green Knoll
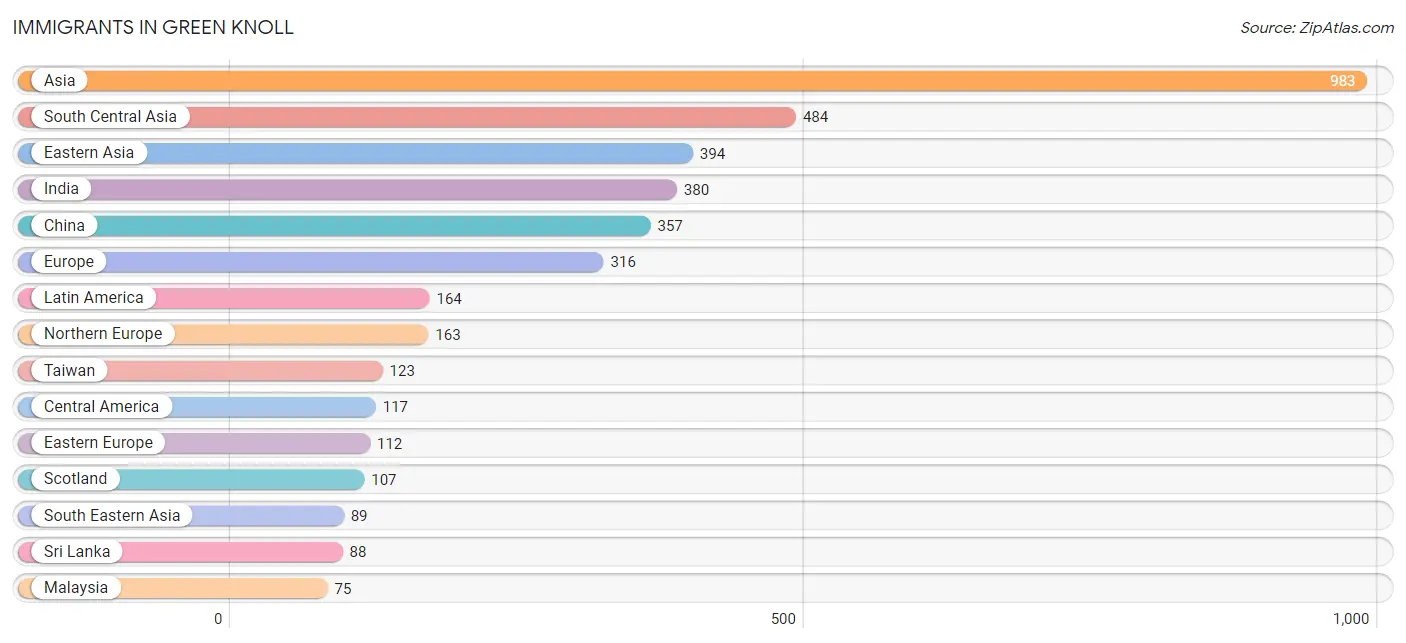
The most numerous immigrant groups reported in Green Knoll came from Asia (983 | 14.8%), South Central Asia (484 | 7.3%), Eastern Asia (394 | 5.9%), India (380 | 5.7%), and China (357 | 5.4%), together accounting for 39.2% of all Green Knoll residents.
| Immigration Origin | # Population | % Population |
| Africa | 50 | 0.7% |
| Armenia | 3 | 0.1% |
| Asia | 983 | 14.8% |
| Belarus | 7 | 0.1% |
| Brazil | 7 | 0.1% |
| Canada | 15 | 0.2% |
| Central America | 117 | 1.8% |
| China | 357 | 5.4% |
| Colombia | 26 | 0.4% |
| Costa Rica | 60 | 0.9% |
| Eastern Asia | 394 | 5.9% |
| Eastern Europe | 112 | 1.7% |
| Egypt | 50 | 0.7% |
| El Salvador | 27 | 0.4% |
| Europe | 316 | 4.8% |
| Guatemala | 11 | 0.2% |
| Honduras | 16 | 0.2% |
| India | 380 | 5.7% |
| Italy | 6 | 0.1% |
| Korea | 37 | 0.6% |
| Latin America | 164 | 2.5% |
| Malaysia | 75 | 1.1% |
| Mexico | 3 | 0.1% |
| Northern Africa | 50 | 0.7% |
| Northern Europe | 163 | 2.5% |
| Norway | 13 | 0.2% |
| Pakistan | 16 | 0.2% |
| Peru | 6 | 0.1% |
| Poland | 50 | 0.7% |
| Portugal | 35 | 0.5% |
| Romania | 24 | 0.4% |
| Russia | 31 | 0.5% |
| Scotland | 107 | 1.6% |
| South America | 47 | 0.7% |
| South Central Asia | 484 | 7.3% |
| South Eastern Asia | 89 | 1.3% |
| Southern Europe | 41 | 0.6% |
| Sri Lanka | 88 | 1.3% |
| Taiwan | 123 | 1.8% |
| Venezuela | 8 | 0.1% |
| Vietnam | 14 | 0.2% |
| Western Asia | 16 | 0.2% | View All 42 Rows |
Sex and Age in Green Knoll
Sex and Age in Green Knoll
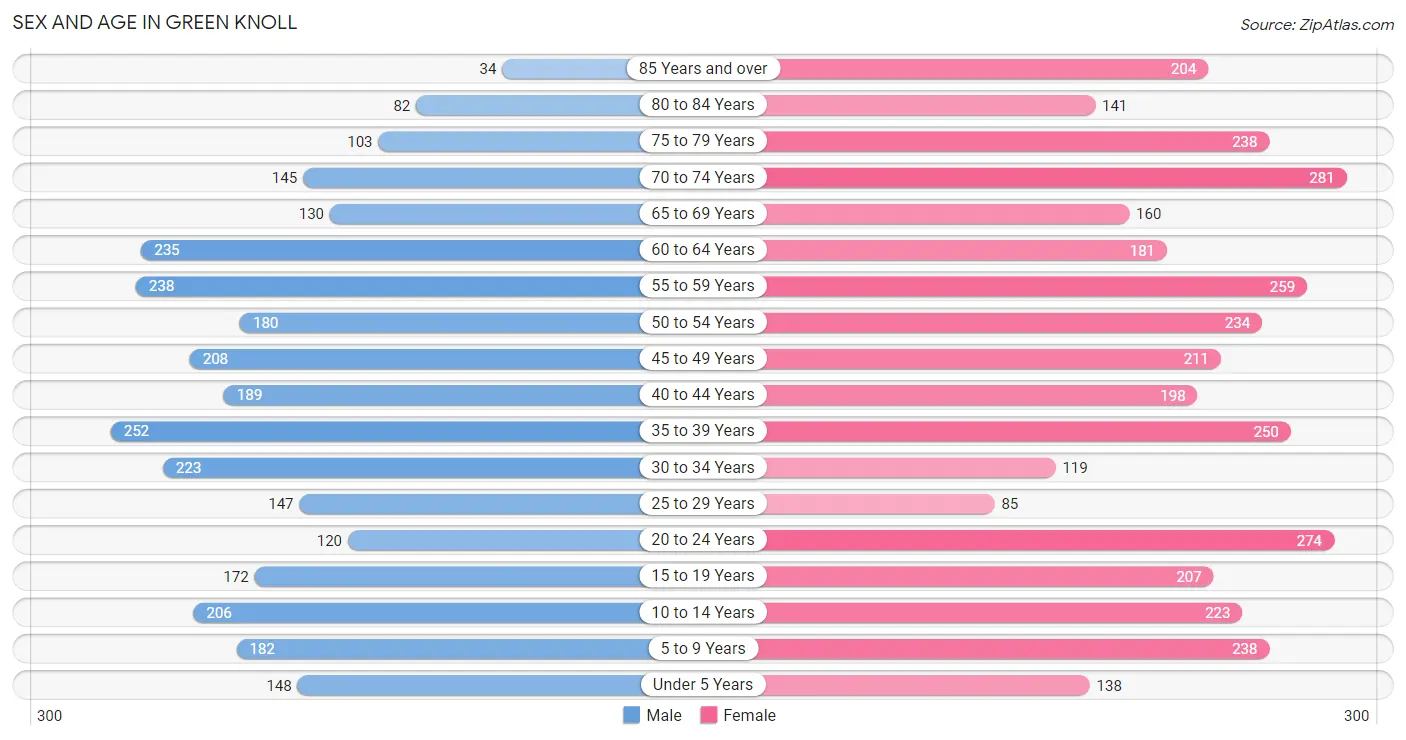
The most populous age groups in Green Knoll are 35 to 39 Years (252 | 8.4%) for men and 70 to 74 Years (281 | 7.7%) for women.
| Age Bracket | Male | Female |
| Under 5 Years | 148 (4.9%) | 138 (3.8%) |
| 5 to 9 Years | 182 (6.1%) | 238 (6.5%) |
| 10 to 14 Years | 206 (6.9%) | 223 (6.1%) |
| 15 to 19 Years | 172 (5.7%) | 207 (5.7%) |
| 20 to 24 Years | 120 (4.0%) | 274 (7.5%) |
| 25 to 29 Years | 147 (4.9%) | 85 (2.3%) |
| 30 to 34 Years | 223 (7.4%) | 119 (3.3%) |
| 35 to 39 Years | 252 (8.4%) | 250 (6.9%) |
| 40 to 44 Years | 189 (6.3%) | 198 (5.4%) |
| 45 to 49 Years | 208 (7.0%) | 211 (5.8%) |
| 50 to 54 Years | 180 (6.0%) | 234 (6.4%) |
| 55 to 59 Years | 238 (8.0%) | 259 (7.1%) |
| 60 to 64 Years | 235 (7.9%) | 181 (5.0%) |
| 65 to 69 Years | 130 (4.3%) | 160 (4.4%) |
| 70 to 74 Years | 145 (4.8%) | 281 (7.7%) |
| 75 to 79 Years | 103 (3.4%) | 238 (6.5%) |
| 80 to 84 Years | 82 (2.7%) | 141 (3.9%) |
| 85 Years and over | 34 (1.1%) | 204 (5.6%) |
| Total | 2,994 (100.0%) | 3,641 (100.0%) |
Families and Households in Green Knoll
Median Family Size in Green Knoll
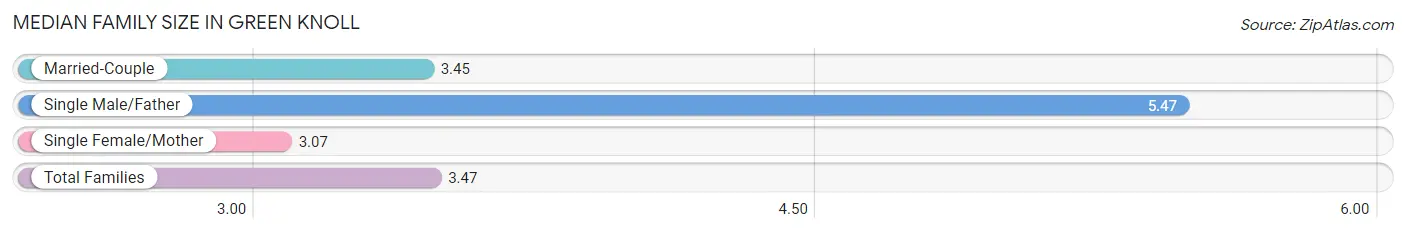
The median family size in Green Knoll is 3.47 persons per family, with single male/father families (43 | 2.7%) accounting for the largest median family size of 5.47 persons per family. On the other hand, single female/mother families (132 | 8.3%) represent the smallest median family size with 3.07 persons per family.
| Family Type | # Families | Family Size |
| Married-Couple | 1,409 (88.9%) | 3.45 |
| Single Male/Father | 43 (2.7%) | 5.47 |
| Single Female/Mother | 132 (8.3%) | 3.07 |
| Total Families | 1,584 (100.0%) | 3.47 |
Median Household Size in Green Knoll
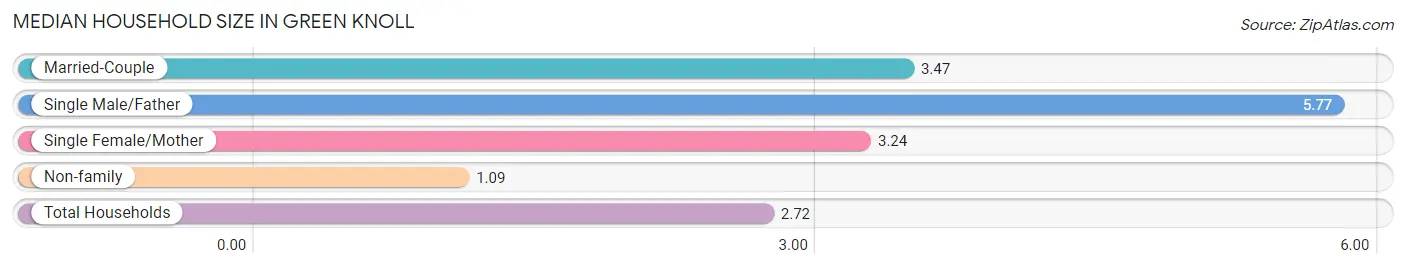
The median household size in Green Knoll is 2.72 persons per household, with single male/father households (43 | 1.8%) accounting for the largest median household size of 5.77 persons per household. non-family households (774 | 32.8%) represent the smallest median household size with 1.09 persons per household.
| Household Type | # Households | Household Size |
| Married-Couple | 1,409 (59.8%) | 3.47 |
| Single Male/Father | 43 (1.8%) | 5.77 |
| Single Female/Mother | 132 (5.6%) | 3.24 |
| Non-family | 774 (32.8%) | 1.09 |
| Total Households | 2,358 (100.0%) | 2.72 |
Household Size by Marriage Status in Green Knoll
Out of a total of 2,358 households in Green Knoll, 1,584 (67.2%) are family households, while 774 (32.8%) are nonfamily households. The most numerous type of family households are 3-person households, comprising 509, and the most common type of nonfamily households are 1-person households, comprising 706.
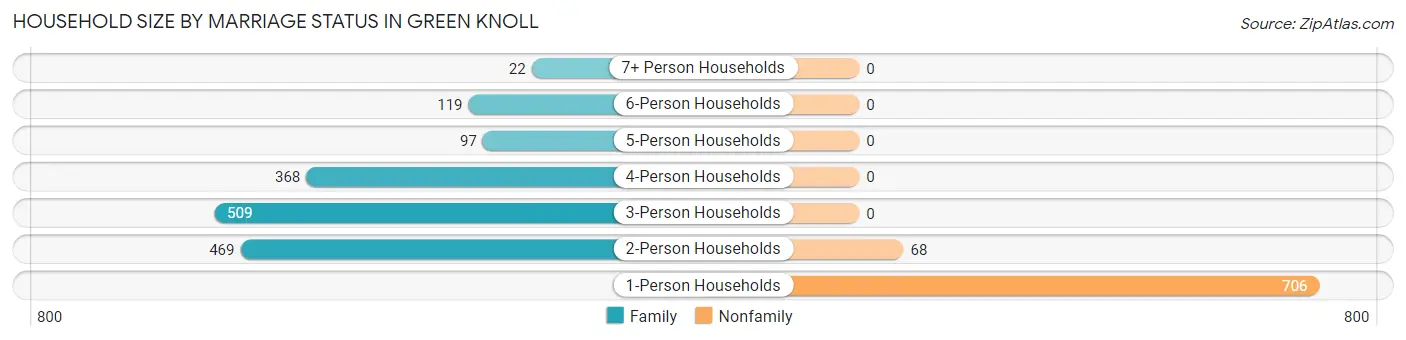
| Household Size | Family Households | Nonfamily Households |
| 1-Person Households | - | 706 (29.9%) |
| 2-Person Households | 469 (19.9%) | 68 (2.9%) |
| 3-Person Households | 509 (21.6%) | 0 (0.0%) |
| 4-Person Households | 368 (15.6%) | 0 (0.0%) |
| 5-Person Households | 97 (4.1%) | 0 (0.0%) |
| 6-Person Households | 119 (5.1%) | 0 (0.0%) |
| 7+ Person Households | 22 (0.9%) | 0 (0.0%) |
| Total | 1,584 (67.2%) | 774 (32.8%) |
Female Fertility in Green Knoll
Fertility by Age in Green Knoll
Average fertility rate in Green Knoll is 103.0 births per 1,000 women. Women in the age bracket of 20 to 34 years have the highest fertility rate with 276.0 births per 1,000 women. Women in the age bracket of 20 to 34 years acount for 92.3% of all women with births.
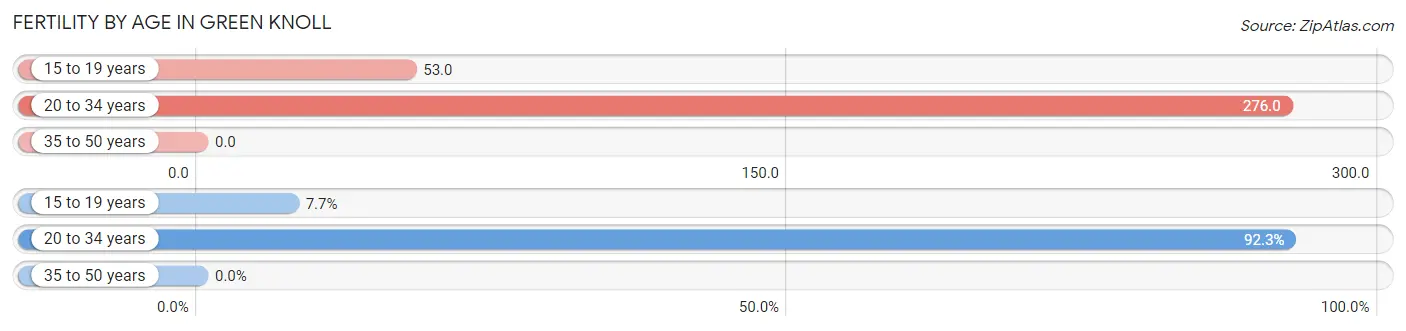
| Age Bracket | Women with Births | Births / 1,000 Women |
| 15 to 19 years | 11 (7.7%) | 53.0 |
| 20 to 34 years | 132 (92.3%) | 276.0 |
| 35 to 50 years | 0 (0.0%) | 0.0 |
| Total | 143 (100.0%) | 103.0 |
Fertility by Age by Marriage Status in Green Knoll
7.7% of women with births (143) in Green Knoll are married. The highest percentage of unmarried women with births falls into 20 to 34 years age bracket with 100.0% of them unmarried at the time of birth, while the lowest percentage of unmarried women with births belong to 15 to 19 years age bracket with 0.0% of them unmarried.
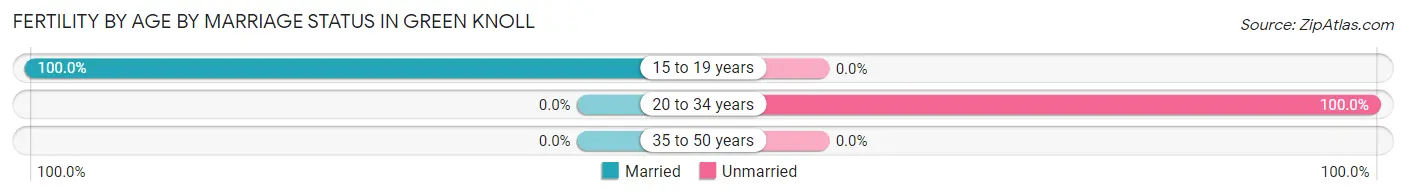
| Age Bracket | Married | Unmarried |
| 15 to 19 years | 11 (100.0%) | 0 (0.0%) |
| 20 to 34 years | 0 (0.0%) | 132 (100.0%) |
| 35 to 50 years | 0 (0.0%) | 0 (0.0%) |
| Total | 11 (7.7%) | 132 (92.3%) |
Fertility by Education in Green Knoll
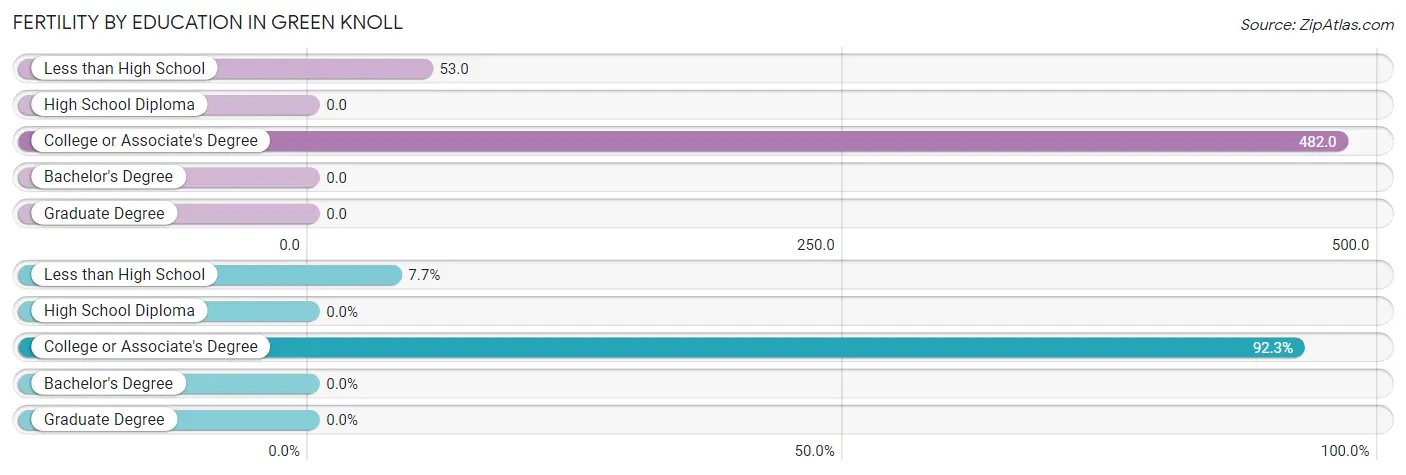
| Educational Attainment | Women with Births | Births / 1,000 Women |
| Less than High School | 11 (7.7%) | 53.0 |
| High School Diploma | 0 (0.0%) | 0.0 |
| College or Associate's Degree | 132 (92.3%) | 482.0 |
| Bachelor's Degree | 0 (0.0%) | 0.0 |
| Graduate Degree | 0 (0.0%) | 0.0 |
| Total | 143 (100.0%) | 103.0 |
Fertility by Education by Marriage Status in Green Knoll
92.3% of women with births in Green Knoll are unmarried. Women with the educational attainment of less than high school are most likely to be married with 100.0% of them married at childbirth, while women with the educational attainment of college or associate's degree are least likely to be married with 100.0% of them unmarried at childbirth.
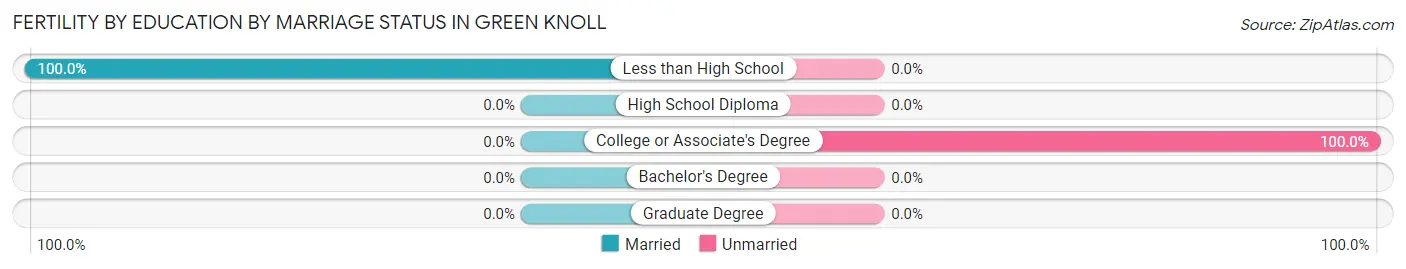
| Educational Attainment | Married | Unmarried |
| Less than High School | 11 (100.0%) | 0 (0.0%) |
| High School Diploma | 0 (0.0%) | 0 (0.0%) |
| College or Associate's Degree | 0 (0.0%) | 132 (100.0%) |
| Bachelor's Degree | 0 (0.0%) | 0 (0.0%) |
| Graduate Degree | 0 (0.0%) | 0 (0.0%) |
| Total | 11 (7.7%) | 132 (92.3%) |
Employment Characteristics in Green Knoll
Employment by Class of Employer in Green Knoll
Among the 3,334 employed individuals in Green Knoll, private company employees (2,599 | 77.9%), local government employees (239 | 7.2%), and not-for-profit organizations (222 | 6.7%) make up the most common classes of employment.
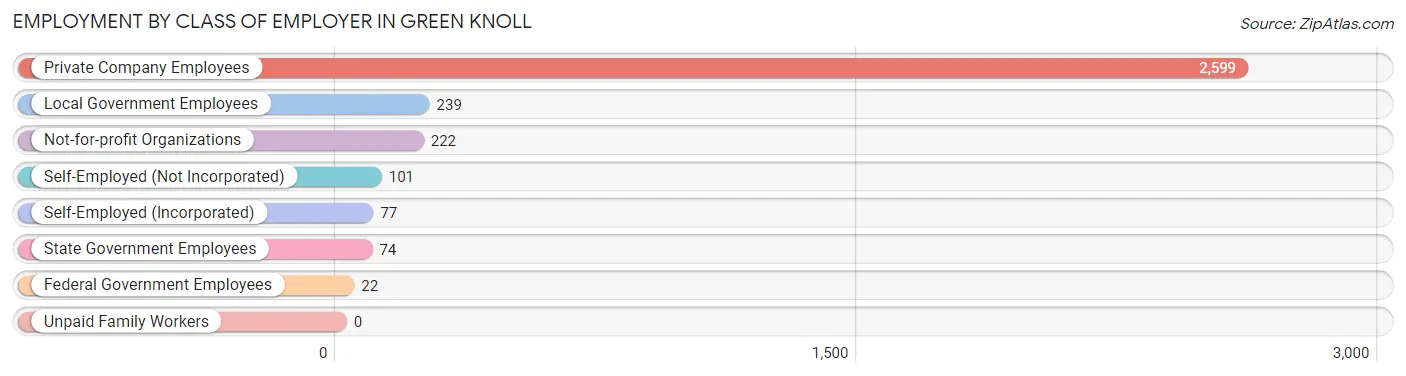
| Employer Class | # Employees | % Employees |
| Private Company Employees | 2,599 | 77.9% |
| Self-Employed (Incorporated) | 77 | 2.3% |
| Self-Employed (Not Incorporated) | 101 | 3.0% |
| Not-for-profit Organizations | 222 | 6.7% |
| Local Government Employees | 239 | 7.2% |
| State Government Employees | 74 | 2.2% |
| Federal Government Employees | 22 | 0.7% |
| Unpaid Family Workers | 0 | 0.0% |
| Total | 3,334 | 100.0% |
Employment Status by Age in Green Knoll
According to the labor force statistics for Green Knoll, out of the total population over 16 years of age (5,385), 64.9% or 3,495 individuals are in the labor force, with 3.1% or 108 of them unemployed. The age group with the highest labor force participation rate is 25 to 29 years, with 94.8% or 220 individuals in the labor force. Within the labor force, the 16 to 19 years age range has the highest percentage of unemployed individuals, with 21.4% or 24 of them being unemployed.
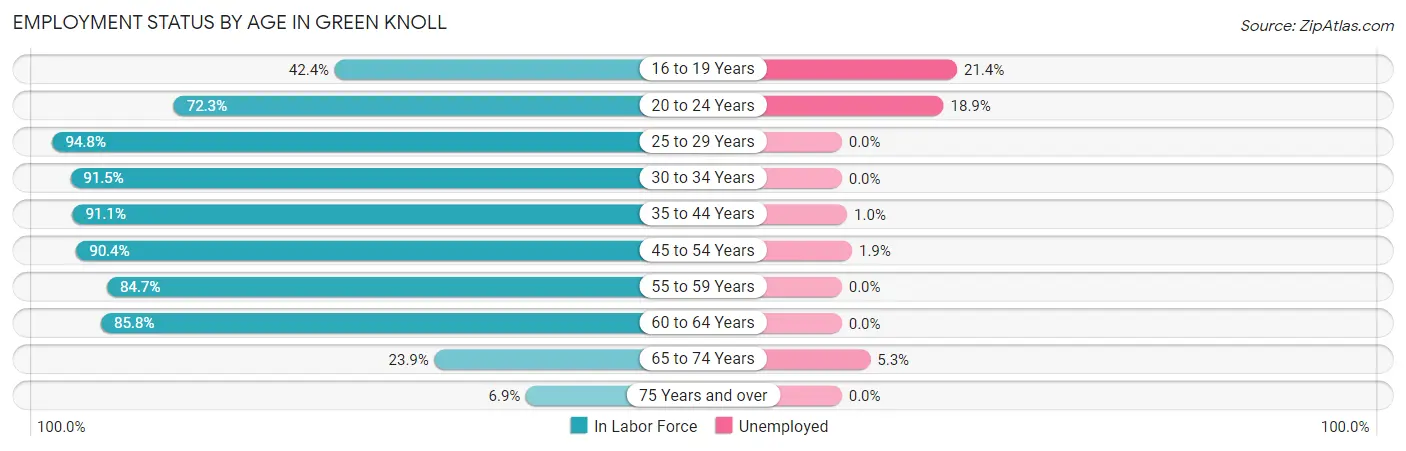
| Age Bracket | In Labor Force | Unemployed |
| 16 to 19 Years | 112 (42.4%) | 24 (21.4%) |
| 20 to 24 Years | 285 (72.3%) | 54 (18.9%) |
| 25 to 29 Years | 220 (94.8%) | 0 (0.0%) |
| 30 to 34 Years | 313 (91.5%) | 0 (0.0%) |
| 35 to 44 Years | 810 (91.1%) | 8 (1.0%) |
| 45 to 54 Years | 753 (90.4%) | 14 (1.9%) |
| 55 to 59 Years | 421 (84.7%) | 0 (0.0%) |
| 60 to 64 Years | 357 (85.8%) | 0 (0.0%) |
| 65 to 74 Years | 171 (23.9%) | 9 (5.3%) |
| 75 Years and over | 55 (6.9%) | 0 (0.0%) |
| Total | 3,495 (64.9%) | 108 (3.1%) |
Employment Status by Educational Attainment in Green Knoll
According to labor force statistics for Green Knoll, 89.6% of individuals (2,875) out of the total population between 25 and 64 years of age (3,209) are in the labor force, with 0.8% or 23 of them being unemployed. The group with the highest labor force participation rate are those with the educational attainment of bachelor's degree or higher, with 91.6% or 2,007 individuals in the labor force. Within the labor force, individuals with bachelor's degree or higher education have the highest percentage of unemployment, with 1.1% or 22 of them being unemployed.
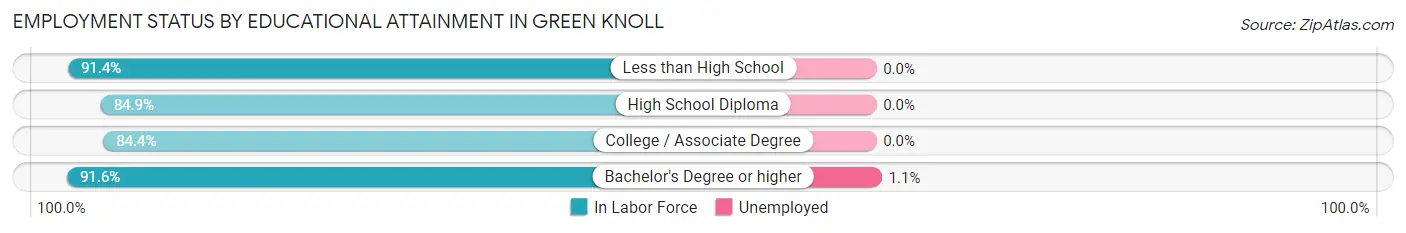
| Educational Attainment | In Labor Force | Unemployed |
| Less than High School | 85 (91.4%) | 0 (0.0%) |
| High School Diploma | 415 (84.9%) | 0 (0.0%) |
| College / Associate Degree | 368 (84.4%) | 0 (0.0%) |
| Bachelor's Degree or higher | 2,007 (91.6%) | 24 (1.1%) |
| Total | 2,875 (89.6%) | 26 (0.8%) |
Employment Occupations by Sex in Green Knoll
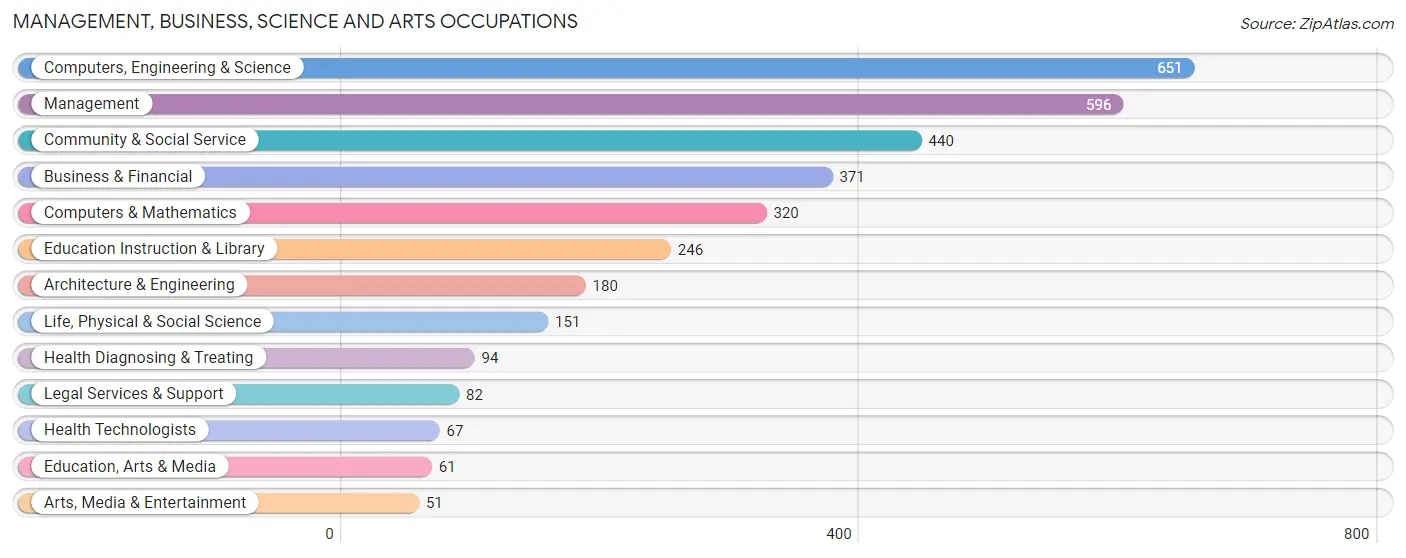
Management, Business, Science and Arts Occupations
The most common Management, Business, Science and Arts occupations in Green Knoll are Computers, Engineering & Science (651 | 19.2%), Management (596 | 17.6%), Community & Social Service (440 | 13.0%), Business & Financial (371 | 11.0%), and Computers & Mathematics (320 | 9.5%).
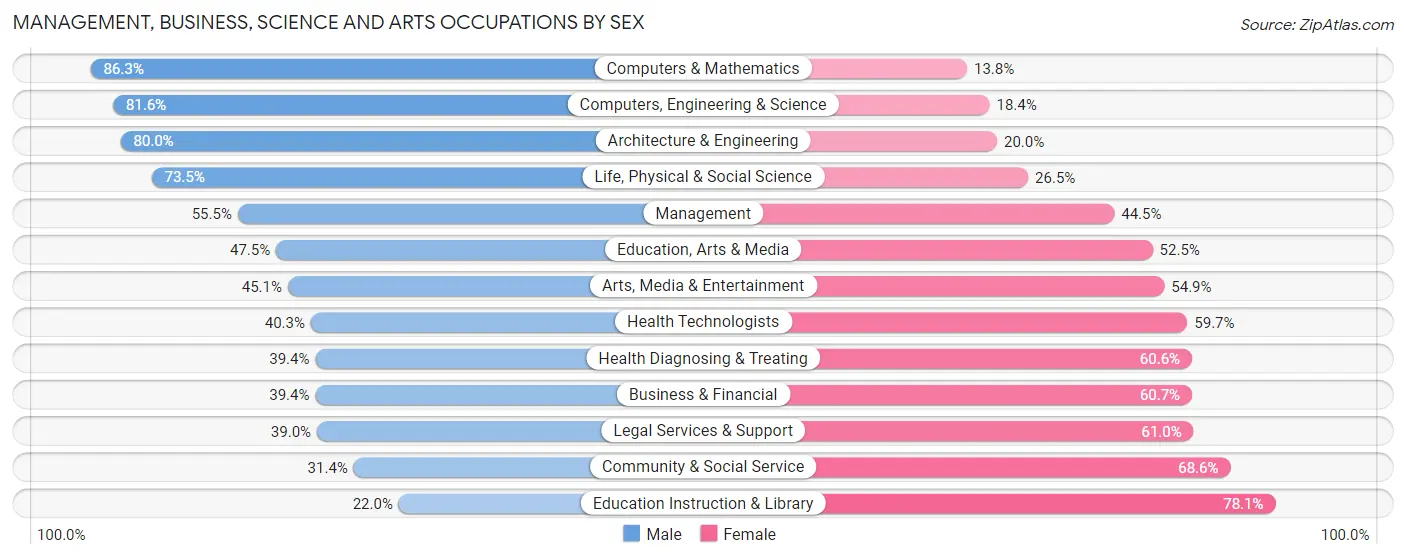
Management, Business, Science and Arts Occupations by Sex
Within the Management, Business, Science and Arts occupations in Green Knoll, the most male-oriented occupations are Computers & Mathematics (86.3%), Computers, Engineering & Science (81.6%), and Architecture & Engineering (80.0%), while the most female-oriented occupations are Education Instruction & Library (78.0%), Community & Social Service (68.6%), and Legal Services & Support (61.0%).
| Occupation | Male | Female |
| Management | 331 (55.5%) | 265 (44.5%) |
| Business & Financial | 146 (39.4%) | 225 (60.7%) |
| Computers, Engineering & Science | 531 (81.6%) | 120 (18.4%) |
| Computers & Mathematics | 276 (86.3%) | 44 (13.8%) |
| Architecture & Engineering | 144 (80.0%) | 36 (20.0%) |
| Life, Physical & Social Science | 111 (73.5%) | 40 (26.5%) |
| Community & Social Service | 138 (31.4%) | 302 (68.6%) |
| Education, Arts & Media | 29 (47.5%) | 32 (52.5%) |
| Legal Services & Support | 32 (39.0%) | 50 (61.0%) |
| Education Instruction & Library | 54 (22.0%) | 192 (78.0%) |
| Arts, Media & Entertainment | 23 (45.1%) | 28 (54.9%) |
| Health Diagnosing & Treating | 37 (39.4%) | 57 (60.6%) |
| Health Technologists | 27 (40.3%) | 40 (59.7%) |
| Total (Category) | 1,183 (55.0%) | 969 (45.0%) |
| Total (Overall) | 1,781 (52.6%) | 1,607 (47.4%) |
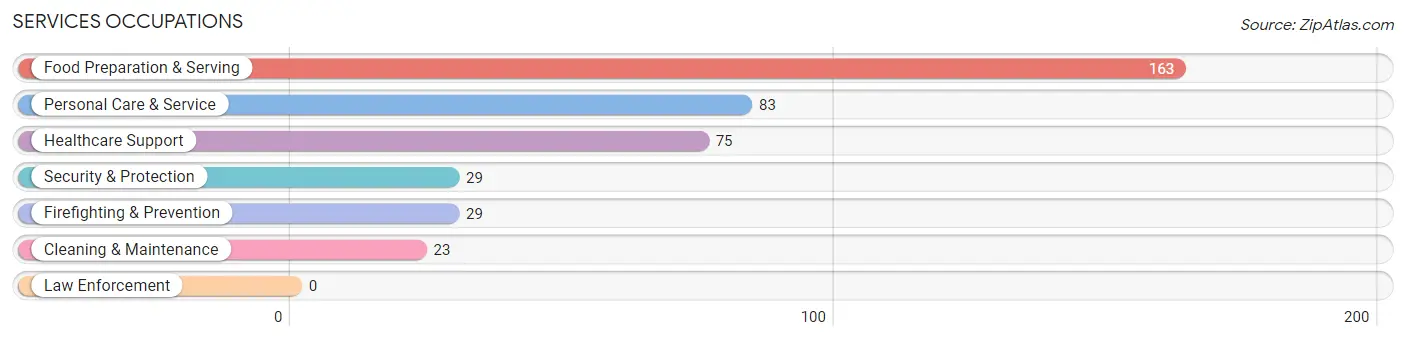
Services Occupations
The most common Services occupations in Green Knoll are Food Preparation & Serving (163 | 4.8%), Personal Care & Service (83 | 2.5%), Healthcare Support (75 | 2.2%), Security & Protection (29 | 0.9%), and Firefighting & Prevention (29 | 0.9%).
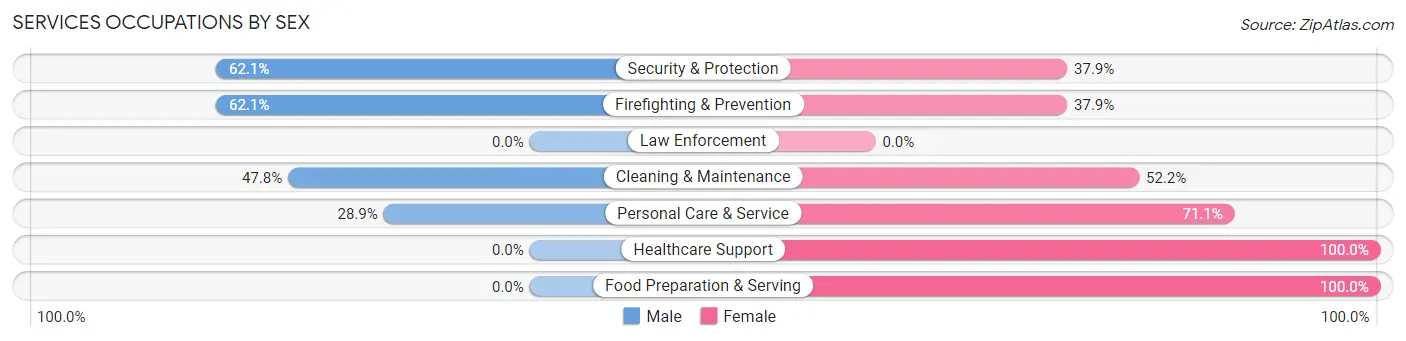
Services Occupations by Sex
Within the Services occupations in Green Knoll, the most male-oriented occupations are Security & Protection (62.1%), Firefighting & Prevention (62.1%), and Cleaning & Maintenance (47.8%), while the most female-oriented occupations are Healthcare Support (100.0%), Food Preparation & Serving (100.0%), and Personal Care & Service (71.1%).
| Occupation | Male | Female |
| Healthcare Support | 0 (0.0%) | 75 (100.0%) |
| Security & Protection | 18 (62.1%) | 11 (37.9%) |
| Firefighting & Prevention | 18 (62.1%) | 11 (37.9%) |
| Law Enforcement | 0 (0.0%) | 0 (0.0%) |
| Food Preparation & Serving | 0 (0.0%) | 163 (100.0%) |
| Cleaning & Maintenance | 11 (47.8%) | 12 (52.2%) |
| Personal Care & Service | 24 (28.9%) | 59 (71.1%) |
| Total (Category) | 53 (14.2%) | 320 (85.8%) |
| Total (Overall) | 1,781 (52.6%) | 1,607 (47.4%) |
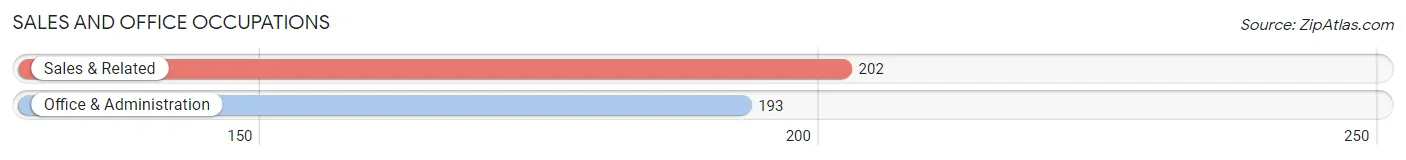
Sales and Office Occupations
The most common Sales and Office occupations in Green Knoll are Sales & Related (202 | 6.0%), and Office & Administration (193 | 5.7%).
Sales and Office Occupations by Sex
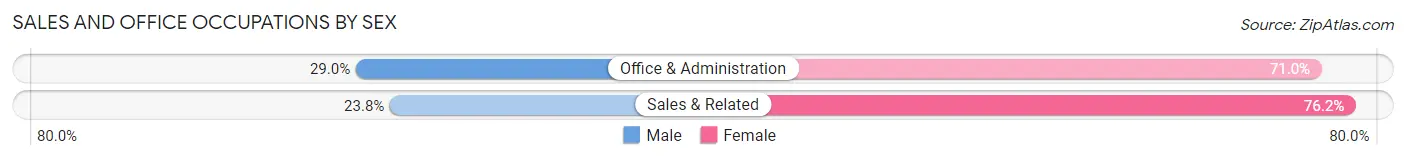
| Occupation | Male | Female |
| Sales & Related | 48 (23.8%) | 154 (76.2%) |
| Office & Administration | 56 (29.0%) | 137 (71.0%) |
| Total (Category) | 104 (26.3%) | 291 (73.7%) |
| Total (Overall) | 1,781 (52.6%) | 1,607 (47.4%) |
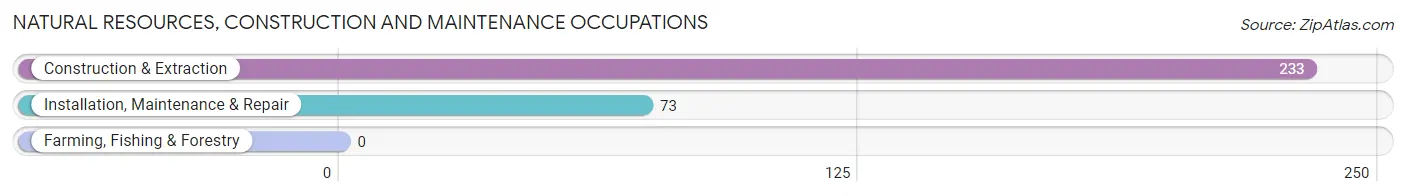
Natural Resources, Construction and Maintenance Occupations
The most common Natural Resources, Construction and Maintenance occupations in Green Knoll are Construction & Extraction (233 | 6.9%), and Installation, Maintenance & Repair (73 | 2.1%).
Natural Resources, Construction and Maintenance Occupations by Sex
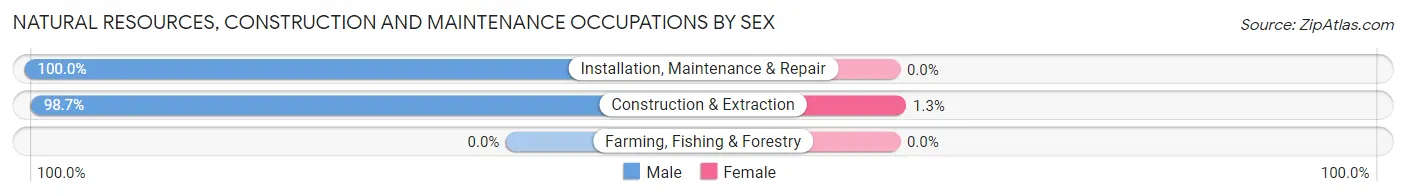
| Occupation | Male | Female |
| Farming, Fishing & Forestry | 0 (0.0%) | 0 (0.0%) |
| Construction & Extraction | 230 (98.7%) | 3 (1.3%) |
| Installation, Maintenance & Repair | 73 (100.0%) | 0 (0.0%) |
| Total (Category) | 303 (99.0%) | 3 (1.0%) |
| Total (Overall) | 1,781 (52.6%) | 1,607 (47.4%) |
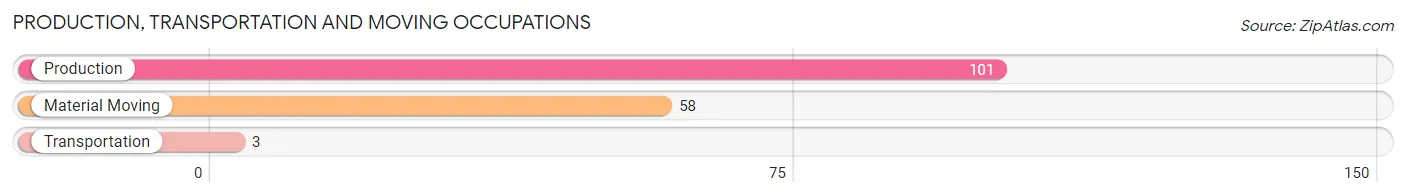
Production, Transportation and Moving Occupations
The most common Production, Transportation and Moving occupations in Green Knoll are Production (101 | 3.0%), Material Moving (58 | 1.7%), and Transportation (3 | 0.1%).
Production, Transportation and Moving Occupations by Sex
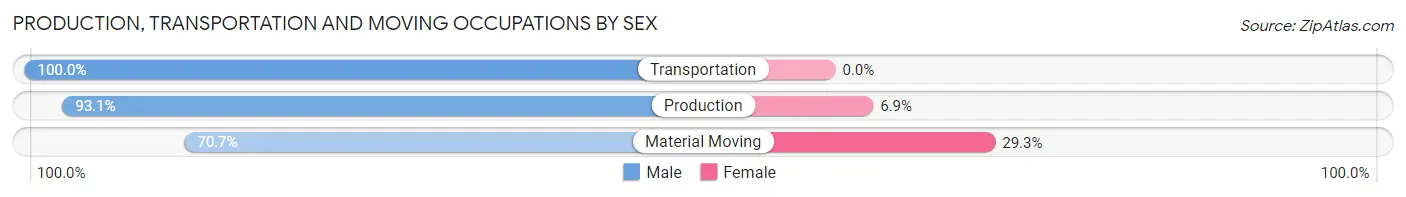
| Occupation | Male | Female |
| Production | 94 (93.1%) | 7 (6.9%) |
| Transportation | 3 (100.0%) | 0 (0.0%) |
| Material Moving | 41 (70.7%) | 17 (29.3%) |
| Total (Category) | 138 (85.2%) | 24 (14.8%) |
| Total (Overall) | 1,781 (52.6%) | 1,607 (47.4%) |
Employment Industries by Sex in Green Knoll
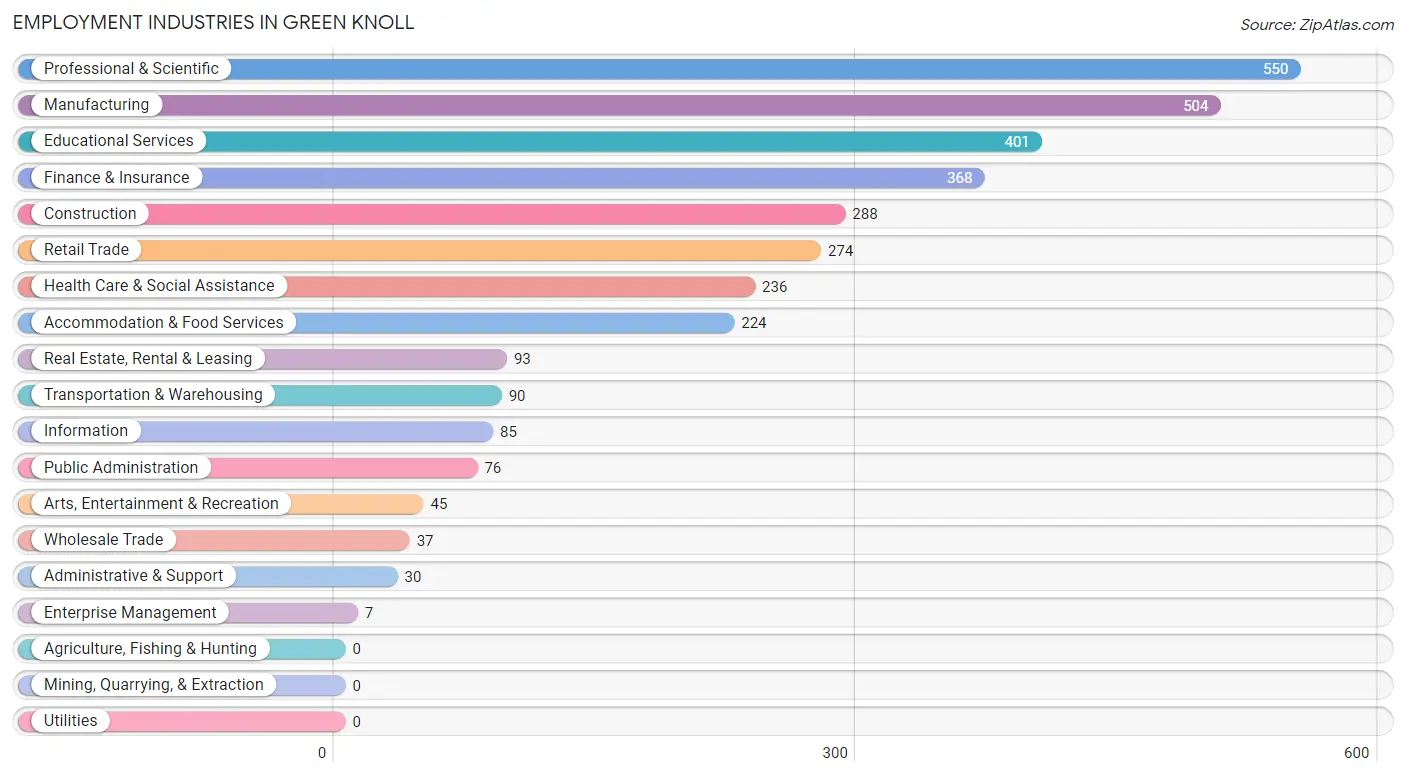
Employment Industries in Green Knoll
The major employment industries in Green Knoll include Professional & Scientific (550 | 16.2%), Manufacturing (504 | 14.9%), Educational Services (401 | 11.8%), Finance & Insurance (368 | 10.9%), and Construction (288 | 8.5%).
Employment Industries by Sex in Green Knoll
The Green Knoll industries that see more men than women are Enterprise Management (100.0%), Administrative & Support (100.0%), and Construction (96.9%), whereas the industries that tend to have a higher number of women are Wholesale Trade (100.0%), Arts, Entertainment & Recreation (95.6%), and Accommodation & Food Services (93.3%).
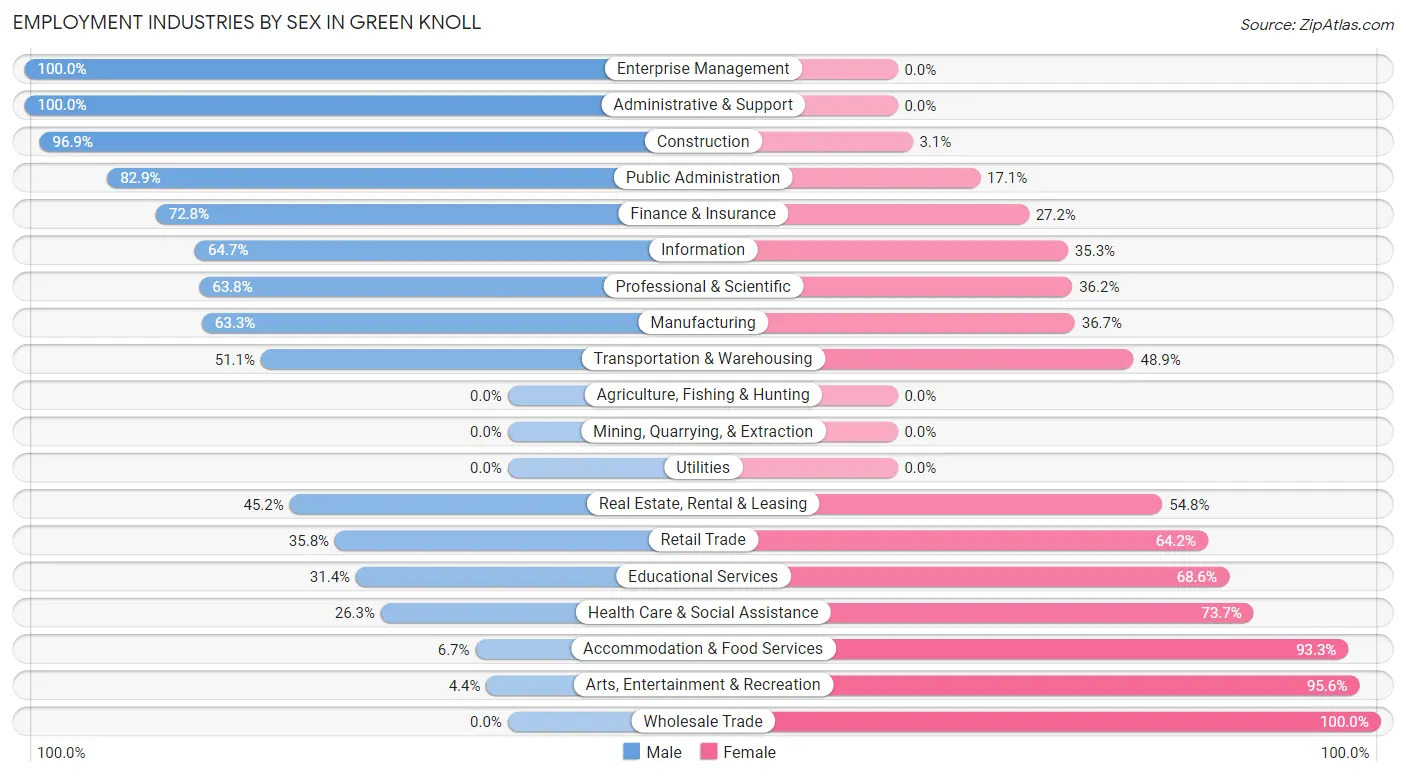
| Industry | Male | Female |
| Agriculture, Fishing & Hunting | 0 (0.0%) | 0 (0.0%) |
| Mining, Quarrying, & Extraction | 0 (0.0%) | 0 (0.0%) |
| Construction | 279 (96.9%) | 9 (3.1%) |
| Manufacturing | 319 (63.3%) | 185 (36.7%) |
| Wholesale Trade | 0 (0.0%) | 37 (100.0%) |
| Retail Trade | 98 (35.8%) | 176 (64.2%) |
| Transportation & Warehousing | 46 (51.1%) | 44 (48.9%) |
| Utilities | 0 (0.0%) | 0 (0.0%) |
| Information | 55 (64.7%) | 30 (35.3%) |
| Finance & Insurance | 268 (72.8%) | 100 (27.2%) |
| Real Estate, Rental & Leasing | 42 (45.2%) | 51 (54.8%) |
| Professional & Scientific | 351 (63.8%) | 199 (36.2%) |
| Enterprise Management | 7 (100.0%) | 0 (0.0%) |
| Administrative & Support | 30 (100.0%) | 0 (0.0%) |
| Educational Services | 126 (31.4%) | 275 (68.6%) |
| Health Care & Social Assistance | 62 (26.3%) | 174 (73.7%) |
| Arts, Entertainment & Recreation | 2 (4.4%) | 43 (95.6%) |
| Accommodation & Food Services | 15 (6.7%) | 209 (93.3%) |
| Public Administration | 63 (82.9%) | 13 (17.1%) |
| Total | 1,781 (52.6%) | 1,607 (47.4%) |
Education in Green Knoll
School Enrollment in Green Knoll
The most common levels of schooling among the 1,454 students in Green Knoll are elementary school (355 | 24.4%), middle school (355 | 24.4%), and high school (323 | 22.2%).
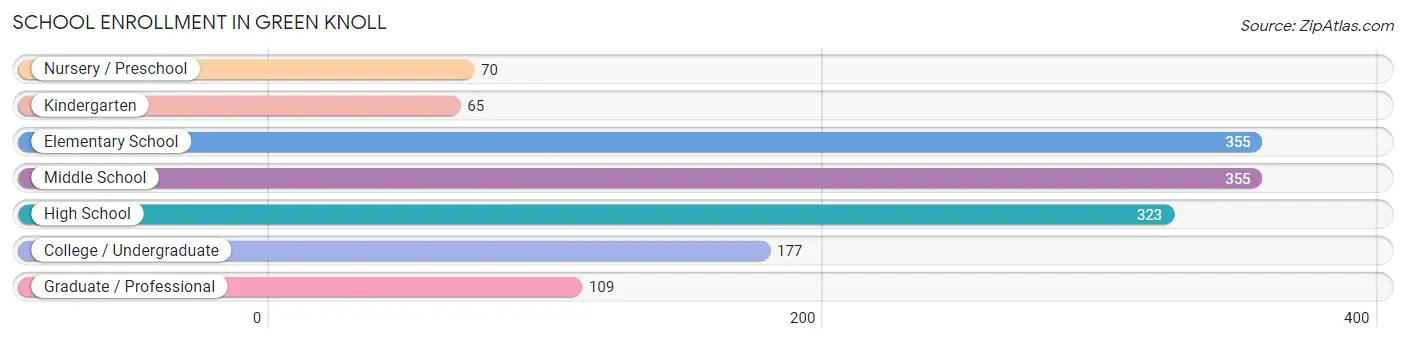
| School Level | # Students | % Students |
| Nursery / Preschool | 70 | 4.8% |
| Kindergarten | 65 | 4.5% |
| Elementary School | 355 | 24.4% |
| Middle School | 355 | 24.4% |
| High School | 323 | 22.2% |
| College / Undergraduate | 177 | 12.2% |
| Graduate / Professional | 109 | 7.5% |
| Total | 1,454 | 100.0% |
School Enrollment by Age by Funding Source in Green Knoll
Out of a total of 1,454 students who are enrolled in schools in Green Knoll, 164 (11.3%) attend a private institution, while the remaining 1,290 (88.7%) are enrolled in public schools. The age group of 25 to 34 year olds has the highest likelihood of being enrolled in private schools, with 46 (61.3% in the age bracket) enrolled. Conversely, the age group of 20 to 24 year olds has the lowest likelihood of being enrolled in a private school, with 113 (100.0% in the age bracket) attending a public institution.
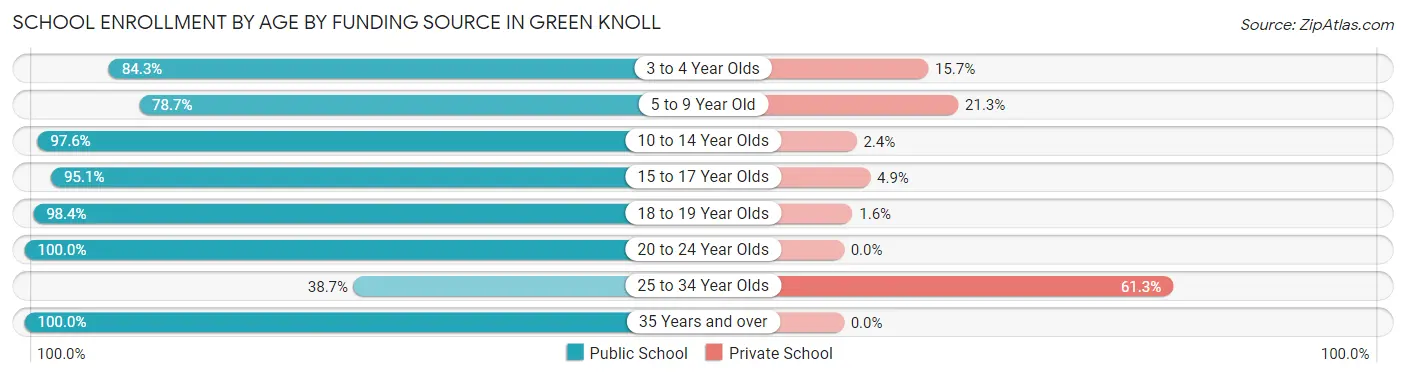
| Age Bracket | Public School | Private School |
| 3 to 4 Year Olds | 59 (84.3%) | 11 (15.7%) |
| 5 to 9 Year Old | 310 (78.7%) | 84 (21.3%) |
| 10 to 14 Year Olds | 408 (97.6%) | 10 (2.4%) |
| 15 to 17 Year Olds | 251 (95.1%) | 13 (4.9%) |
| 18 to 19 Year Olds | 61 (98.4%) | 1 (1.6%) |
| 20 to 24 Year Olds | 113 (100.0%) | 0 (0.0%) |
| 25 to 34 Year Olds | 29 (38.7%) | 46 (61.3%) |
| 35 Years and over | 58 (100.0%) | 0 (0.0%) |
| Total | 1,290 (88.7%) | 164 (11.3%) |
Educational Attainment by Field of Study in Green Knoll
Business (662 | 22.0%), engineering (392 | 13.0%), science & technology (266 | 8.8%), education (262 | 8.7%), and computers & mathematics (242 | 8.1%) are the most common fields of study among 3,005 individuals in Green Knoll who have obtained a bachelor's degree or higher.
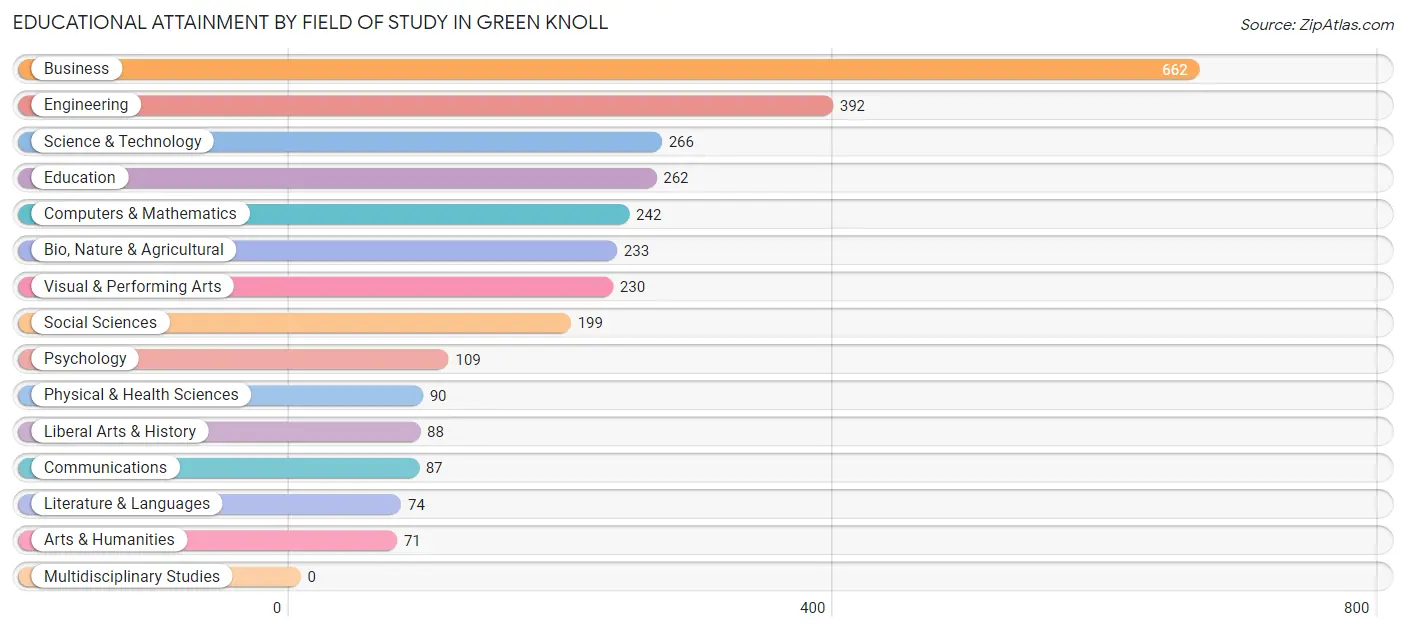
| Field of Study | # Graduates | % Graduates |
| Computers & Mathematics | 242 | 8.1% |
| Bio, Nature & Agricultural | 233 | 7.7% |
| Physical & Health Sciences | 90 | 3.0% |
| Psychology | 109 | 3.6% |
| Social Sciences | 199 | 6.6% |
| Engineering | 392 | 13.0% |
| Multidisciplinary Studies | 0 | 0.0% |
| Science & Technology | 266 | 8.8% |
| Business | 662 | 22.0% |
| Education | 262 | 8.7% |
| Literature & Languages | 74 | 2.5% |
| Liberal Arts & History | 88 | 2.9% |
| Visual & Performing Arts | 230 | 7.6% |
| Communications | 87 | 2.9% |
| Arts & Humanities | 71 | 2.4% |
| Total | 3,005 | 100.0% |
Transportation & Commute in Green Knoll
Vehicle Availability by Sex in Green Knoll
The most prevalent vehicle ownership categories in Green Knoll are males with 2 vehicles (723, accounting for 40.6%) and females with 2 vehicles (528, making up 46.6%).
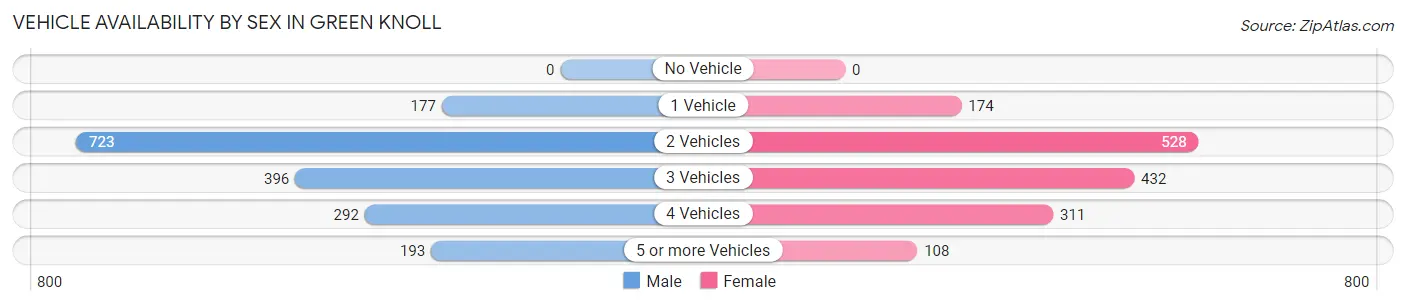
| Vehicles Available | Male | Female |
| No Vehicle | 0 (0.0%) | 0 (0.0%) |
| 1 Vehicle | 177 (9.9%) | 174 (11.2%) |
| 2 Vehicles | 723 (40.6%) | 528 (34.0%) |
| 3 Vehicles | 396 (22.2%) | 432 (27.8%) |
| 4 Vehicles | 292 (16.4%) | 311 (20.0%) |
| 5 or more Vehicles | 193 (10.8%) | 108 (7.0%) |
| Total | 1,781 (100.0%) | 1,553 (100.0%) |
Commute Time in Green Knoll
The most frequently occuring commute durations in Green Knoll are 10 to 14 minutes (520 commuters, 20.4%), 15 to 19 minutes (404 commuters, 15.8%), and 30 to 34 minutes (385 commuters, 15.1%).
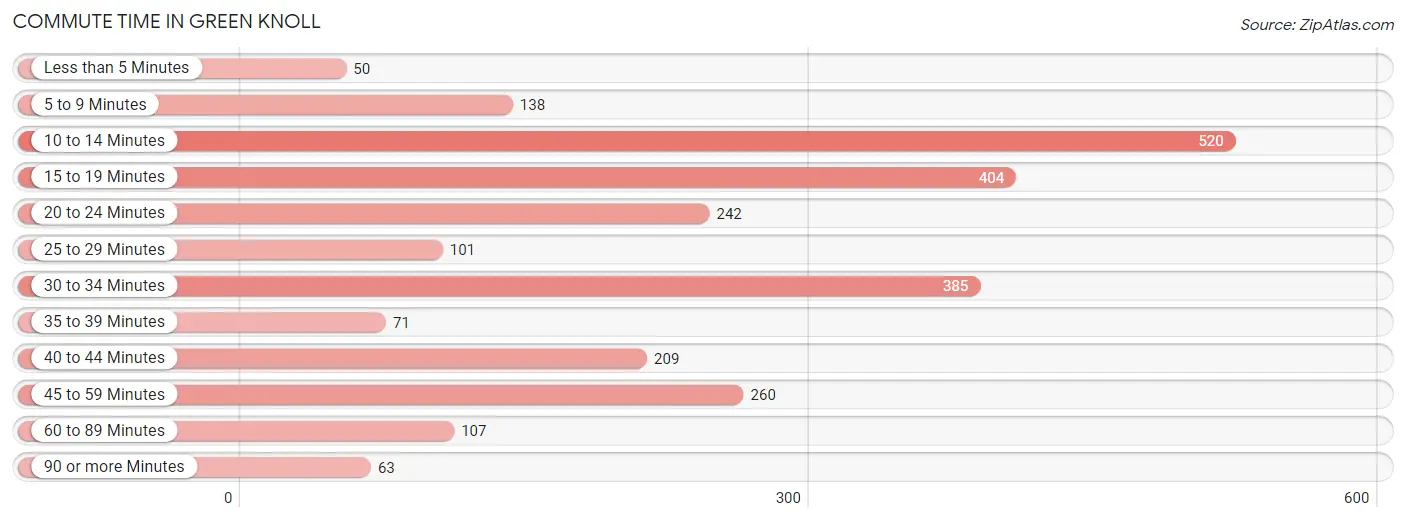
| Commute Time | # Commuters | % Commuters |
| Less than 5 Minutes | 50 | 2.0% |
| 5 to 9 Minutes | 138 | 5.4% |
| 10 to 14 Minutes | 520 | 20.4% |
| 15 to 19 Minutes | 404 | 15.8% |
| 20 to 24 Minutes | 242 | 9.5% |
| 25 to 29 Minutes | 101 | 4.0% |
| 30 to 34 Minutes | 385 | 15.1% |
| 35 to 39 Minutes | 71 | 2.8% |
| 40 to 44 Minutes | 209 | 8.2% |
| 45 to 59 Minutes | 260 | 10.2% |
| 60 to 89 Minutes | 107 | 4.2% |
| 90 or more Minutes | 63 | 2.5% |
Commute Time by Sex in Green Knoll
The most common commute times in Green Knoll are 15 to 19 minutes (279 commuters, 19.6%) for males and 10 to 14 minutes (360 commuters, 32.0%) for females.
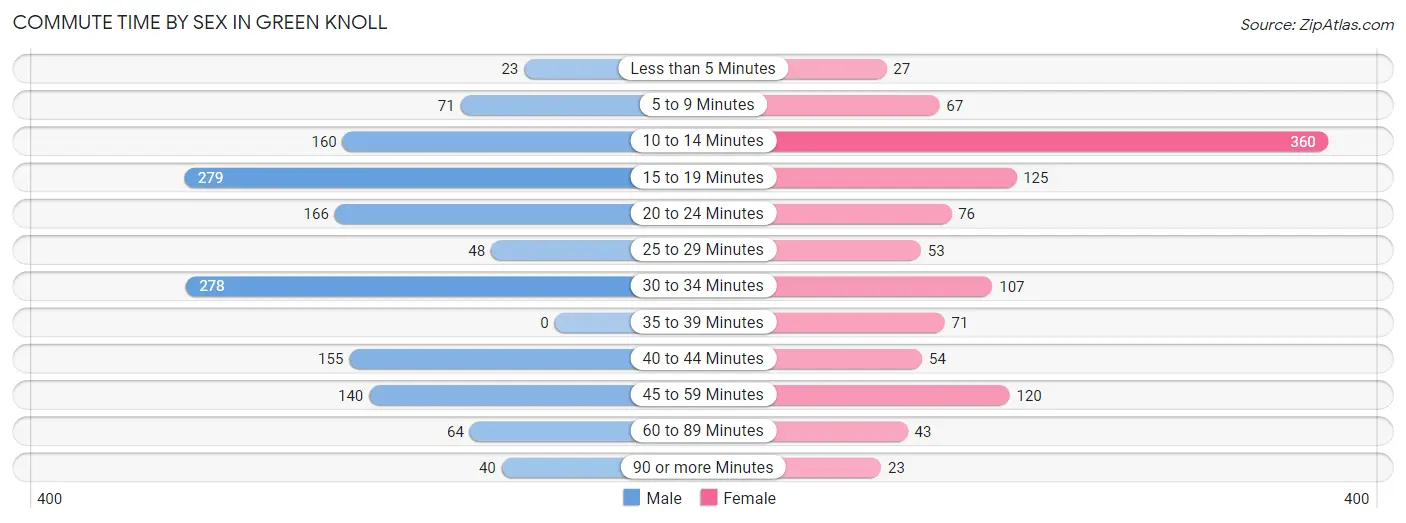
| Commute Time | Male | Female |
| Less than 5 Minutes | 23 (1.6%) | 27 (2.4%) |
| 5 to 9 Minutes | 71 (5.0%) | 67 (5.9%) |
| 10 to 14 Minutes | 160 (11.2%) | 360 (32.0%) |
| 15 to 19 Minutes | 279 (19.6%) | 125 (11.1%) |
| 20 to 24 Minutes | 166 (11.7%) | 76 (6.8%) |
| 25 to 29 Minutes | 48 (3.4%) | 53 (4.7%) |
| 30 to 34 Minutes | 278 (19.5%) | 107 (9.5%) |
| 35 to 39 Minutes | 0 (0.0%) | 71 (6.3%) |
| 40 to 44 Minutes | 155 (10.9%) | 54 (4.8%) |
| 45 to 59 Minutes | 140 (9.8%) | 120 (10.7%) |
| 60 to 89 Minutes | 64 (4.5%) | 43 (3.8%) |
| 90 or more Minutes | 40 (2.8%) | 23 (2.0%) |
Time of Departure to Work by Sex in Green Knoll
The most frequent times of departure to work in Green Knoll are 7:00 AM to 7:29 AM (275, 19.3%) for males and 8:00 AM to 8:29 AM (225, 20.0%) for females.
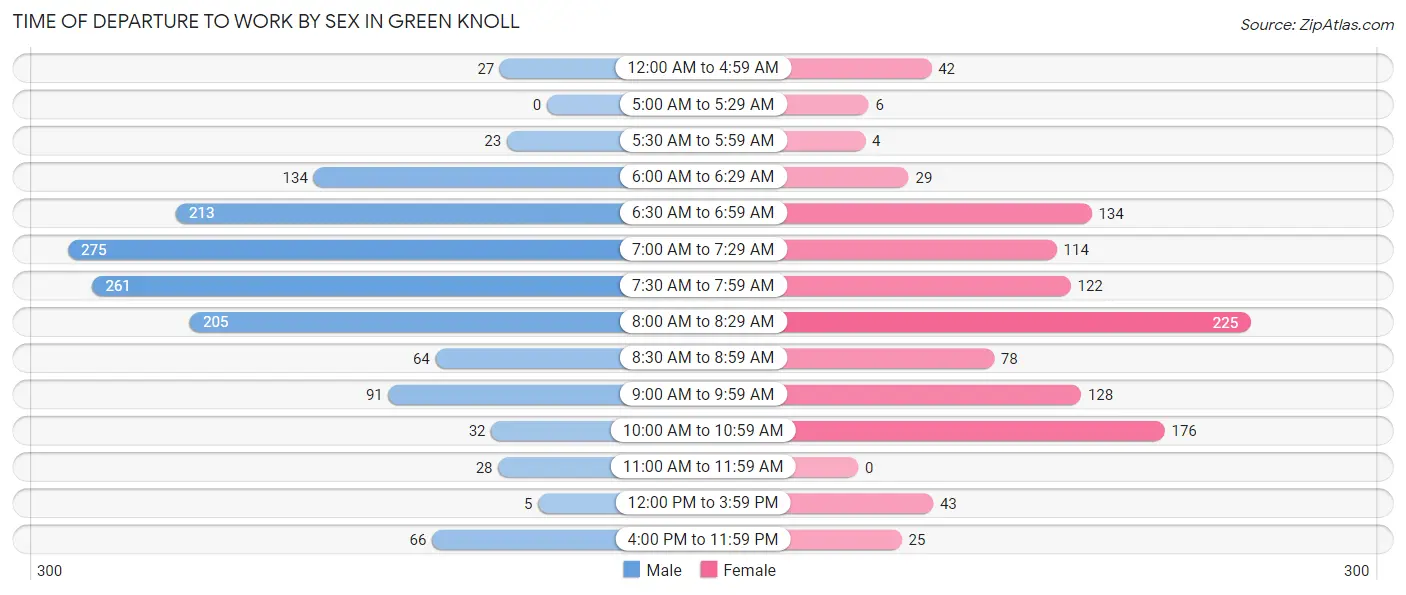
| Time of Departure | Male | Female |
| 12:00 AM to 4:59 AM | 27 (1.9%) | 42 (3.7%) |
| 5:00 AM to 5:29 AM | 0 (0.0%) | 6 (0.5%) |
| 5:30 AM to 5:59 AM | 23 (1.6%) | 4 (0.4%) |
| 6:00 AM to 6:29 AM | 134 (9.4%) | 29 (2.6%) |
| 6:30 AM to 6:59 AM | 213 (15.0%) | 134 (11.9%) |
| 7:00 AM to 7:29 AM | 275 (19.3%) | 114 (10.1%) |
| 7:30 AM to 7:59 AM | 261 (18.3%) | 122 (10.8%) |
| 8:00 AM to 8:29 AM | 205 (14.4%) | 225 (20.0%) |
| 8:30 AM to 8:59 AM | 64 (4.5%) | 78 (6.9%) |
| 9:00 AM to 9:59 AM | 91 (6.4%) | 128 (11.4%) |
| 10:00 AM to 10:59 AM | 32 (2.2%) | 176 (15.6%) |
| 11:00 AM to 11:59 AM | 28 (2.0%) | 0 (0.0%) |
| 12:00 PM to 3:59 PM | 5 (0.4%) | 43 (3.8%) |
| 4:00 PM to 11:59 PM | 66 (4.6%) | 25 (2.2%) |
| Total | 1,424 (100.0%) | 1,126 (100.0%) |
Housing Occupancy in Green Knoll
Occupancy by Ownership in Green Knoll
Of the total 2,358 dwellings in Green Knoll, owner-occupied units account for 1,769 (75.0%), while renter-occupied units make up 589 (25.0%).
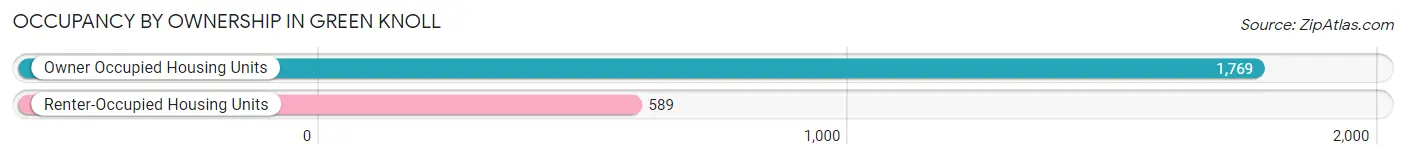
| Occupancy | # Housing Units | % Housing Units |
| Owner Occupied Housing Units | 1,769 | 75.0% |
| Renter-Occupied Housing Units | 589 | 25.0% |
| Total Occupied Housing Units | 2,358 | 100.0% |
Occupancy by Household Size in Green Knoll
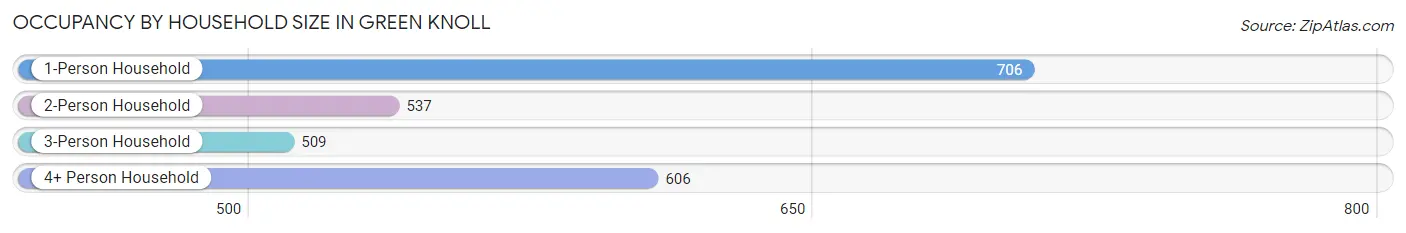
| Household Size | # Housing Units | % Housing Units |
| 1-Person Household | 706 | 29.9% |
| 2-Person Household | 537 | 22.8% |
| 3-Person Household | 509 | 21.6% |
| 4+ Person Household | 606 | 25.7% |
| Total Housing Units | 2,358 | 100.0% |
Occupancy by Ownership by Household Size in Green Knoll
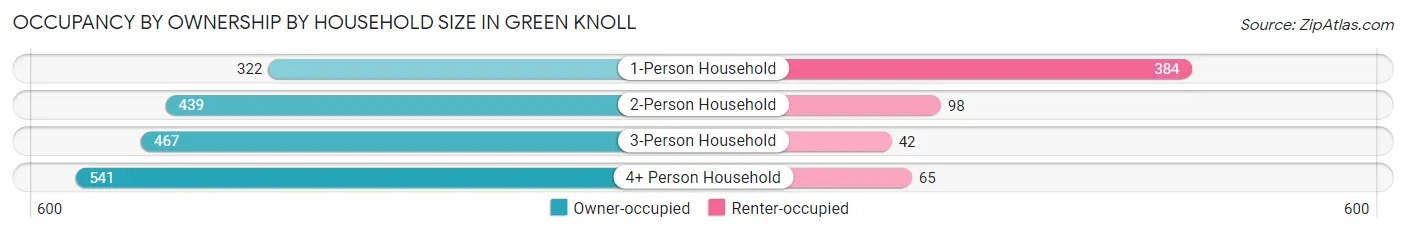
| Household Size | Owner-occupied | Renter-occupied |
| 1-Person Household | 322 (45.6%) | 384 (54.4%) |
| 2-Person Household | 439 (81.8%) | 98 (18.2%) |
| 3-Person Household | 467 (91.7%) | 42 (8.3%) |
| 4+ Person Household | 541 (89.3%) | 65 (10.7%) |
| Total Housing Units | 1,769 (75.0%) | 589 (25.0%) |
Occupancy by Educational Attainment in Green Knoll
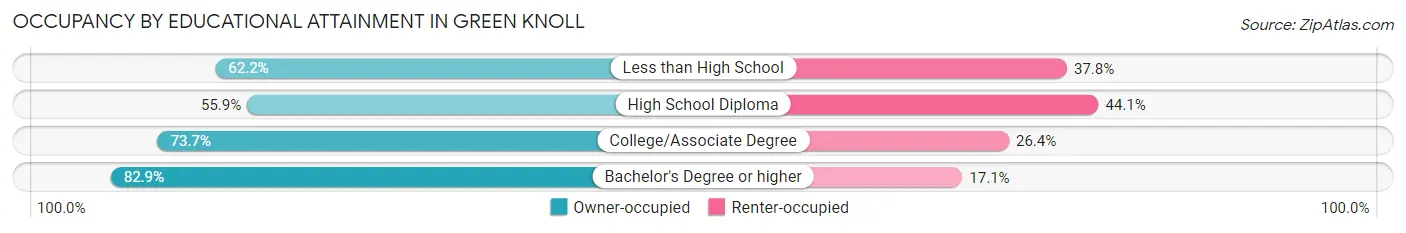
| Household Size | Owner-occupied | Renter-occupied |
| Less than High School | 46 (62.2%) | 28 (37.8%) |
| High School Diploma | 289 (55.9%) | 228 (44.1%) |
| College/Associate Degree | 246 (73.7%) | 88 (26.4%) |
| Bachelor's Degree or higher | 1,188 (82.9%) | 245 (17.1%) |
Occupancy by Age of Householder in Green Knoll
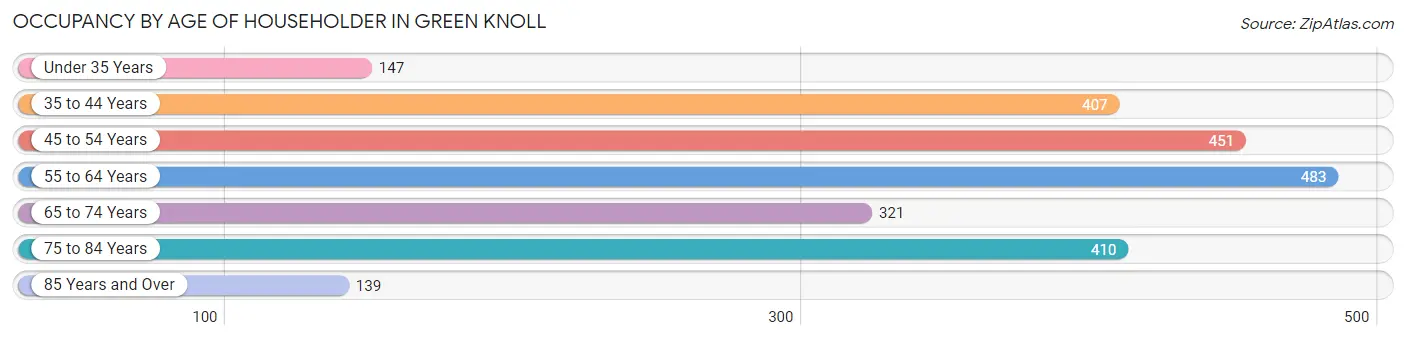
| Age Bracket | # Households | % Households |
| Under 35 Years | 147 | 6.2% |
| 35 to 44 Years | 407 | 17.3% |
| 45 to 54 Years | 451 | 19.1% |
| 55 to 64 Years | 483 | 20.5% |
| 65 to 74 Years | 321 | 13.6% |
| 75 to 84 Years | 410 | 17.4% |
| 85 Years and Over | 139 | 5.9% |
| Total | 2,358 | 100.0% |
Housing Finances in Green Knoll
Median Income by Occupancy in Green Knoll
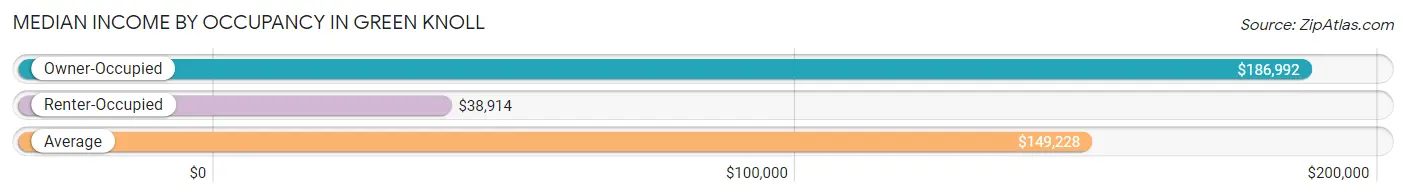
| Occupancy Type | # Households | Median Income |
| Owner-Occupied | 1,769 (75.0%) | $186,992 |
| Renter-Occupied | 589 (25.0%) | $38,914 |
| Average | 2,358 (100.0%) | $149,228 |
Occupancy by Householder Income Bracket in Green Knoll
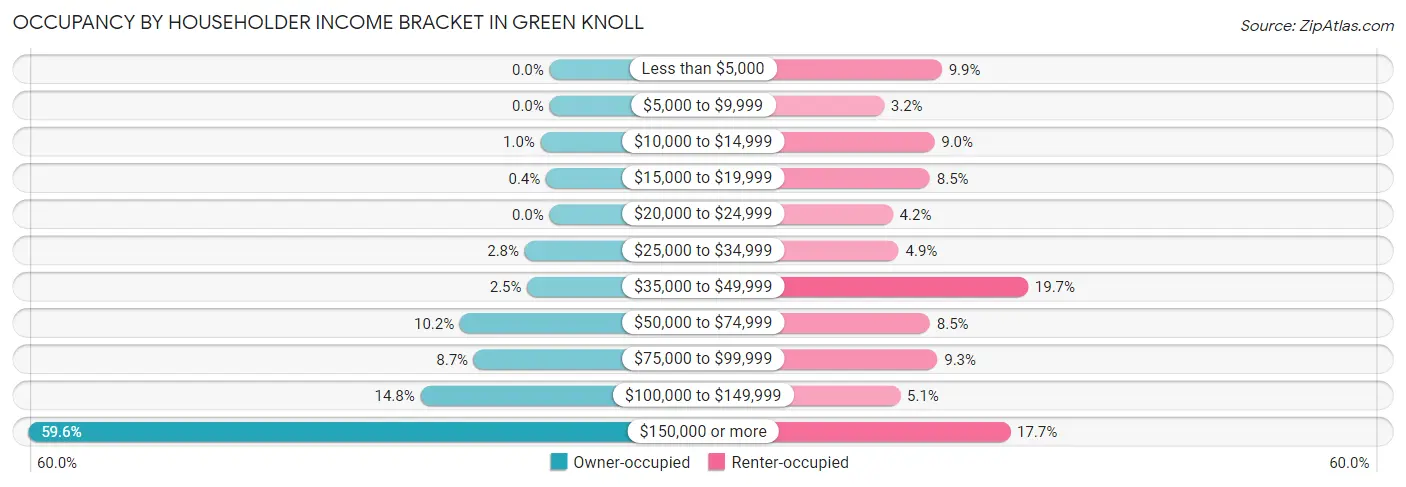
| Income Bracket | Owner-occupied | Renter-occupied |
| Less than $5,000 | 0 (0.0%) | 58 (9.9%) |
| $5,000 to $9,999 | 0 (0.0%) | 19 (3.2%) |
| $10,000 to $14,999 | 18 (1.0%) | 53 (9.0%) |
| $15,000 to $19,999 | 7 (0.4%) | 50 (8.5%) |
| $20,000 to $24,999 | 0 (0.0%) | 25 (4.2%) |
| $25,000 to $34,999 | 50 (2.8%) | 29 (4.9%) |
| $35,000 to $49,999 | 45 (2.5%) | 116 (19.7%) |
| $50,000 to $74,999 | 181 (10.2%) | 50 (8.5%) |
| $75,000 to $99,999 | 153 (8.6%) | 55 (9.3%) |
| $100,000 to $149,999 | 261 (14.7%) | 30 (5.1%) |
| $150,000 or more | 1,054 (59.6%) | 104 (17.7%) |
| Total | 1,769 (100.0%) | 589 (100.0%) |
Monthly Housing Cost Tiers in Green Knoll
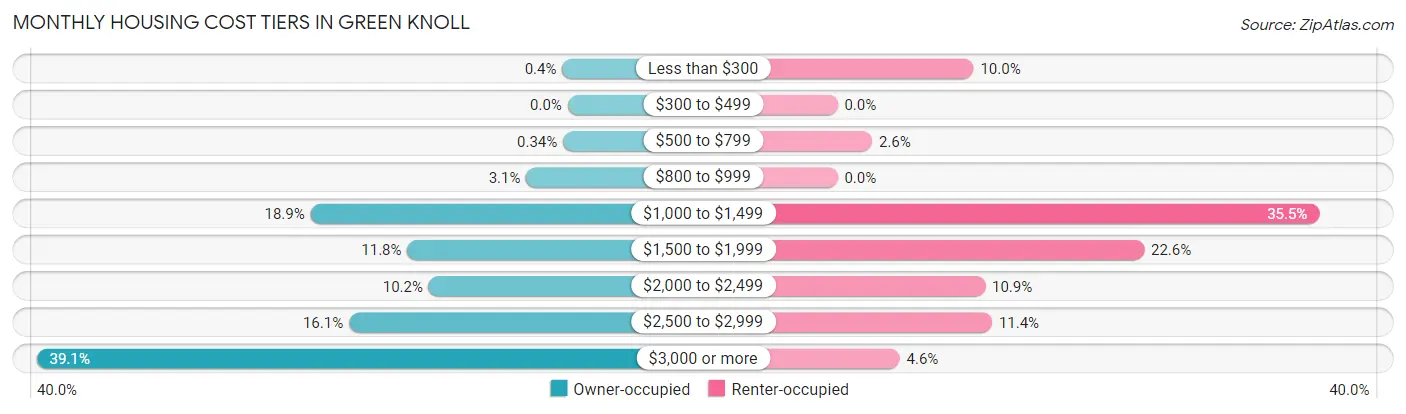
| Monthly Cost | Owner-occupied | Renter-occupied |
| Less than $300 | 7 (0.4%) | 59 (10.0%) |
| $300 to $499 | 0 (0.0%) | 0 (0.0%) |
| $500 to $799 | 6 (0.3%) | 15 (2.5%) |
| $800 to $999 | 54 (3.0%) | 0 (0.0%) |
| $1,000 to $1,499 | 335 (18.9%) | 209 (35.5%) |
| $1,500 to $1,999 | 209 (11.8%) | 133 (22.6%) |
| $2,000 to $2,499 | 181 (10.2%) | 64 (10.9%) |
| $2,500 to $2,999 | 285 (16.1%) | 67 (11.4%) |
| $3,000 or more | 692 (39.1%) | 27 (4.6%) |
| Total | 1,769 (100.0%) | 589 (100.0%) |
Physical Housing Characteristics in Green Knoll
Housing Structures in Green Knoll
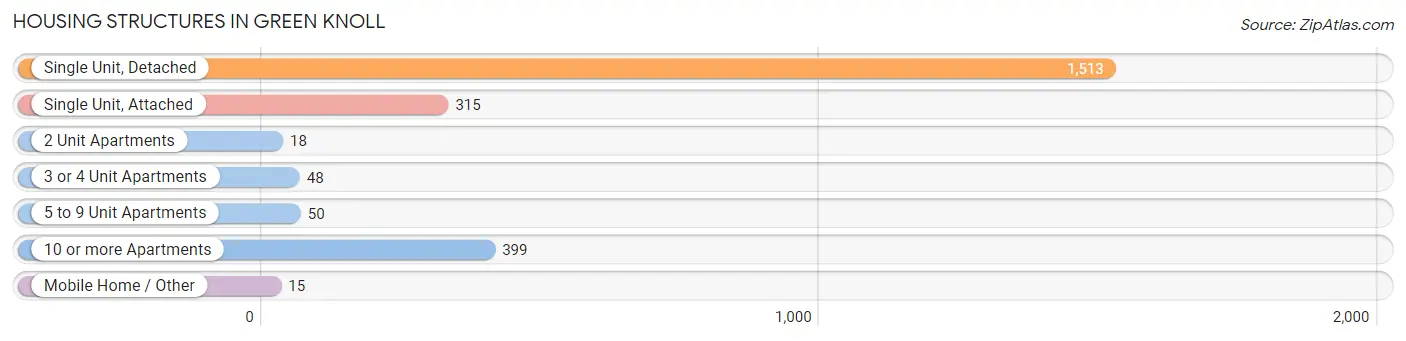
| Structure Type | # Housing Units | % Housing Units |
| Single Unit, Detached | 1,513 | 64.2% |
| Single Unit, Attached | 315 | 13.4% |
| 2 Unit Apartments | 18 | 0.8% |
| 3 or 4 Unit Apartments | 48 | 2.0% |
| 5 to 9 Unit Apartments | 50 | 2.1% |
| 10 or more Apartments | 399 | 16.9% |
| Mobile Home / Other | 15 | 0.6% |
| Total | 2,358 | 100.0% |
Housing Structures by Occupancy in Green Knoll
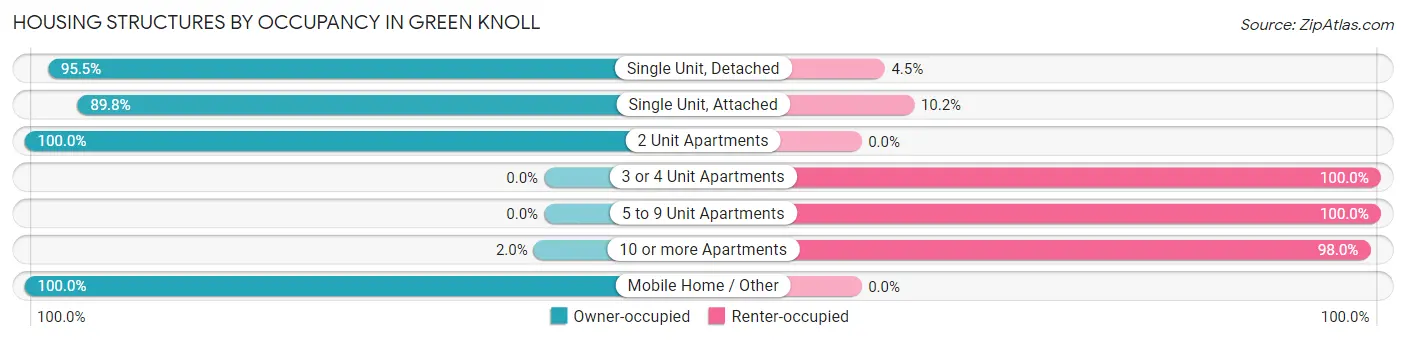
| Structure Type | Owner-occupied | Renter-occupied |
| Single Unit, Detached | 1,445 (95.5%) | 68 (4.5%) |
| Single Unit, Attached | 283 (89.8%) | 32 (10.2%) |
| 2 Unit Apartments | 18 (100.0%) | 0 (0.0%) |
| 3 or 4 Unit Apartments | 0 (0.0%) | 48 (100.0%) |
| 5 to 9 Unit Apartments | 0 (0.0%) | 50 (100.0%) |
| 10 or more Apartments | 8 (2.0%) | 391 (98.0%) |
| Mobile Home / Other | 15 (100.0%) | 0 (0.0%) |
| Total | 1,769 (75.0%) | 589 (25.0%) |
Housing Structures by Number of Rooms in Green Knoll
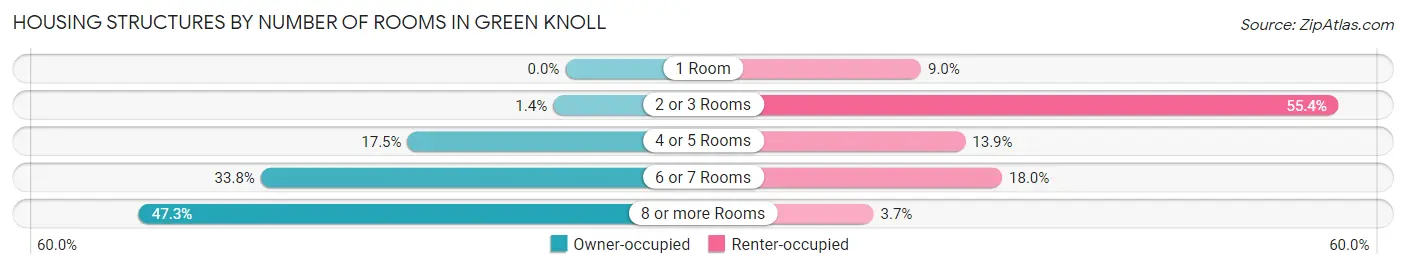
| Number of Rooms | Owner-occupied | Renter-occupied |
| 1 Room | 0 (0.0%) | 53 (9.0%) |
| 2 or 3 Rooms | 24 (1.4%) | 326 (55.3%) |
| 4 or 5 Rooms | 310 (17.5%) | 82 (13.9%) |
| 6 or 7 Rooms | 598 (33.8%) | 106 (18.0%) |
| 8 or more Rooms | 837 (47.3%) | 22 (3.7%) |
| Total | 1,769 (100.0%) | 589 (100.0%) |
Housing Structure by Heating Type in Green Knoll
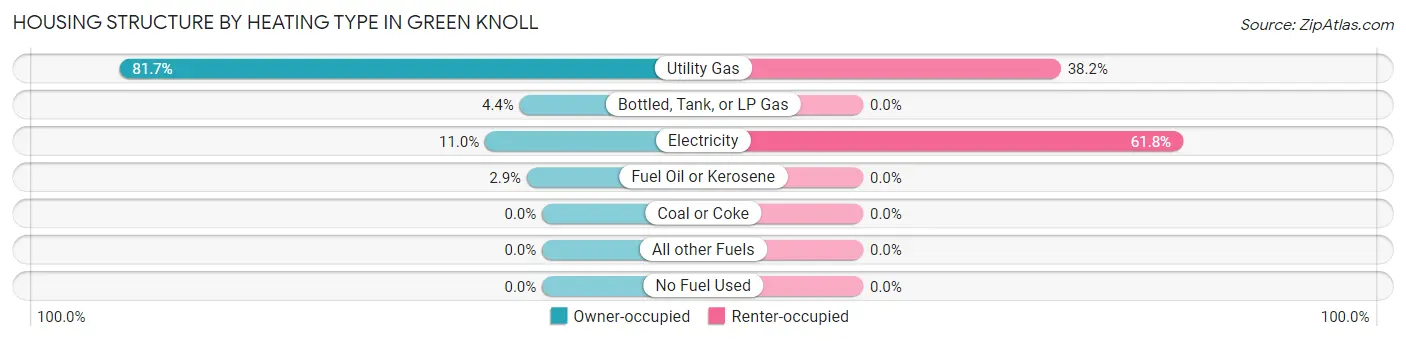
| Heating Type | Owner-occupied | Renter-occupied |
| Utility Gas | 1,445 (81.7%) | 225 (38.2%) |
| Bottled, Tank, or LP Gas | 77 (4.3%) | 0 (0.0%) |
| Electricity | 195 (11.0%) | 364 (61.8%) |
| Fuel Oil or Kerosene | 52 (2.9%) | 0 (0.0%) |
| Coal or Coke | 0 (0.0%) | 0 (0.0%) |
| All other Fuels | 0 (0.0%) | 0 (0.0%) |
| No Fuel Used | 0 (0.0%) | 0 (0.0%) |
| Total | 1,769 (100.0%) | 589 (100.0%) |
Household Vehicle Usage in Green Knoll
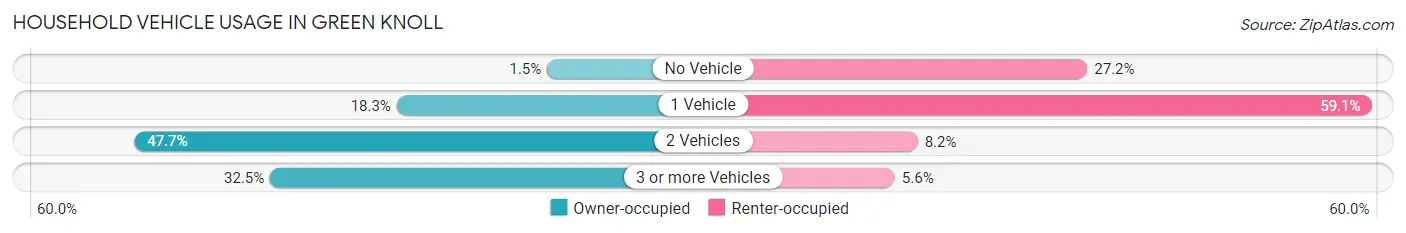
| Vehicles per Household | Owner-occupied | Renter-occupied |
| No Vehicle | 26 (1.5%) | 160 (27.2%) |
| 1 Vehicle | 324 (18.3%) | 348 (59.1%) |
| 2 Vehicles | 844 (47.7%) | 48 (8.2%) |
| 3 or more Vehicles | 575 (32.5%) | 33 (5.6%) |
| Total | 1,769 (100.0%) | 589 (100.0%) |
Real Estate & Mortgages in Green Knoll
Real Estate and Mortgage Overview in Green Knoll
| Characteristic | Without Mortgage | With Mortgage |
| Housing Units | 568 | 1,201 |
| Median Property Value | $515,100 | $549,300 |
| Median Household Income | $136,731 | $796 |
| Monthly Housing Costs | $1,312 | $692 |
| Real Estate Taxes | $10,001 | $8 |
Property Value by Mortgage Status in Green Knoll
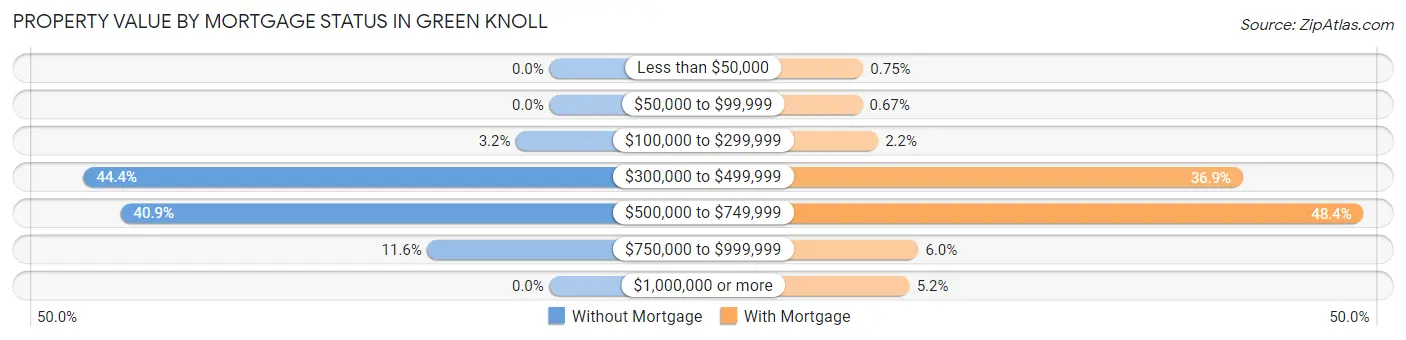
| Property Value | Without Mortgage | With Mortgage |
| Less than $50,000 | 0 (0.0%) | 9 (0.7%) |
| $50,000 to $99,999 | 0 (0.0%) | 8 (0.7%) |
| $100,000 to $299,999 | 18 (3.2%) | 26 (2.2%) |
| $300,000 to $499,999 | 252 (44.4%) | 443 (36.9%) |
| $500,000 to $749,999 | 232 (40.8%) | 581 (48.4%) |
| $750,000 to $999,999 | 66 (11.6%) | 72 (6.0%) |
| $1,000,000 or more | 0 (0.0%) | 62 (5.2%) |
| Total | 568 (100.0%) | 1,201 (100.0%) |
Household Income by Mortgage Status in Green Knoll
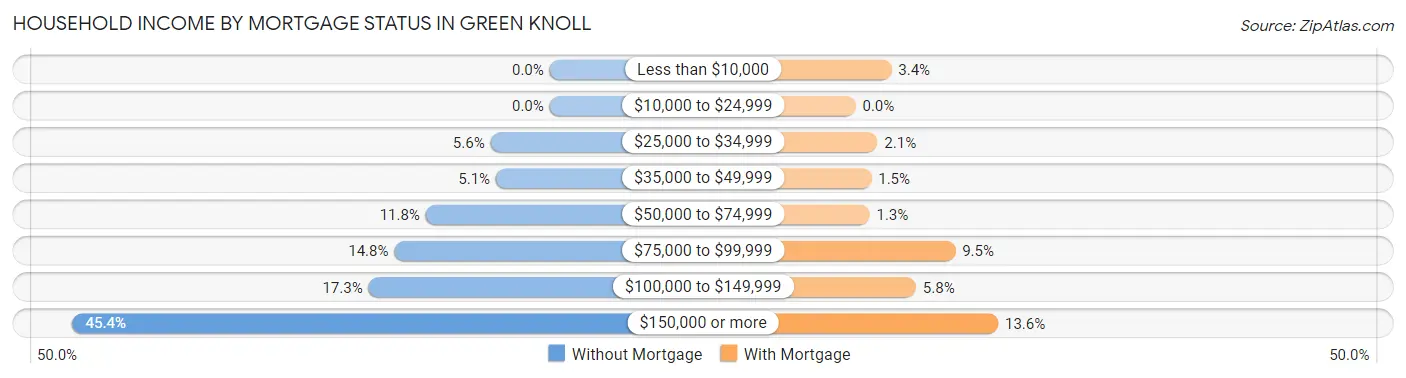
| Household Income | Without Mortgage | With Mortgage |
| Less than $10,000 | 0 (0.0%) | 41 (3.4%) |
| $10,000 to $24,999 | 0 (0.0%) | 0 (0.0%) |
| $25,000 to $34,999 | 32 (5.6%) | 25 (2.1%) |
| $35,000 to $49,999 | 29 (5.1%) | 18 (1.5%) |
| $50,000 to $74,999 | 67 (11.8%) | 16 (1.3%) |
| $75,000 to $99,999 | 84 (14.8%) | 114 (9.5%) |
| $100,000 to $149,999 | 98 (17.2%) | 69 (5.8%) |
| $150,000 or more | 258 (45.4%) | 163 (13.6%) |
| Total | 568 (100.0%) | 1,201 (100.0%) |
Property Value to Household Income Ratio in Green Knoll
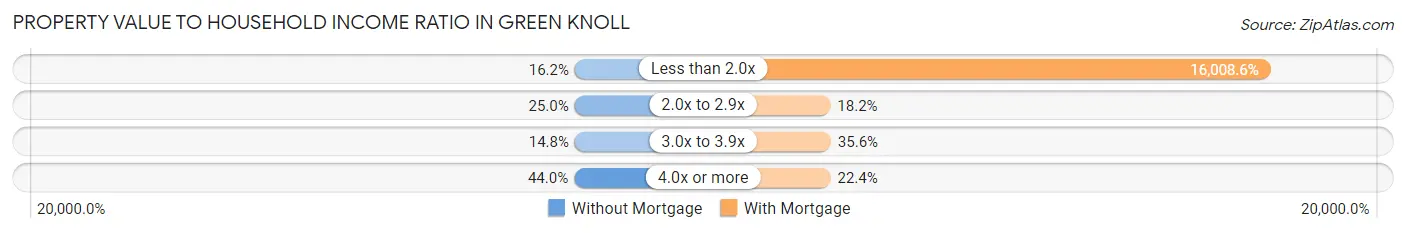
| Value-to-Income Ratio | Without Mortgage | With Mortgage |
| Less than 2.0x | 92 (16.2%) | 192,263 (16,008.6%) |
| 2.0x to 2.9x | 142 (25.0%) | 219 (18.2%) |
| 3.0x to 3.9x | 84 (14.8%) | 428 (35.6%) |
| 4.0x or more | 250 (44.0%) | 269 (22.4%) |
| Total | 568 (100.0%) | 1,201 (100.0%) |
Real Estate Taxes by Mortgage Status in Green Knoll
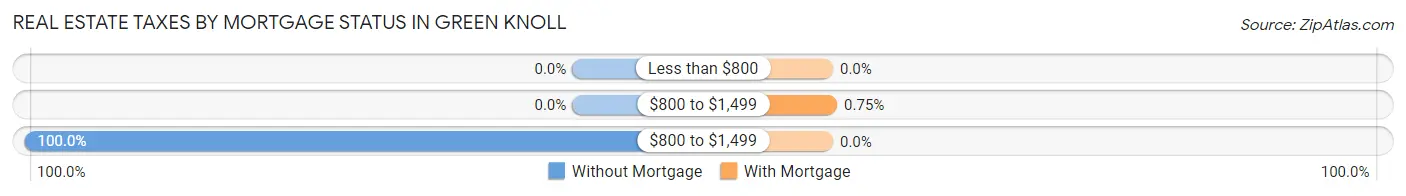
| Property Taxes | Without Mortgage | With Mortgage |
| Less than $800 | 0 (0.0%) | 0 (0.0%) |
| $800 to $1,499 | 0 (0.0%) | 9 (0.7%) |
| $800 to $1,499 | 568 (100.0%) | 0 (0.0%) |
| Total | 568 (100.0%) | 1,201 (100.0%) |
Health & Disability in Green Knoll
Health Insurance Coverage by Age in Green Knoll
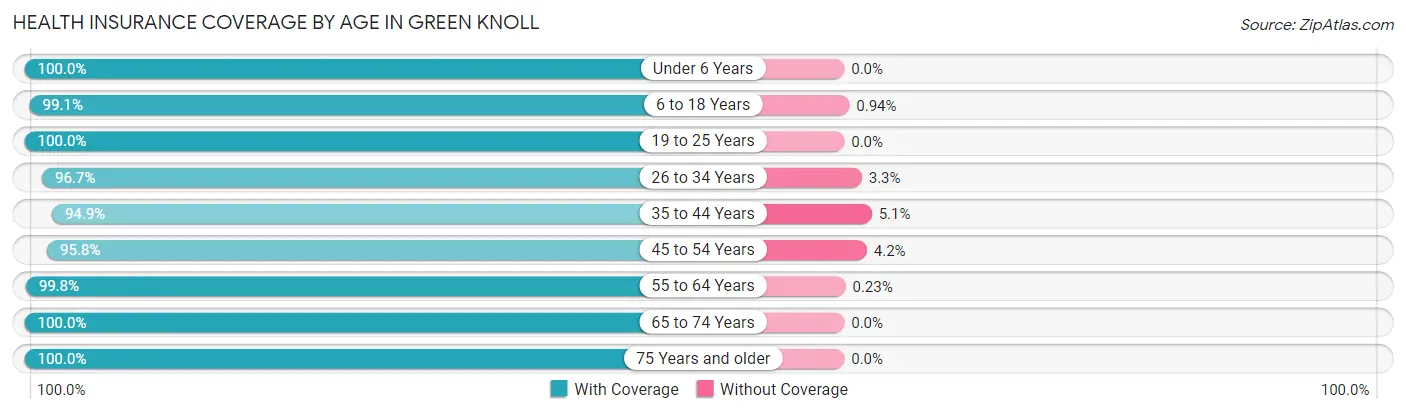
| Age Bracket | With Coverage | Without Coverage |
| Under 6 Years | 296 (100.0%) | 0 (0.0%) |
| 6 to 18 Years | 1,154 (99.1%) | 11 (0.9%) |
| 19 to 25 Years | 492 (100.0%) | 0 (0.0%) |
| 26 to 34 Years | 504 (96.7%) | 17 (3.3%) |
| 35 to 44 Years | 836 (94.9%) | 45 (5.1%) |
| 45 to 54 Years | 798 (95.8%) | 35 (4.2%) |
| 55 to 64 Years | 881 (99.8%) | 2 (0.2%) |
| 65 to 74 Years | 682 (100.0%) | 0 (0.0%) |
| 75 Years and older | 744 (100.0%) | 0 (0.0%) |
| Total | 6,387 (98.3%) | 110 (1.7%) |
Health Insurance Coverage by Citizenship Status in Green Knoll
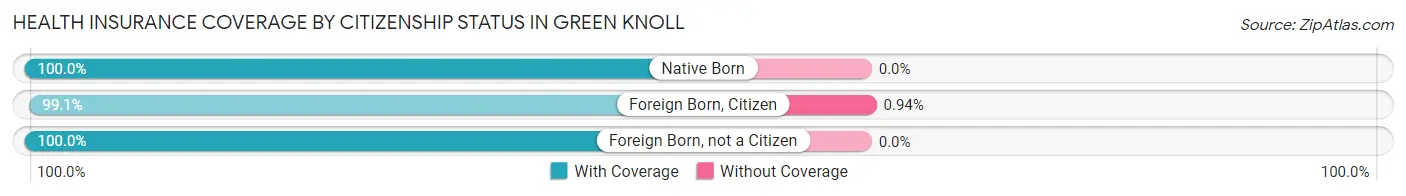
| Citizenship Status | With Coverage | Without Coverage |
| Native Born | 296 (100.0%) | 0 (0.0%) |
| Foreign Born, Citizen | 1,154 (99.1%) | 11 (0.9%) |
| Foreign Born, not a Citizen | 492 (100.0%) | 0 (0.0%) |
Health Insurance Coverage by Household Income in Green Knoll
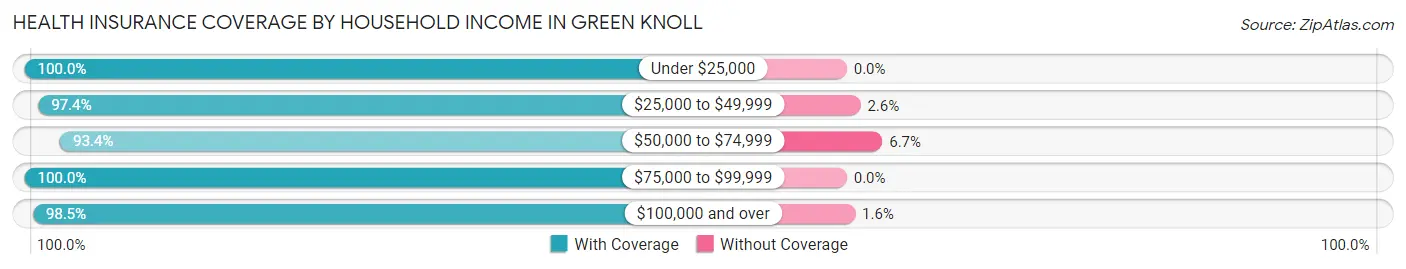
| Household Income | With Coverage | Without Coverage |
| Under $25,000 | 277 (100.0%) | 0 (0.0%) |
| $25,000 to $49,999 | 304 (97.4%) | 8 (2.6%) |
| $50,000 to $74,999 | 379 (93.3%) | 27 (6.7%) |
| $75,000 to $99,999 | 579 (100.0%) | 0 (0.0%) |
| $100,000 and over | 4,760 (98.5%) | 75 (1.5%) |
Public vs Private Health Insurance Coverage by Age in Green Knoll
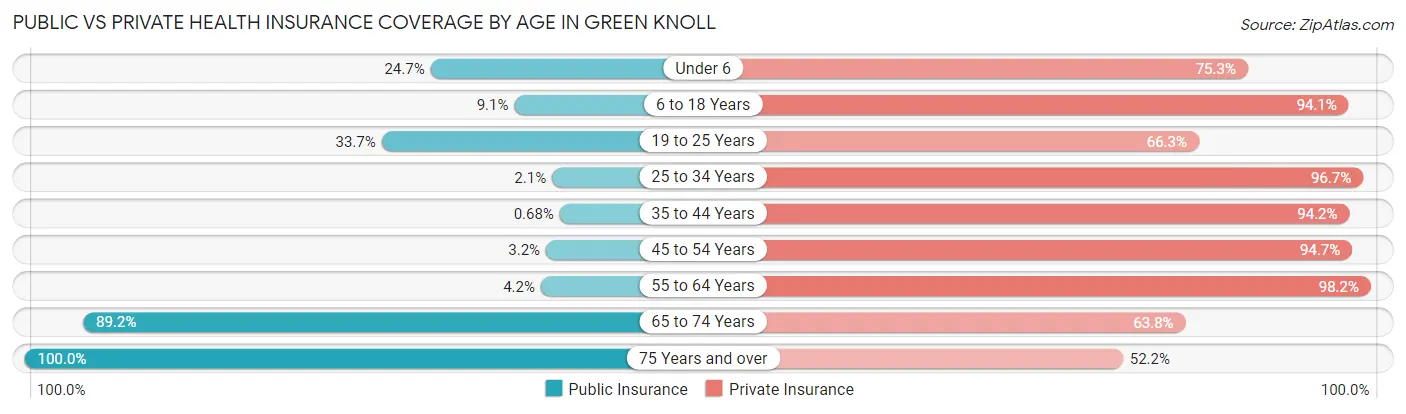
| Age Bracket | Public Insurance | Private Insurance |
| Under 6 | 73 (24.7%) | 223 (75.3%) |
| 6 to 18 Years | 106 (9.1%) | 1,096 (94.1%) |
| 19 to 25 Years | 166 (33.7%) | 326 (66.3%) |
| 25 to 34 Years | 11 (2.1%) | 504 (96.7%) |
| 35 to 44 Years | 6 (0.7%) | 830 (94.2%) |
| 45 to 54 Years | 27 (3.2%) | 789 (94.7%) |
| 55 to 64 Years | 37 (4.2%) | 867 (98.2%) |
| 65 to 74 Years | 608 (89.1%) | 435 (63.8%) |
| 75 Years and over | 744 (100.0%) | 388 (52.1%) |
| Total | 1,778 (27.4%) | 5,458 (84.0%) |
Disability Status by Sex by Age in Green Knoll
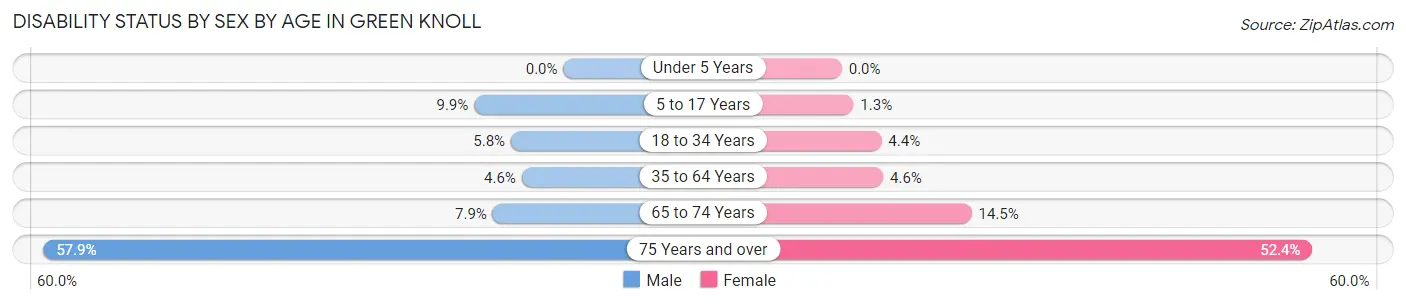
| Age Bracket | Male | Female |
| Under 5 Years | 0 (0.0%) | 0 (0.0%) |
| 5 to 17 Years | 51 (9.9%) | 8 (1.3%) |
| 18 to 34 Years | 31 (5.8%) | 23 (4.4%) |
| 35 to 64 Years | 60 (4.6%) | 60 (4.6%) |
| 65 to 74 Years | 21 (7.9%) | 60 (14.5%) |
| 75 Years and over | 117 (57.9%) | 284 (52.4%) |
Disability Class by Sex by Age in Green Knoll
Disability Class: Hearing Difficulty
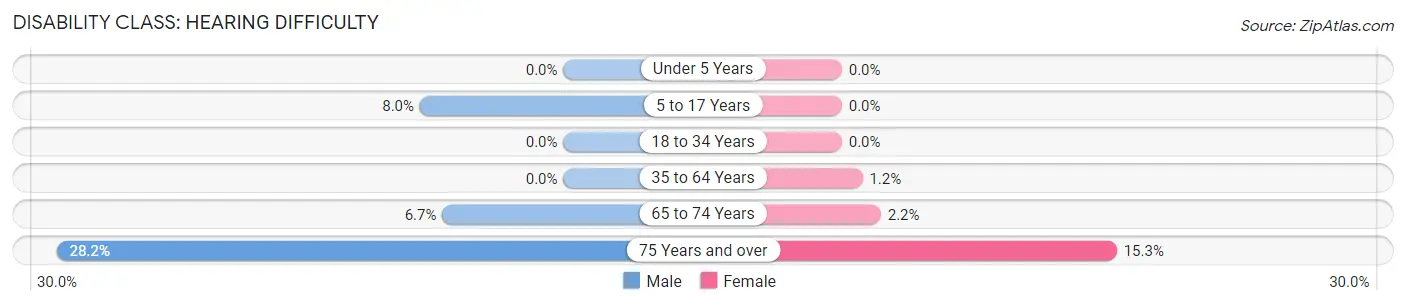
| Age Bracket | Male | Female |
| Under 5 Years | 0 (0.0%) | 0 (0.0%) |
| 5 to 17 Years | 41 (8.0%) | 0 (0.0%) |
| 18 to 34 Years | 0 (0.0%) | 0 (0.0%) |
| 35 to 64 Years | 0 (0.0%) | 15 (1.1%) |
| 65 to 74 Years | 18 (6.7%) | 9 (2.2%) |
| 75 Years and over | 57 (28.2%) | 83 (15.3%) |
Disability Class: Vision Difficulty
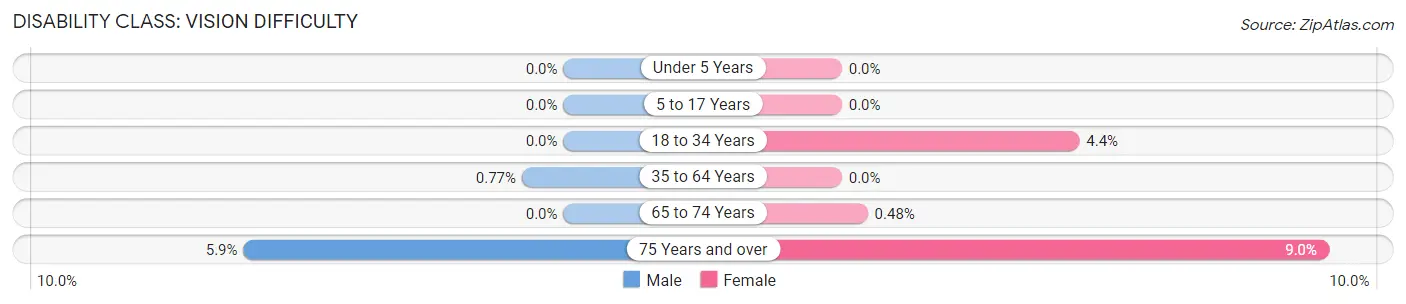
| Age Bracket | Male | Female |
| Under 5 Years | 0 (0.0%) | 0 (0.0%) |
| 5 to 17 Years | 0 (0.0%) | 0 (0.0%) |
| 18 to 34 Years | 0 (0.0%) | 23 (4.4%) |
| 35 to 64 Years | 10 (0.8%) | 0 (0.0%) |
| 65 to 74 Years | 0 (0.0%) | 2 (0.5%) |
| 75 Years and over | 12 (5.9%) | 49 (9.0%) |
Disability Class: Cognitive Difficulty
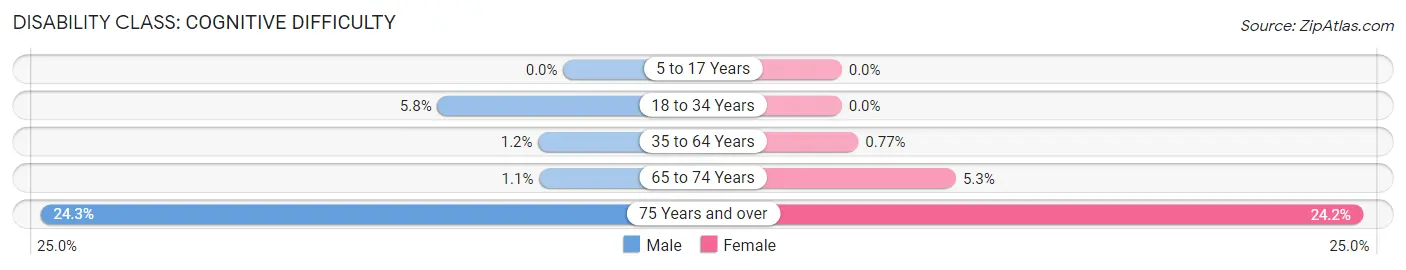
| Age Bracket | Male | Female |
| 5 to 17 Years | 0 (0.0%) | 0 (0.0%) |
| 18 to 34 Years | 31 (5.8%) | 0 (0.0%) |
| 35 to 64 Years | 15 (1.2%) | 10 (0.8%) |
| 65 to 74 Years | 3 (1.1%) | 22 (5.3%) |
| 75 Years and over | 49 (24.3%) | 131 (24.2%) |
Disability Class: Ambulatory Difficulty
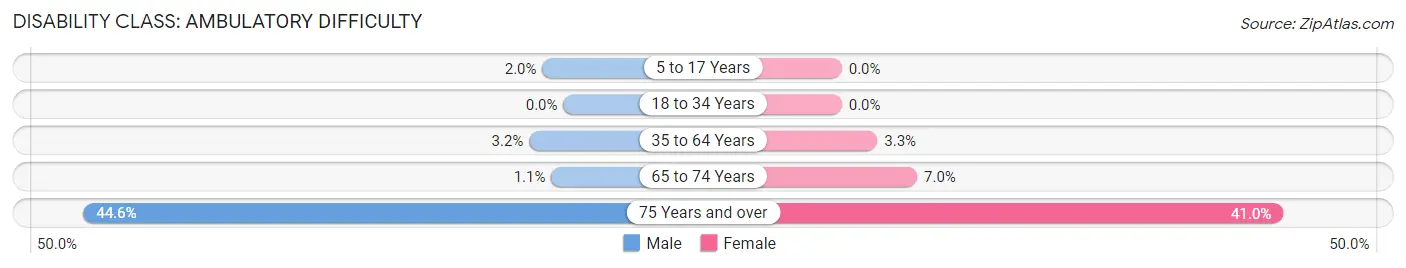
| Age Bracket | Male | Female |
| 5 to 17 Years | 10 (1.9%) | 0 (0.0%) |
| 18 to 34 Years | 0 (0.0%) | 0 (0.0%) |
| 35 to 64 Years | 41 (3.2%) | 43 (3.3%) |
| 65 to 74 Years | 3 (1.1%) | 29 (7.0%) |
| 75 Years and over | 90 (44.6%) | 222 (41.0%) |
Disability Class: Self-Care Difficulty
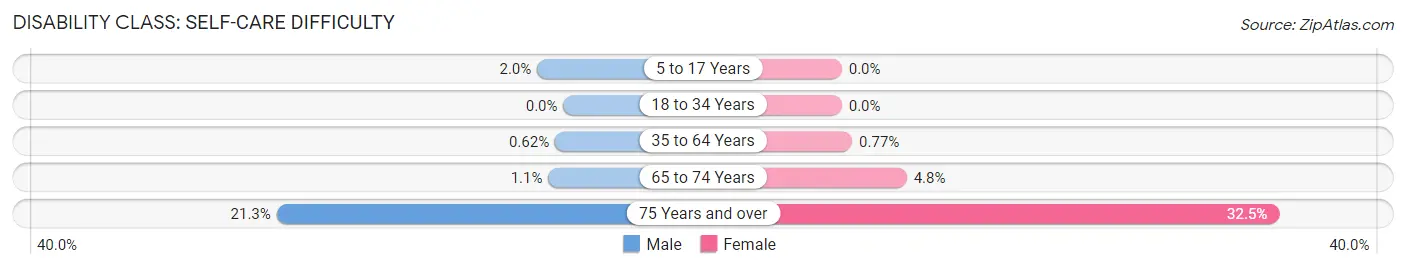
| Age Bracket | Male | Female |
| 5 to 17 Years | 10 (1.9%) | 0 (0.0%) |
| 18 to 34 Years | 0 (0.0%) | 0 (0.0%) |
| 35 to 64 Years | 8 (0.6%) | 10 (0.8%) |
| 65 to 74 Years | 3 (1.1%) | 20 (4.8%) |
| 75 Years and over | 43 (21.3%) | 176 (32.5%) |
Technology Access in Green Knoll
Computing Device Access in Green Knoll
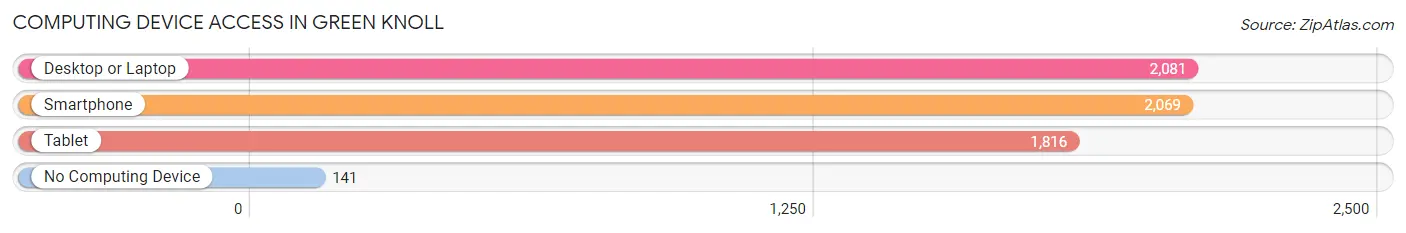
| Device Type | # Households | % Households |
| Desktop or Laptop | 2,081 | 88.2% |
| Smartphone | 2,069 | 87.7% |
| Tablet | 1,816 | 77.0% |
| No Computing Device | 141 | 6.0% |
| Total | 2,358 | 100.0% |
Internet Access in Green Knoll
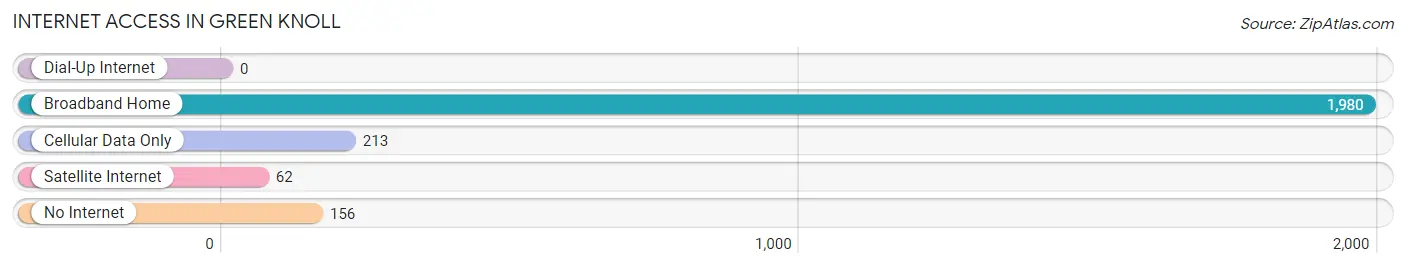
| Internet Type | # Households | % Households |
| Dial-Up Internet | 0 | 0.0% |
| Broadband Home | 1,980 | 84.0% |
| Cellular Data Only | 213 | 9.0% |
| Satellite Internet | 62 | 2.6% |
| No Internet | 156 | 6.6% |
| Total | 2,358 | 100.0% |
Green Knoll Summary
Green Knoll is a small unincorporated community located in Bridgewater Township, Somerset County, New Jersey. It is situated in the Raritan Valley region of Central New Jersey, approximately 25 miles southwest of Newark and 40 miles northwest of New York City. The community is bordered by the towns of Bridgewater, Bound Brook, and Somerville.
History
Green Knoll was first settled in the late 1700s by Dutch and German immigrants. The area was originally known as “Green Knoll” due to its rolling hills and lush vegetation. The community was officially established in 1845 when the Green Knoll Post Office was established.
In the late 1800s, Green Knoll was a thriving agricultural community. The area was known for its dairy farms, orchards, and vegetable gardens. The community also had several small businesses, including a blacksmith, a general store, and a grist mill.
In the early 1900s, Green Knoll began to transition from an agricultural community to a residential one. The area was annexed by Bridgewater Township in the 1950s and has since become a popular bedroom community for commuters to New York City and Newark.
Geography
Green Knoll is located in the Raritan Valley region of Central New Jersey. The community is situated in the northern part of Bridgewater Township, approximately 25 miles southwest of Newark and 40 miles northwest of New York City.
The area is characterized by rolling hills and lush vegetation. The community is bordered by the towns of Bridgewater, Bound Brook, and Somerville. The Raritan River runs through the area, providing a scenic backdrop for the community.
Economy
Green Knoll is primarily a residential community, with most of its residents commuting to nearby cities for work. The area is home to several small businesses, including restaurants, retail stores, and professional services.
The community is also home to several corporate offices, including those of Johnson & Johnson, Merck, and Prudential Financial. These companies provide employment opportunities for local residents.
Demographics
As of the 2010 census, Green Knoll had a population of 4,845. The population is predominantly white (90.3%), with small percentages of African American (3.2%), Asian (2.7%), and Hispanic (2.7%) residents.
The median household income in Green Knoll is $90,845, significantly higher than the national average of $50,046. The median home value is $521,400, also significantly higher than the national average of $184,700.
Conclusion
Green Knoll is a small unincorporated community located in Bridgewater Township, Somerset County, New Jersey. It is situated in the Raritan Valley region of Central New Jersey, approximately 25 miles southwest of Newark and 40 miles northwest of New York City. The community is primarily a residential one, with most of its residents commuting to nearby cities for work. The population is predominantly white, with small percentages of African American, Asian, and Hispanic residents. The median household income in Green Knoll is significantly higher than the national average, as is the median home value.
Common Questions
What is Per Capita Income in Green Knoll?
Per Capita income in Green Knoll is $60,508.
What is the Median Family Income in Green Knoll?
Median Family Income in Green Knoll is $190,725.
What is the Median Household income in Green Knoll?
Median Household Income in Green Knoll is $149,228.
What is Income or Wage Gap in Green Knoll?
Income or Wage Gap in Green Knoll is 43.1%.
Women in Green Knoll earn 56.9 cents for every dollar earned by a man.
What is Inequality or Gini Index in Green Knoll?
Inequality or Gini Index in Green Knoll is 0.41.
What is the Total Population of Green Knoll?
Total Population of Green Knoll is 6,635.
What is the Total Male Population of Green Knoll?
Total Male Population of Green Knoll is 2,994.
What is the Total Female Population of Green Knoll?
Total Female Population of Green Knoll is 3,641.
What is the Ratio of Males per 100 Females in Green Knoll?
There are 82.23 Males per 100 Females in Green Knoll.
What is the Ratio of Females per 100 Males in Green Knoll?
There are 121.61 Females per 100 Males in Green Knoll.
What is the Median Population Age in Green Knoll?
Median Population Age in Green Knoll is 44.6 Years.
What is the Average Family Size in Green Knoll
Average Family Size in Green Knoll is 3.5 People.
What is the Average Household Size in Green Knoll
Average Household Size in Green Knoll is 2.7 People.
How Large is the Labor Force in Green Knoll?
There are 3,495 People in the Labor Forcein in Green Knoll.
What is the Percentage of People in the Labor Force in Green Knoll?
64.9% of People are in the Labor Force in Green Knoll.
What is the Unemployment Rate in Green Knoll?
Unemployment Rate in Green Knoll is 3.1%.