Cities with the Most Immigrants from Sweden in New Jersey
RELATED REPORTS & OPTIONS
Sweden
New Jersey
Compare Cities
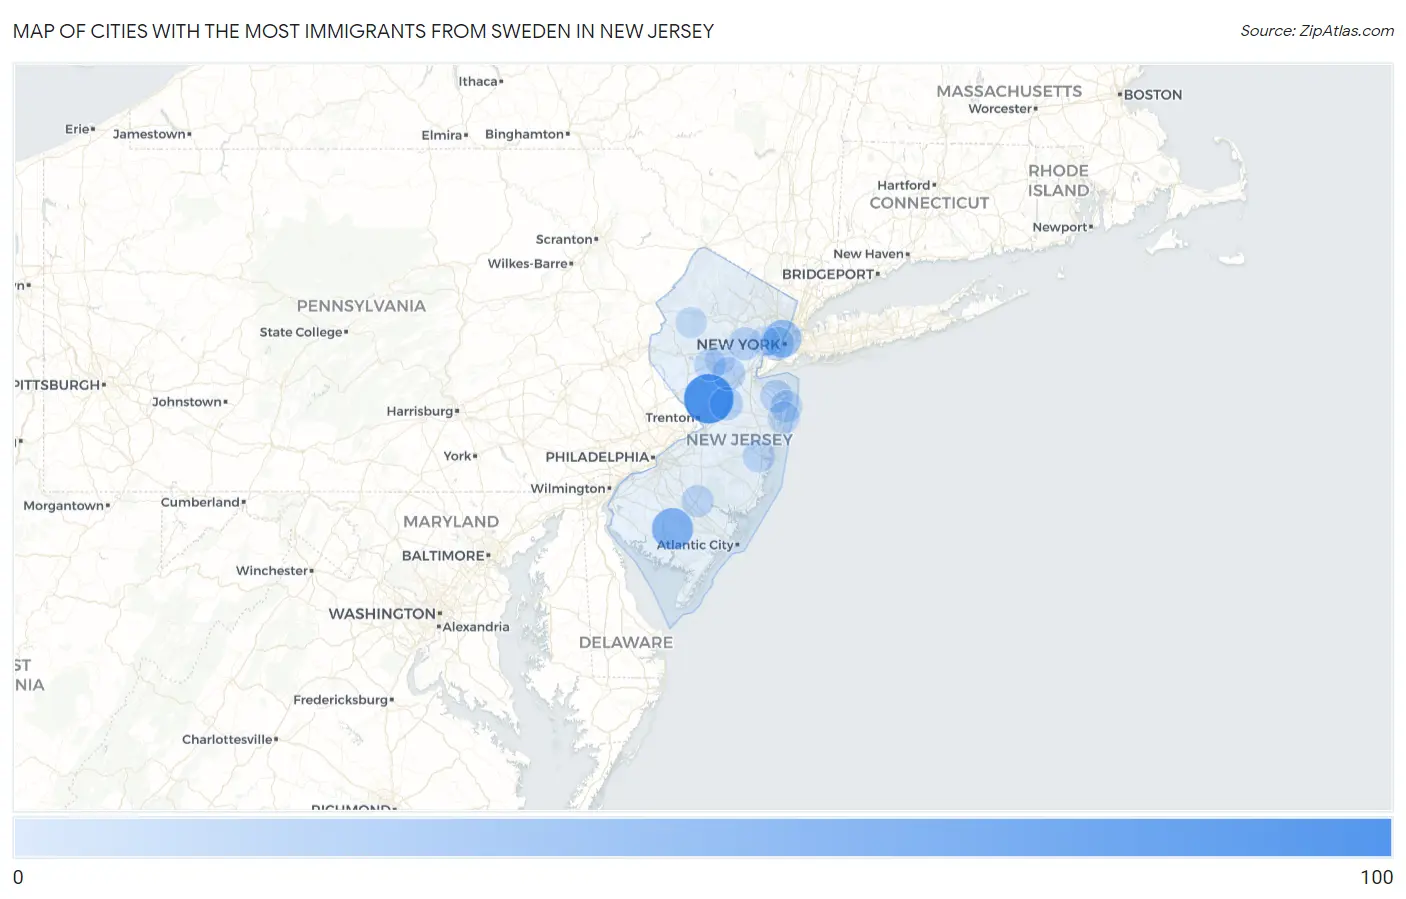
Map of Cities with the Most Immigrants from Sweden in New Jersey
0
100
Cities with the Most Immigrants from Sweden in New Jersey
| City | Sweden | vs State | vs National | |
| 1. | Princeton | 95 | 1,054(9.01%)#1 | 46,845(0.20%)#63 |
| 2. | Atlantic Highlands Borough | 59 | 1,054(5.60%)#2 | 46,845(0.13%)#135 |
| 3. | Vineland | 54 | 1,054(5.12%)#3 | 46,845(0.12%)#153 |
| 4. | Audubon Borough | 44 | 1,054(4.17%)#4 | 46,845(0.09%)#199 |
| 5. | Hoboken | 37 | 1,054(3.51%)#5 | 46,845(0.08%)#236 |
| 6. | Pleasantdale | 31 | 1,054(2.94%)#6 | 46,845(0.07%)#281 |
| 7. | Leonia Borough | 23 | 1,054(2.18%)#7 | 46,845(0.05%)#382 |
| 8. | Jersey City | 18 | 1,054(1.71%)#8 | 46,845(0.04%)#454 |
| 9. | Cologne | 17 | 1,054(1.61%)#9 | 46,845(0.04%)#493 |
| 10. | Edgewater Borough | 16 | 1,054(1.52%)#10 | 46,845(0.03%)#505 |
| 11. | Cranbury | 16 | 1,054(1.52%)#11 | 46,845(0.03%)#513 |
| 12. | Somerset | 15 | 1,054(1.42%)#12 | 46,845(0.03%)#532 |
| 13. | East Rutherford Borough | 15 | 1,054(1.42%)#13 | 46,845(0.03%)#540 |
| 14. | Closter Borough | 15 | 1,054(1.42%)#14 | 46,845(0.03%)#543 |
| 15. | Summit | 14 | 1,054(1.33%)#15 | 46,845(0.03%)#576 |
| 16. | Tenafly Borough | 14 | 1,054(1.33%)#16 | 46,845(0.03%)#582 |
| 17. | Mckee | 14 | 1,054(1.33%)#17 | 46,845(0.03%)#589 |
| 18. | Fort Lee Borough | 12 | 1,054(1.14%)#18 | 46,845(0.03%)#654 |
| 19. | Fairview | 12 | 1,054(1.14%)#19 | 46,845(0.03%)#675 |
| 20. | Collingswood Borough | 11 | 1,054(1.04%)#20 | 46,845(0.02%)#723 |
| 21. | Silver Ridge | 11 | 1,054(1.04%)#21 | 46,845(0.02%)#732 |
| 22. | Long Branch | 10 | 1,054(0.95%)#22 | 46,845(0.02%)#749 |
| 23. | Asbury Park | 10 | 1,054(0.95%)#23 | 46,845(0.02%)#760 |
| 24. | Ramsey Borough | 10 | 1,054(0.95%)#24 | 46,845(0.02%)#762 |
| 25. | Hammonton | 10 | 1,054(0.95%)#25 | 46,845(0.02%)#763 |
| 26. | Madison Borough | 9 | 1,054(0.85%)#26 | 46,845(0.02%)#817 |
| 27. | Bradley Gardens | 9 | 1,054(0.85%)#27 | 46,845(0.02%)#818 |
| 28. | Point Pleasant Borough | 8 | 1,054(0.76%)#28 | 46,845(0.02%)#866 |
| 29. | Essex Fells Borough | 8 | 1,054(0.76%)#29 | 46,845(0.02%)#885 |
| 30. | Avon By The Sea Borough | 8 | 1,054(0.76%)#30 | 46,845(0.02%)#889 |
| 31. | Mountain Lakes Borough | 7 | 1,054(0.66%)#31 | 46,845(0.01%)#933 |
| 32. | Riverdale Borough | 7 | 1,054(0.66%)#32 | 46,845(0.01%)#936 |
| 33. | Lavallette Borough | 6 | 1,054(0.57%)#33 | 46,845(0.01%)#997 |
| 34. | Hackettstown | 5 | 1,054(0.47%)#34 | 46,845(0.01%)#1,039 |
| 35. | Ship Bottom Borough | 4 | 1,054(0.38%)#35 | 46,845(0.01%)#1,087 |
| 36. | Martinsville | 3 | 1,054(0.28%)#36 | 46,845(0.01%)#1,099 |
| 37. | Newark | 2 | 1,054(0.19%)#37 | 46,845(0.00%)#1,121 |
| 38. | Chester Borough | 2 | 1,054(0.19%)#38 | 46,845(0.00%)#1,133 |
Common Questions
What are the Top 10 Cities with the Most Immigrants from Sweden in New Jersey?
Top 10 Cities with the Most Immigrants from Sweden in New Jersey are:
#1
95
#2
54
#3
37
#4
18
#5
16
#6
15
#7
14
#8
12
#9
11
#10
10
What city has the Most Immigrants from Sweden in New Jersey?
Princeton has the Most Immigrants from Sweden in New Jersey with 95.
What is the Total Immigrants from Sweden in the State of New Jersey?
Total Immigrants from Sweden in New Jersey is 1,054.
What is the Total Immigrants from Sweden in the United States?
Total Immigrants from Sweden in the United States is 46,845.