Upper Stewartsville, NJ Map & Demographics
Upper Stewartsville Map
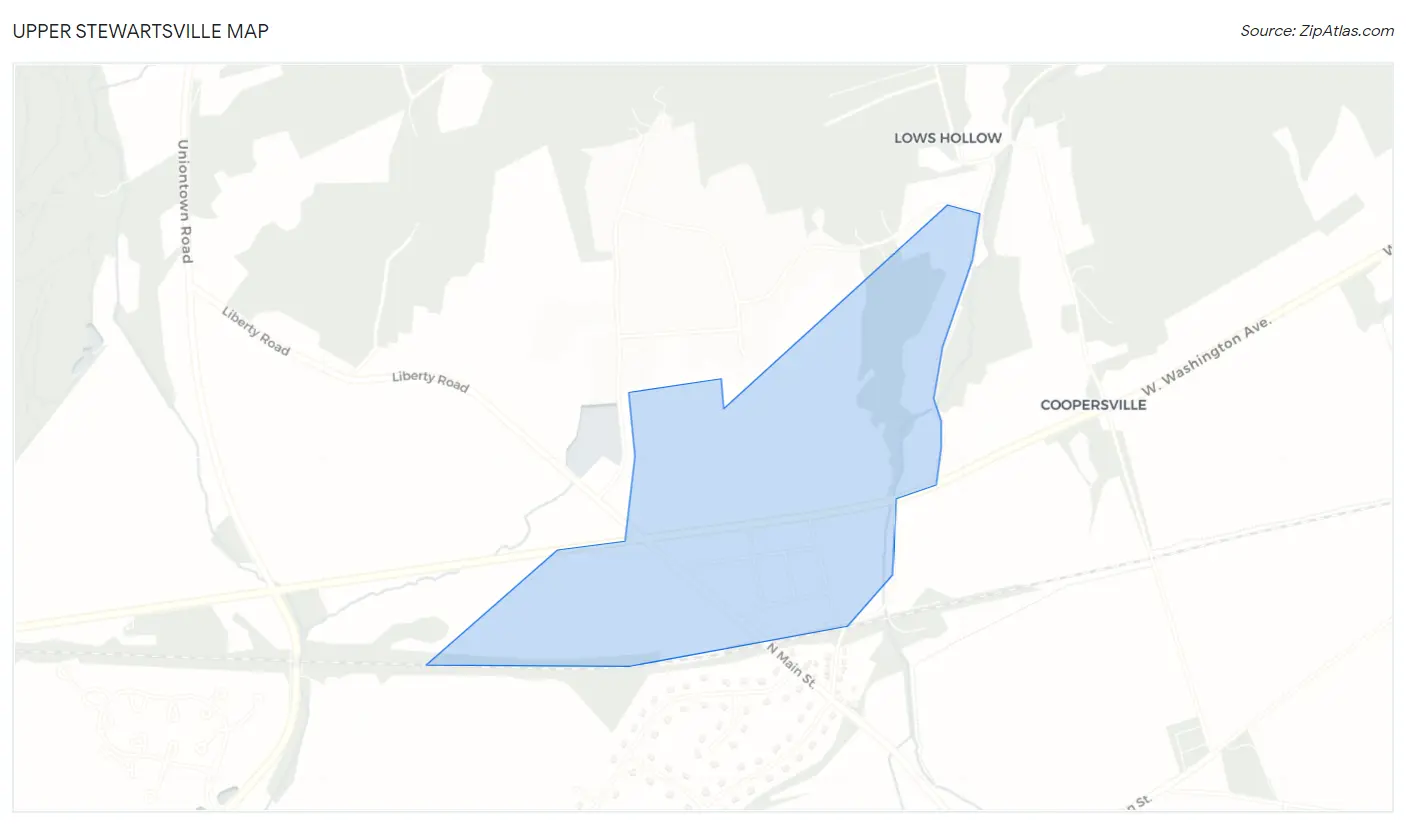
Upper Stewartsville Overview
$50,196
PER CAPITA INCOME
0.45
INEQUALITY / GINI INDEX
344
TOTAL POPULATION
204
MALE POPULATION
140
FEMALE POPULATION
145.71
MALES / 100 FEMALES
68.63
FEMALES / 100 MALES
37.8
MEDIAN AGE
3.5
AVG FAMILY SIZE
2.8
AVG HOUSEHOLD SIZE
168
LABOR FORCE [ PEOPLE ]
57.5%
PERCENT IN LABOR FORCE
8.9%
UNEMPLOYMENT RATE
Income in Upper Stewartsville
Income Overview in Upper Stewartsville
| Characteristic | Number | Measure |
| Per Capita Income | 344 | $50,196 |
| Median Family Income | 85 | $0 |
| Mean Family Income | 85 | $155,426 |
| Median Household Income | 123 | $0 |
| Mean Household Income | 123 | $127,737 |
| Income Deficit | 85 | $0 |
| Wage / Income Gap (%) | 344 | 0.00% |
| Wage / Income Gap ($) | 344 | 100.00¢ per $1 |
| Gini / Inequality Index | 344 | 0.45 |
Earnings by Sex in Upper Stewartsville
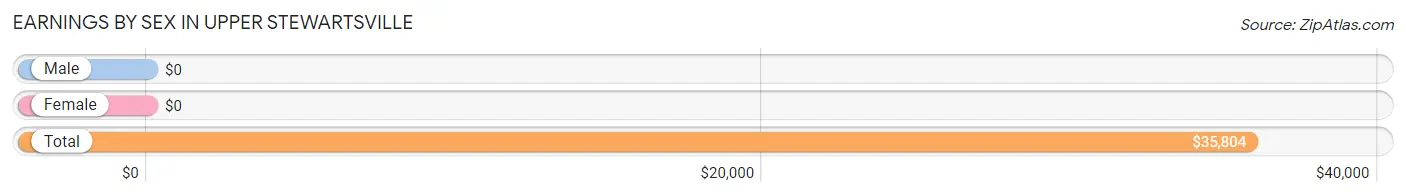
| Sex | Number | Average Earnings |
| Male | 119 (62.3%) | $0 |
| Female | 72 (37.7%) | $0 |
| Total | 191 (100.0%) | $35,804 |
Earnings by Sex by Income Bracket in Upper Stewartsville
The most common earnings brackets in Upper Stewartsville are $100,000+ for men (48 | 40.3%) and $2,499 or less for women (23 | 31.9%).
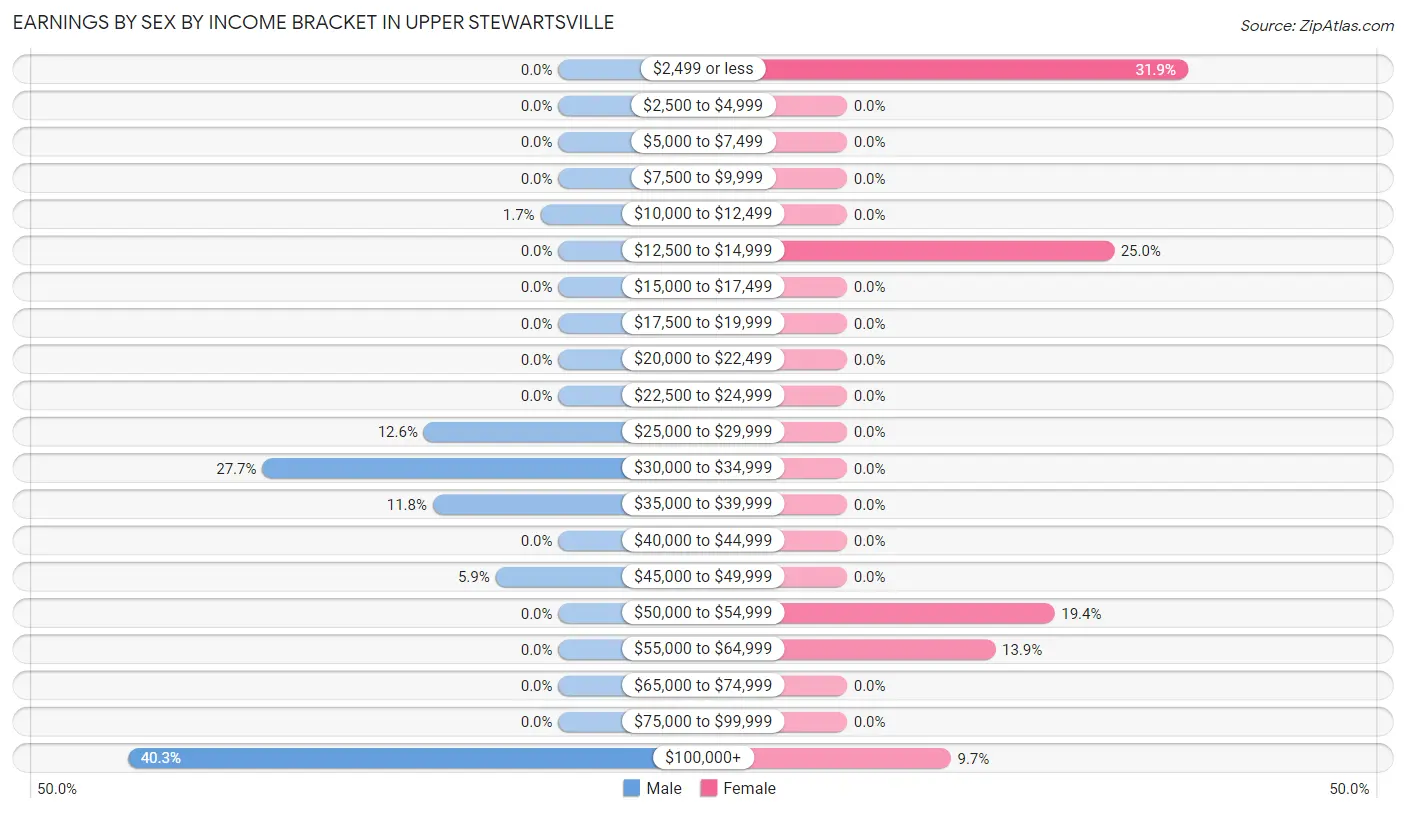
| Income | Male | Female |
| $2,499 or less | 0 (0.0%) | 23 (31.9%) |
| $2,500 to $4,999 | 0 (0.0%) | 0 (0.0%) |
| $5,000 to $7,499 | 0 (0.0%) | 0 (0.0%) |
| $7,500 to $9,999 | 0 (0.0%) | 0 (0.0%) |
| $10,000 to $12,499 | 2 (1.7%) | 0 (0.0%) |
| $12,500 to $14,999 | 0 (0.0%) | 18 (25.0%) |
| $15,000 to $17,499 | 0 (0.0%) | 0 (0.0%) |
| $17,500 to $19,999 | 0 (0.0%) | 0 (0.0%) |
| $20,000 to $22,499 | 0 (0.0%) | 0 (0.0%) |
| $22,500 to $24,999 | 0 (0.0%) | 0 (0.0%) |
| $25,000 to $29,999 | 15 (12.6%) | 0 (0.0%) |
| $30,000 to $34,999 | 33 (27.7%) | 0 (0.0%) |
| $35,000 to $39,999 | 14 (11.8%) | 0 (0.0%) |
| $40,000 to $44,999 | 0 (0.0%) | 0 (0.0%) |
| $45,000 to $49,999 | 7 (5.9%) | 0 (0.0%) |
| $50,000 to $54,999 | 0 (0.0%) | 14 (19.4%) |
| $55,000 to $64,999 | 0 (0.0%) | 10 (13.9%) |
| $65,000 to $74,999 | 0 (0.0%) | 0 (0.0%) |
| $75,000 to $99,999 | 0 (0.0%) | 0 (0.0%) |
| $100,000+ | 48 (40.3%) | 7 (9.7%) |
| Total | 119 (100.0%) | 72 (100.0%) |
Earnings by Sex by Educational Attainment in Upper Stewartsville
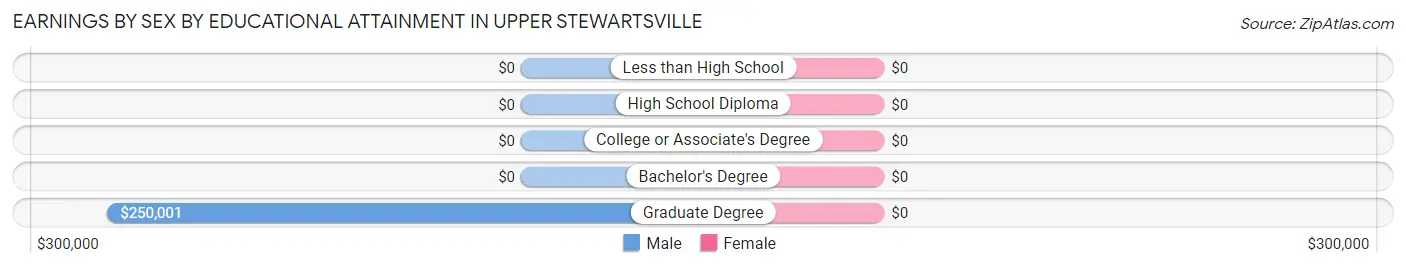
| Educational Attainment | Male Income | Female Income |
| Less than High School | - | - |
| High School Diploma | - | - |
| College or Associate's Degree | - | - |
| Bachelor's Degree | - | - |
| Graduate Degree | $250,001 | $0 |
| Total | - | - |
Family Income in Upper Stewartsville
Family Income Brackets in Upper Stewartsville
According to the Upper Stewartsville family income data, there are 29 families falling into the $25,000 to $34,999 income range, which is the most common income bracket and makes up 34.1% of all families.
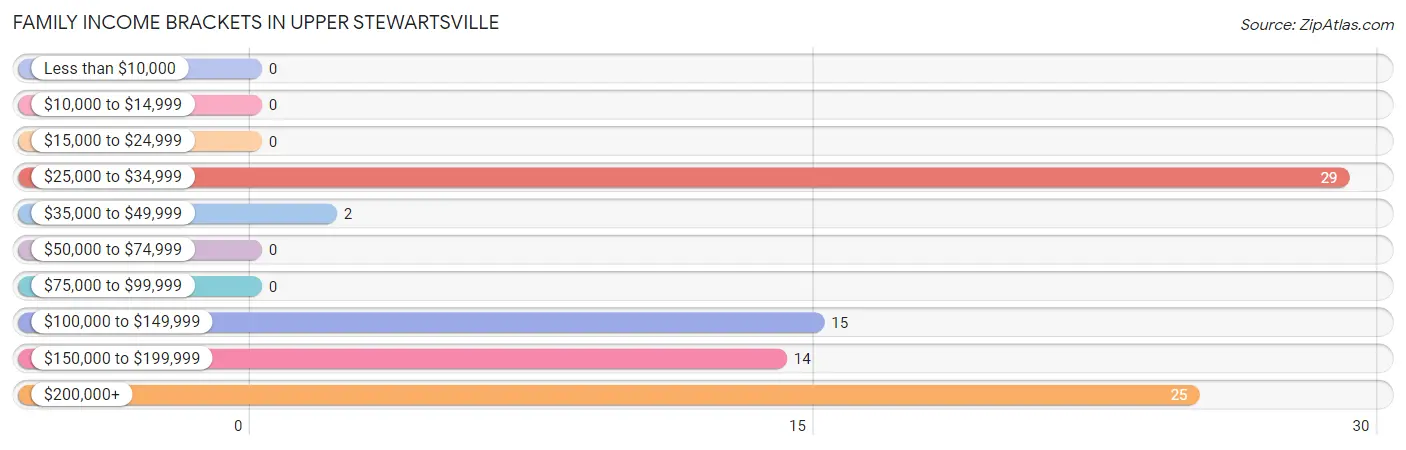
| Income Bracket | # Families | % Families |
| Less than $10,000 | 0 | 0.0% |
| $10,000 to $14,999 | 0 | 0.0% |
| $15,000 to $24,999 | 0 | 0.0% |
| $25,000 to $34,999 | 29 | 34.1% |
| $35,000 to $49,999 | 2 | 2.4% |
| $50,000 to $74,999 | 0 | 0.0% |
| $75,000 to $99,999 | 0 | 0.0% |
| $100,000 to $149,999 | 15 | 17.6% |
| $150,000 to $199,999 | 14 | 16.5% |
| $200,000+ | 25 | 29.4% |
Family Income by Famaliy Size in Upper Stewartsville
| Income Bracket | # Families | Median Income |
| 2-Person Families | 43 (50.6%) | $0 |
| 3-Person Families | 10 (11.8%) | $0 |
| 4-Person Families | 0 (0.0%) | $0 |
| 5-Person Families | 14 (16.5%) | $0 |
| 6-Person Families | 18 (21.2%) | $0 |
| 7+ Person Families | 0 (0.0%) | $0 |
| Total | 85 (100.0%) | $0 |
Family Income by Number of Earners in Upper Stewartsville
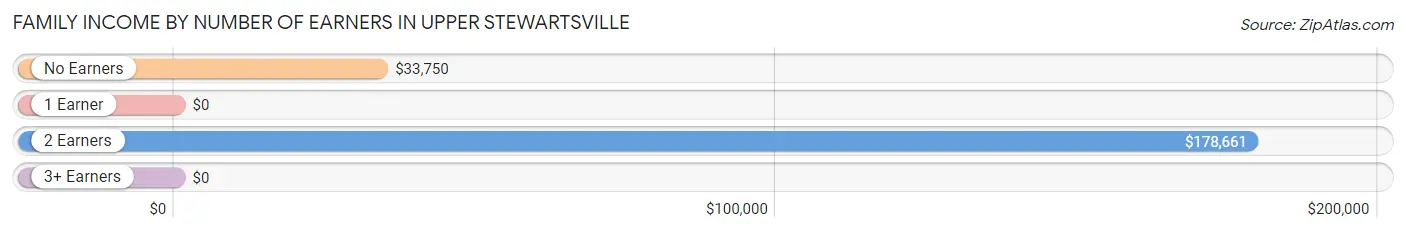
| Number of Earners | # Families | Median Income |
| No Earners | 36 (42.3%) | $33,750 |
| 1 Earner | 2 (2.4%) | $0 |
| 2 Earners | 29 (34.1%) | $178,661 |
| 3+ Earners | 18 (21.2%) | $0 |
| Total | 85 (100.0%) | $0 |
Household Income in Upper Stewartsville
Household Income Brackets in Upper Stewartsville
With 33 households falling in the category, the $50,000 to $74,999 income range is the most frequent in Upper Stewartsville, accounting for 26.8% of all households.
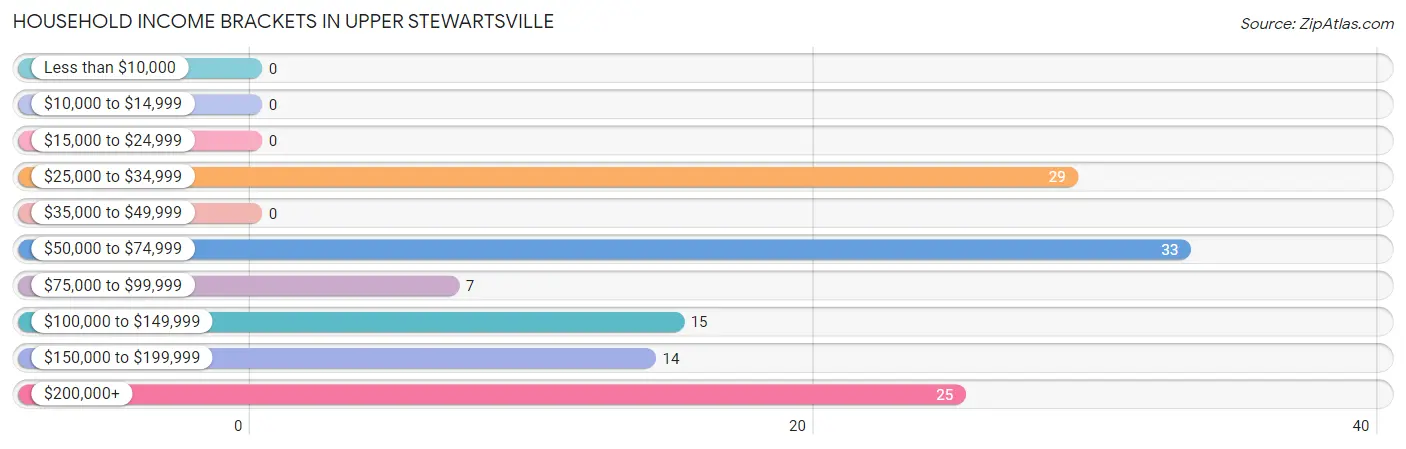
| Income Bracket | # Households | % Households |
| Less than $10,000 | 0 | 0.0% |
| $10,000 to $14,999 | 0 | 0.0% |
| $15,000 to $24,999 | 0 | 0.0% |
| $25,000 to $34,999 | 29 | 23.6% |
| $35,000 to $49,999 | 0 | 0.0% |
| $50,000 to $74,999 | 33 | 26.8% |
| $75,000 to $99,999 | 7 | 5.7% |
| $100,000 to $149,999 | 15 | 12.2% |
| $150,000 to $199,999 | 14 | 11.4% |
| $200,000+ | 25 | 20.3% |
Household Income by Householder Age in Upper Stewartsville
The median household income in Upper Stewartsville is $0, with the highest median household income of $58,712 found in the 65+ years age bracket for the primary householder. A total of 62 households (50.4%) fall into this category.
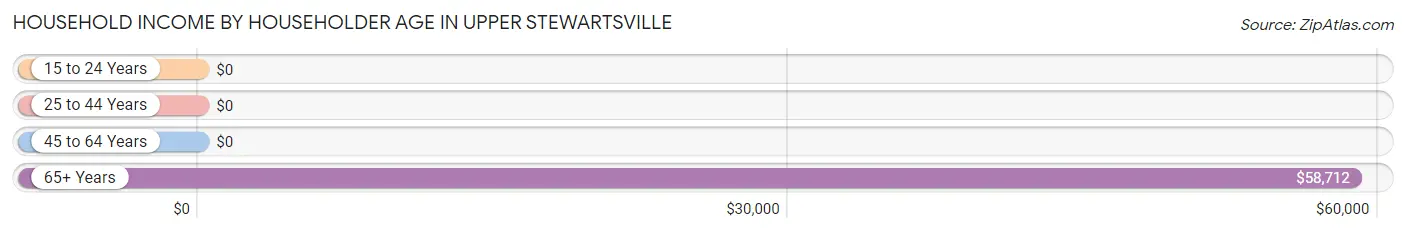
| Income Bracket | # Households | Median Income |
| 15 to 24 Years | 0 (0.0%) | $0 |
| 25 to 44 Years | 21 (17.1%) | $0 |
| 45 to 64 Years | 40 (32.5%) | $0 |
| 65+ Years | 62 (50.4%) | $58,712 |
| Total | 123 (100.0%) | $0 |
Poverty in Upper Stewartsville
Income Below Poverty by Sex and Age in Upper Stewartsville
| Age Bracket | Male | Female |
| Under 5 Years | 0 (0.0%) | 0 (0.0%) |
| 5 Years | 0 (0.0%) | 0 (0.0%) |
| 6 to 11 Years | 0 (0.0%) | 0 (0.0%) |
| 12 to 14 Years | 0 (0.0%) | 0 (0.0%) |
| 15 Years | 0 (0.0%) | 0 (0.0%) |
| 16 and 17 Years | 0 (0.0%) | 0 (0.0%) |
| 18 to 24 Years | 0 (0.0%) | 0 (0.0%) |
| 25 to 34 Years | 0 (0.0%) | 0 (0.0%) |
| 35 to 44 Years | 0 (0.0%) | 0 (0.0%) |
| 45 to 54 Years | 0 (0.0%) | 0 (0.0%) |
| 55 to 64 Years | 0 (0.0%) | 0 (0.0%) |
| 65 to 74 Years | 0 (0.0%) | 0 (0.0%) |
| 75 Years and over | 0 (0.0%) | 0 (0.0%) |
| Total | 0 (0.0%) | 0 (0.0%) |
Income Above Poverty by Sex and Age in Upper Stewartsville
According to the poverty statistics in Upper Stewartsville, males aged 6 to 11 years and females aged 6 to 11 years are the age groups that are most secure financially, with 100.0% of males and 100.0% of females in these age groups living above the poverty line.
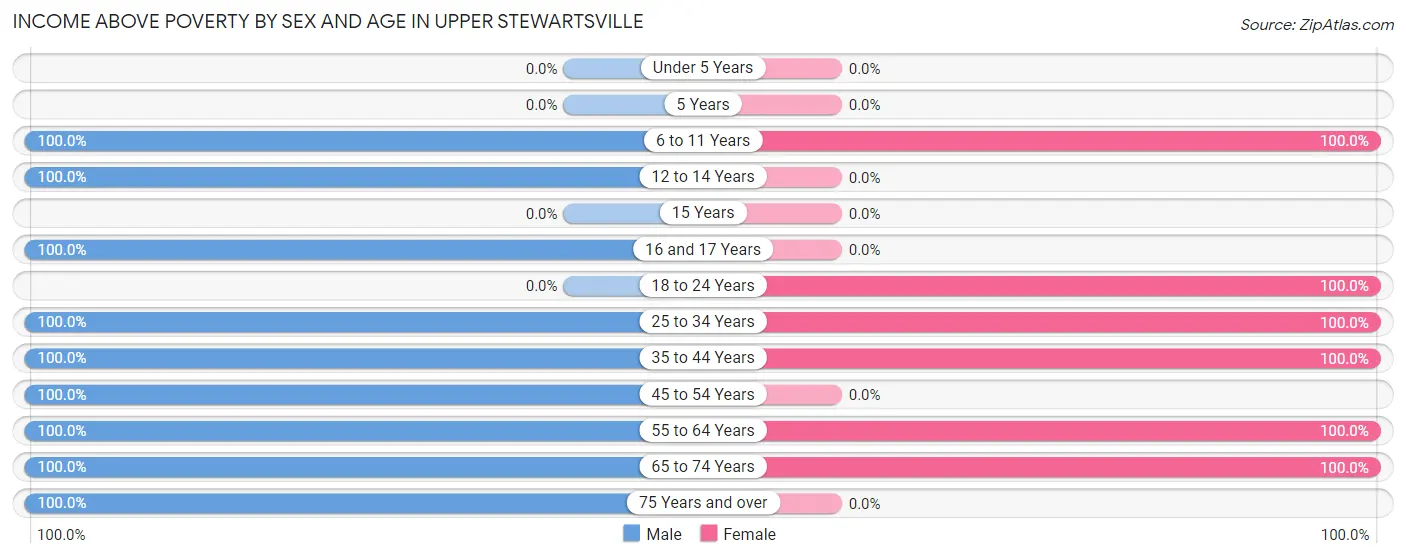
| Age Bracket | Male | Female |
| Under 5 Years | 0 (0.0%) | 0 (0.0%) |
| 5 Years | 0 (0.0%) | 0 (0.0%) |
| 6 to 11 Years | 15 (100.0%) | 15 (100.0%) |
| 12 to 14 Years | 15 (100.0%) | 0 (0.0%) |
| 15 Years | 0 (0.0%) | 0 (0.0%) |
| 16 and 17 Years | 16 (100.0%) | 0 (0.0%) |
| 18 to 24 Years | 0 (0.0%) | 23 (100.0%) |
| 25 to 34 Years | 37 (100.0%) | 17 (100.0%) |
| 35 to 44 Years | 17 (100.0%) | 16 (100.0%) |
| 45 to 54 Years | 2 (100.0%) | 0 (0.0%) |
| 55 to 64 Years | 42 (100.0%) | 26 (100.0%) |
| 65 to 74 Years | 20 (100.0%) | 43 (100.0%) |
| 75 Years and over | 33 (100.0%) | 0 (0.0%) |
| Total | 197 (100.0%) | 140 (100.0%) |
Income Below Poverty Among Married-Couple Families in Upper Stewartsville
| Children | Above Poverty | Below Poverty |
| No Children | 51 (100.0%) | 0 (0.0%) |
| 1 or 2 Children | 18 (100.0%) | 0 (0.0%) |
| 3 or 4 Children | 14 (100.0%) | 0 (0.0%) |
| 5 or more Children | 0 (0.0%) | 0 (0.0%) |
| Total | 83 (100.0%) | 0 (0.0%) |
Income Below Poverty Among Single-Parent Households in Upper Stewartsville
| Children | Single Father | Single Mother |
| No Children | 0 (0.0%) | 0 (0.0%) |
| 1 or 2 Children | 0 (0.0%) | 0 (0.0%) |
| 3 or 4 Children | 0 (0.0%) | 0 (0.0%) |
| 5 or more Children | 0 (0.0%) | 0 (0.0%) |
| Total | 0 (0.0%) | 0 (0.0%) |
Income Below Poverty Among Married-Couple vs Single-Parent Households in Upper Stewartsville
| Children | Married-Couple Families | Single-Parent Households |
| No Children | 0 (0.0%) | 0 (0.0%) |
| 1 or 2 Children | 0 (0.0%) | 0 (0.0%) |
| 3 or 4 Children | 0 (0.0%) | 0 (0.0%) |
| 5 or more Children | 0 (0.0%) | 0 (0.0%) |
| Total | 0 (0.0%) | 0 (0.0%) |
Race in Upper Stewartsville
The most populous races in Upper Stewartsville are White / Caucasian (322 | 93.6%), Hispanic or Latino (15 | 4.4%), and Some other Race (15 | 4.4%).
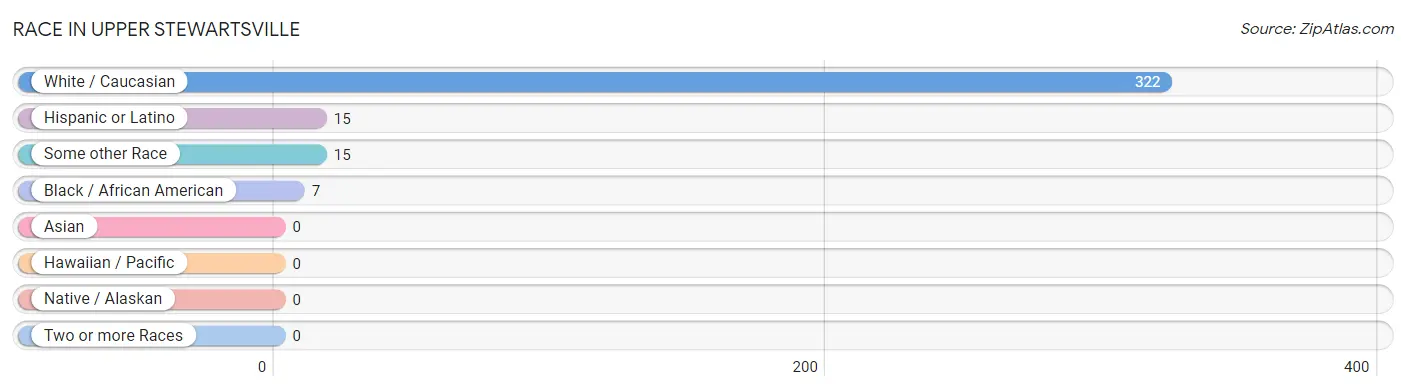
| Race | # Population | % Population |
| Asian | 0 | 0.0% |
| Black / African American | 7 | 2.0% |
| Hawaiian / Pacific | 0 | 0.0% |
| Hispanic or Latino | 15 | 4.4% |
| Native / Alaskan | 0 | 0.0% |
| White / Caucasian | 322 | 93.6% |
| Two or more Races | 0 | 0.0% |
| Some other Race | 15 | 4.4% |
| Total | 344 | 100.0% |
Ancestry in Upper Stewartsville
The most populous ancestries reported in Upper Stewartsville are German (173 | 50.3%), Italian (154 | 44.8%), Polish (44 | 12.8%), English (40 | 11.6%), and Argentinean (15 | 4.4%), together accounting for 123.8% of all Upper Stewartsville residents.
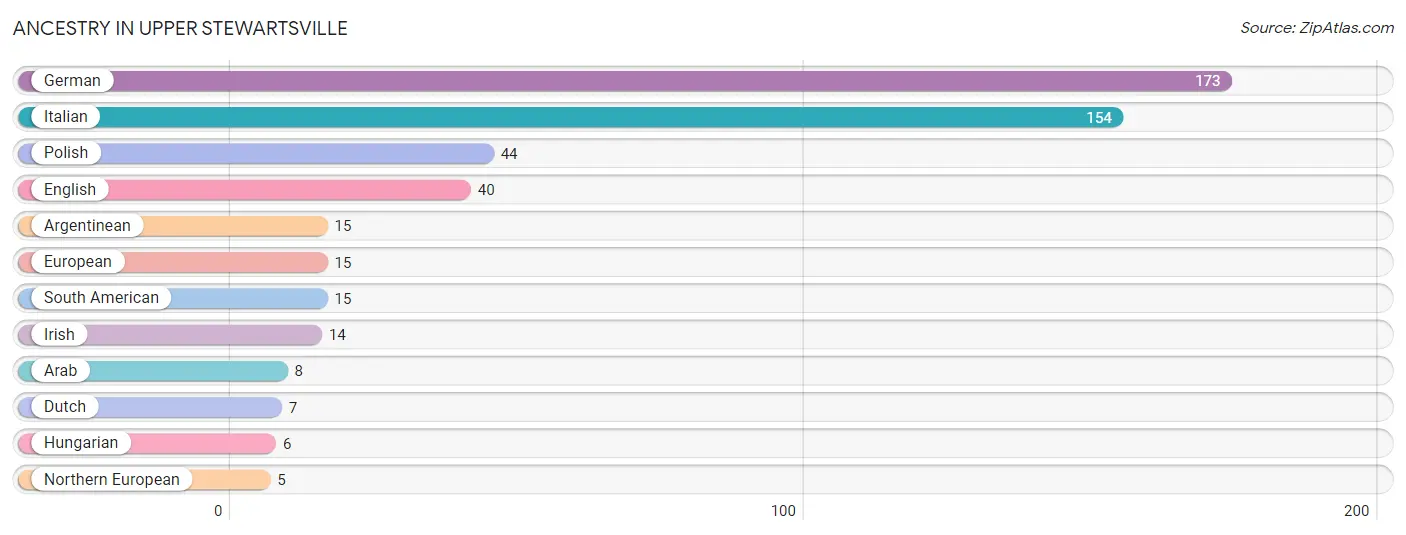
| Ancestry | # Population | % Population |
| Arab | 8 | 2.3% |
| Argentinean | 15 | 4.4% |
| Dutch | 7 | 2.0% |
| English | 40 | 11.6% |
| European | 15 | 4.4% |
| German | 173 | 50.3% |
| Hungarian | 6 | 1.7% |
| Irish | 14 | 4.1% |
| Italian | 154 | 44.8% |
| Northern European | 5 | 1.5% |
| Polish | 44 | 12.8% |
| South American | 15 | 4.4% | View All 12 Rows |
Immigrants in Upper Stewartsville

| Immigration Origin | # Population | % Population | View All 0 Rows |
Sex and Age in Upper Stewartsville
Sex and Age in Upper Stewartsville
The most populous age groups in Upper Stewartsville are 75 to 79 Years (33 | 16.2%) for men and 70 to 74 Years (27 | 19.3%) for women.
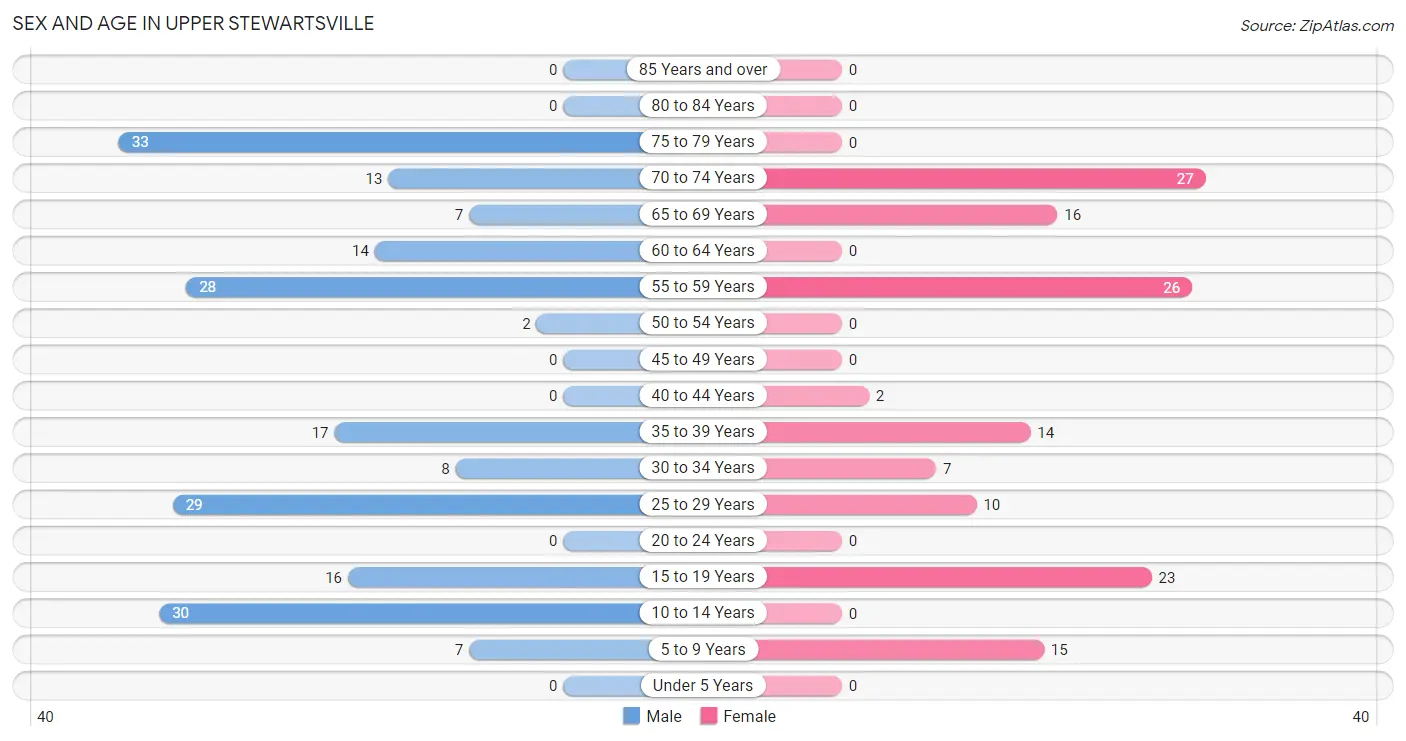
| Age Bracket | Male | Female |
| Under 5 Years | 0 (0.0%) | 0 (0.0%) |
| 5 to 9 Years | 7 (3.4%) | 15 (10.7%) |
| 10 to 14 Years | 30 (14.7%) | 0 (0.0%) |
| 15 to 19 Years | 16 (7.8%) | 23 (16.4%) |
| 20 to 24 Years | 0 (0.0%) | 0 (0.0%) |
| 25 to 29 Years | 29 (14.2%) | 10 (7.1%) |
| 30 to 34 Years | 8 (3.9%) | 7 (5.0%) |
| 35 to 39 Years | 17 (8.3%) | 14 (10.0%) |
| 40 to 44 Years | 0 (0.0%) | 2 (1.4%) |
| 45 to 49 Years | 0 (0.0%) | 0 (0.0%) |
| 50 to 54 Years | 2 (1.0%) | 0 (0.0%) |
| 55 to 59 Years | 28 (13.7%) | 26 (18.6%) |
| 60 to 64 Years | 14 (6.9%) | 0 (0.0%) |
| 65 to 69 Years | 7 (3.4%) | 16 (11.4%) |
| 70 to 74 Years | 13 (6.4%) | 27 (19.3%) |
| 75 to 79 Years | 33 (16.2%) | 0 (0.0%) |
| 80 to 84 Years | 0 (0.0%) | 0 (0.0%) |
| 85 Years and over | 0 (0.0%) | 0 (0.0%) |
| Total | 204 (100.0%) | 140 (100.0%) |
Families and Households in Upper Stewartsville
Median Family Size in Upper Stewartsville
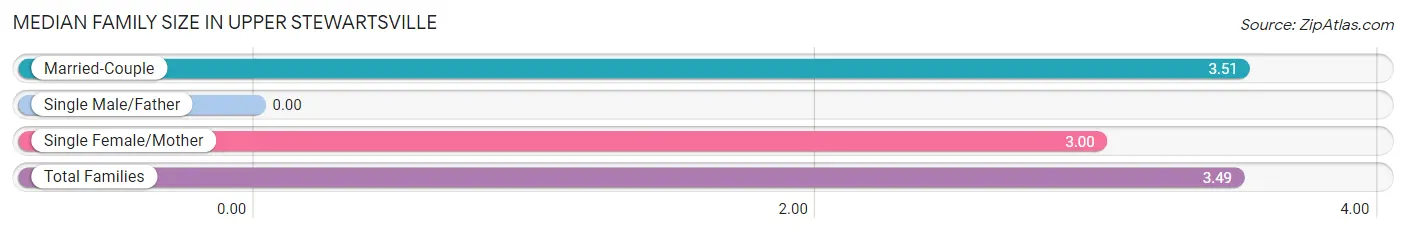
| Family Type | # Families | Family Size |
| Married-Couple | 83 (97.7%) | 3.51 |
| Single Male/Father | 0 (0.0%) | - |
| Single Female/Mother | 2 (2.4%) | 3.00 |
| Total Families | 85 (100.0%) | 3.49 |
Median Household Size in Upper Stewartsville
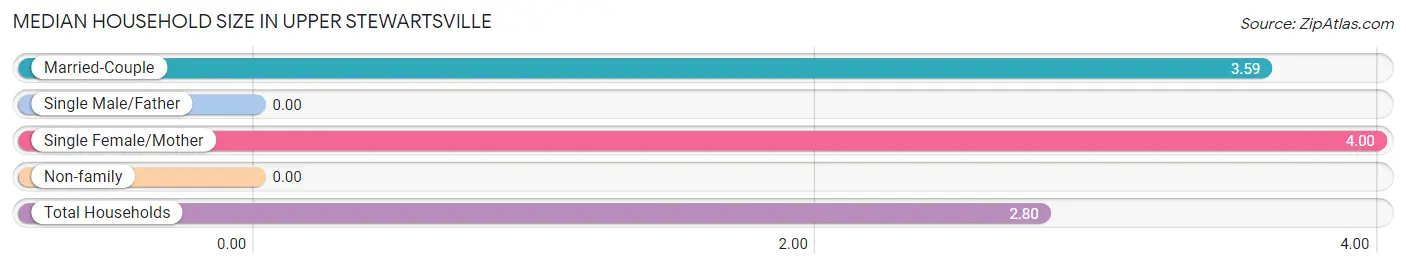
| Household Type | # Households | Household Size |
| Married-Couple | 83 (67.5%) | 3.59 |
| Single Male/Father | 0 (0.0%) | - |
| Single Female/Mother | 2 (1.6%) | 4.00 |
| Non-family | 38 (30.9%) | - |
| Total Households | 123 (100.0%) | 2.80 |
Household Size by Marriage Status in Upper Stewartsville
Out of a total of 123 households in Upper Stewartsville, 85 (69.1%) are family households, while 38 (30.9%) are nonfamily households. The most numerous type of family households are 2-person households, comprising 43, and the most common type of nonfamily households are 1-person households, comprising 38.
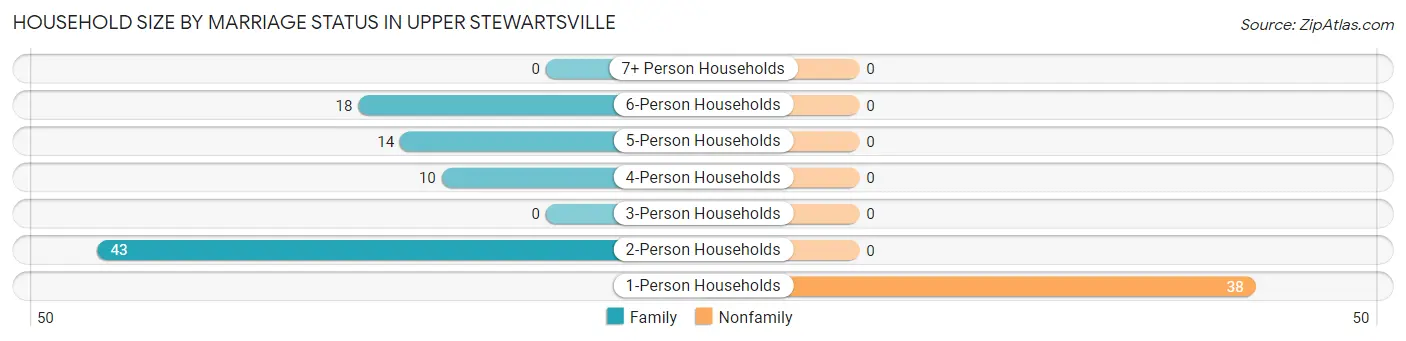
| Household Size | Family Households | Nonfamily Households |
| 1-Person Households | - | 38 (30.9%) |
| 2-Person Households | 43 (35.0%) | 0 (0.0%) |
| 3-Person Households | 0 (0.0%) | 0 (0.0%) |
| 4-Person Households | 10 (8.1%) | 0 (0.0%) |
| 5-Person Households | 14 (11.4%) | 0 (0.0%) |
| 6-Person Households | 18 (14.6%) | 0 (0.0%) |
| 7+ Person Households | 0 (0.0%) | 0 (0.0%) |
| Total | 85 (69.1%) | 38 (30.9%) |
Female Fertility in Upper Stewartsville
Fertility by Age in Upper Stewartsville
| Age Bracket | Women with Births | Births / 1,000 Women |
| 15 to 19 years | 0 (0.0%) | 0.0 |
| 20 to 34 years | 0 (0.0%) | 0.0 |
| 35 to 50 years | 0 (0.0%) | 0.0 |
| Total | 0 (0.0%) | 0.0 |
Fertility by Age by Marriage Status in Upper Stewartsville
| Age Bracket | Married | Unmarried |
| 15 to 19 years | 0 (0.0%) | 0 (0.0%) |
| 20 to 34 years | 0 (0.0%) | 0 (0.0%) |
| 35 to 50 years | 0 (0.0%) | 0 (0.0%) |
| Total | 0 (0.0%) | 0 (0.0%) |
Fertility by Education in Upper Stewartsville
| Educational Attainment | Women with Births | Births / 1,000 Women |
| Less than High School | 0 (0.0%) | 0.0 |
| High School Diploma | 0 (0.0%) | 0.0 |
| College or Associate's Degree | 0 (0.0%) | 0.0 |
| Bachelor's Degree | 0 (0.0%) | 0.0 |
| Graduate Degree | 0 (0.0%) | 0.0 |
| Total | 0 (0.0%) | 0.0 |
Fertility by Education by Marriage Status in Upper Stewartsville
| Educational Attainment | Married | Unmarried |
| Less than High School | 0 (0.0%) | 0 (0.0%) |
| High School Diploma | 0 (0.0%) | 0 (0.0%) |
| College or Associate's Degree | 0 (0.0%) | 0 (0.0%) |
| Bachelor's Degree | 0 (0.0%) | 0 (0.0%) |
| Graduate Degree | 0 (0.0%) | 0 (0.0%) |
| Total | 0 (0.0%) | 0 (0.0%) |
Employment Characteristics in Upper Stewartsville
Employment by Class of Employer in Upper Stewartsville
Among the 153 employed individuals in Upper Stewartsville, private company employees (108 | 70.6%), local government employees (31 | 20.3%), and state government employees (14 | 9.1%) make up the most common classes of employment.
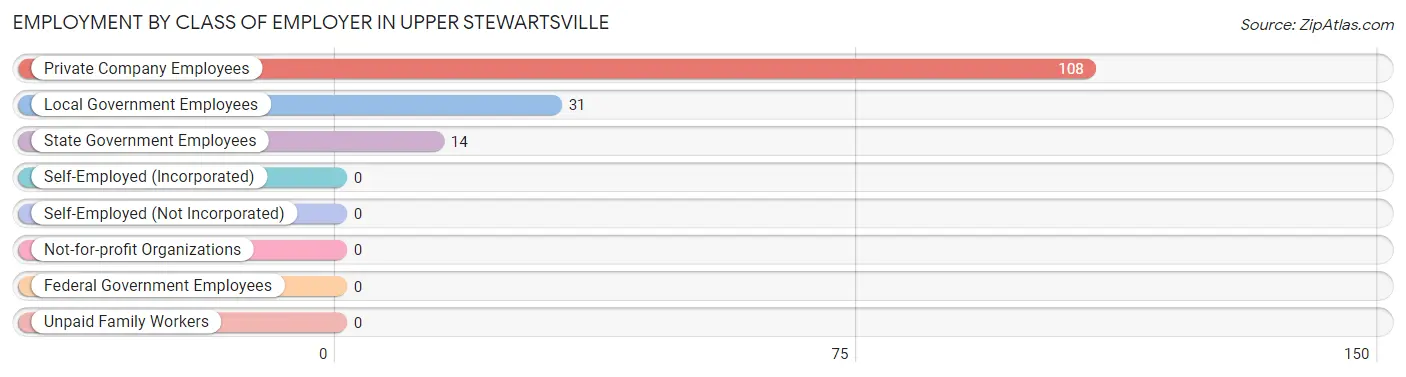
| Employer Class | # Employees | % Employees |
| Private Company Employees | 108 | 70.6% |
| Self-Employed (Incorporated) | 0 | 0.0% |
| Self-Employed (Not Incorporated) | 0 | 0.0% |
| Not-for-profit Organizations | 0 | 0.0% |
| Local Government Employees | 31 | 20.3% |
| State Government Employees | 14 | 9.1% |
| Federal Government Employees | 0 | 0.0% |
| Unpaid Family Workers | 0 | 0.0% |
| Total | 153 | 100.0% |
Employment Status by Age in Upper Stewartsville
According to the labor force statistics for Upper Stewartsville, out of the total population over 16 years of age (292), 57.5% or 168 individuals are in the labor force, with 8.9% or 15 of them unemployed. The age group with the highest labor force participation rate is 25 to 29 years, with 100.0% or 39 individuals in the labor force. Within the labor force, the 25 to 29 years age range has the highest percentage of unemployed individuals, with 38.5% or 15 of them being unemployed.
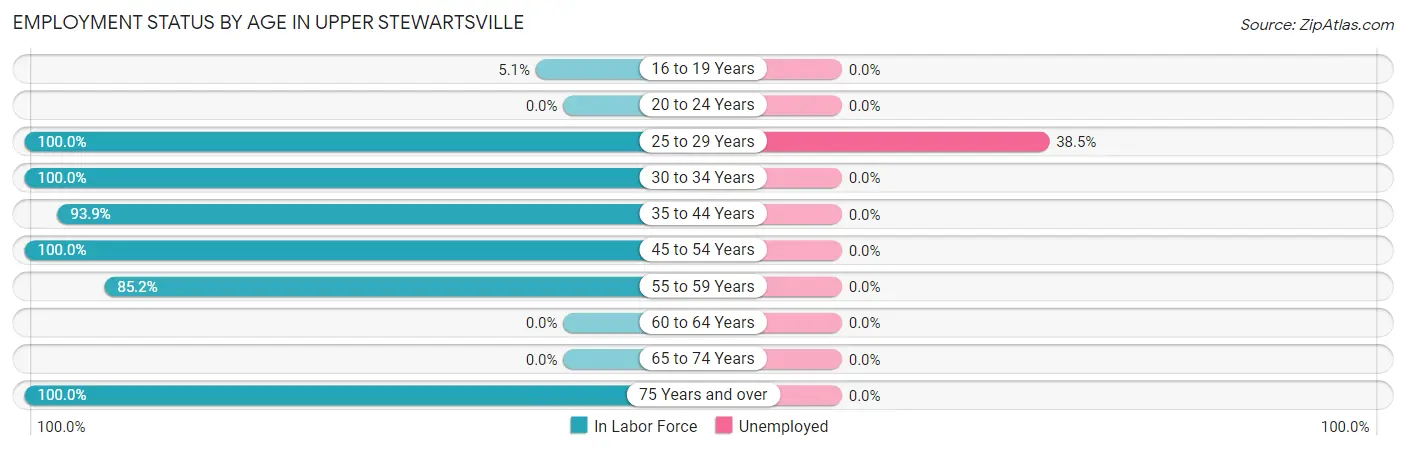
| Age Bracket | In Labor Force | Unemployed |
| 16 to 19 Years | 2 (5.1%) | 0 (0.0%) |
| 20 to 24 Years | 0 (0.0%) | 0 (0.0%) |
| 25 to 29 Years | 39 (100.0%) | 15 (38.5%) |
| 30 to 34 Years | 15 (100.0%) | 0 (0.0%) |
| 35 to 44 Years | 31 (93.9%) | 0 (0.0%) |
| 45 to 54 Years | 2 (100.0%) | 0 (0.0%) |
| 55 to 59 Years | 46 (85.2%) | 0 (0.0%) |
| 60 to 64 Years | 0 (0.0%) | 0 (0.0%) |
| 65 to 74 Years | 0 (0.0%) | 0 (0.0%) |
| 75 Years and over | 33 (100.0%) | 0 (0.0%) |
| Total | 168 (57.5%) | 15 (8.9%) |
Employment Status by Educational Attainment in Upper Stewartsville
According to labor force statistics for Upper Stewartsville, 84.7% of individuals (133) out of the total population between 25 and 64 years of age (157) are in the labor force, with 11.3% or 15 of them being unemployed. The group with the highest labor force participation rate are those with the educational attainment of college / associate degree, with 100.0% or 31 individuals in the labor force. Within the labor force, individuals with bachelor's degree or higher education have the highest percentage of unemployment, with 15.8% or 15 of them being unemployed.
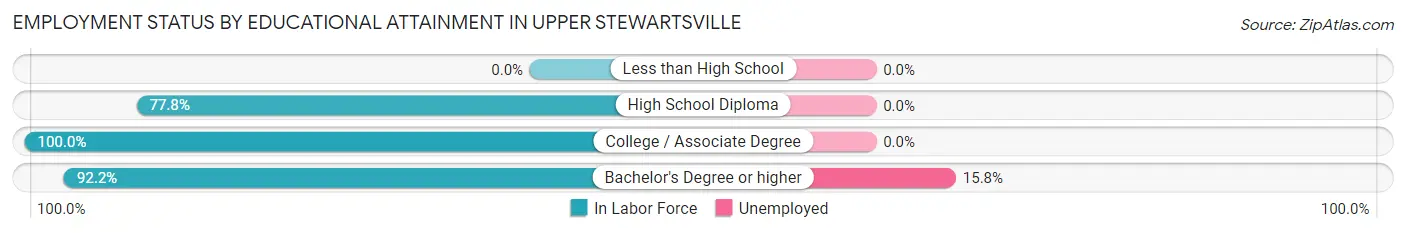
| Educational Attainment | In Labor Force | Unemployed |
| Less than High School | 0 (0.0%) | 0 (0.0%) |
| High School Diploma | 7 (77.8%) | 0 (0.0%) |
| College / Associate Degree | 31 (100.0%) | 0 (0.0%) |
| Bachelor's Degree or higher | 95 (92.2%) | 16 (15.8%) |
| Total | 133 (84.7%) | 18 (11.3%) |
Employment Occupations by Sex in Upper Stewartsville
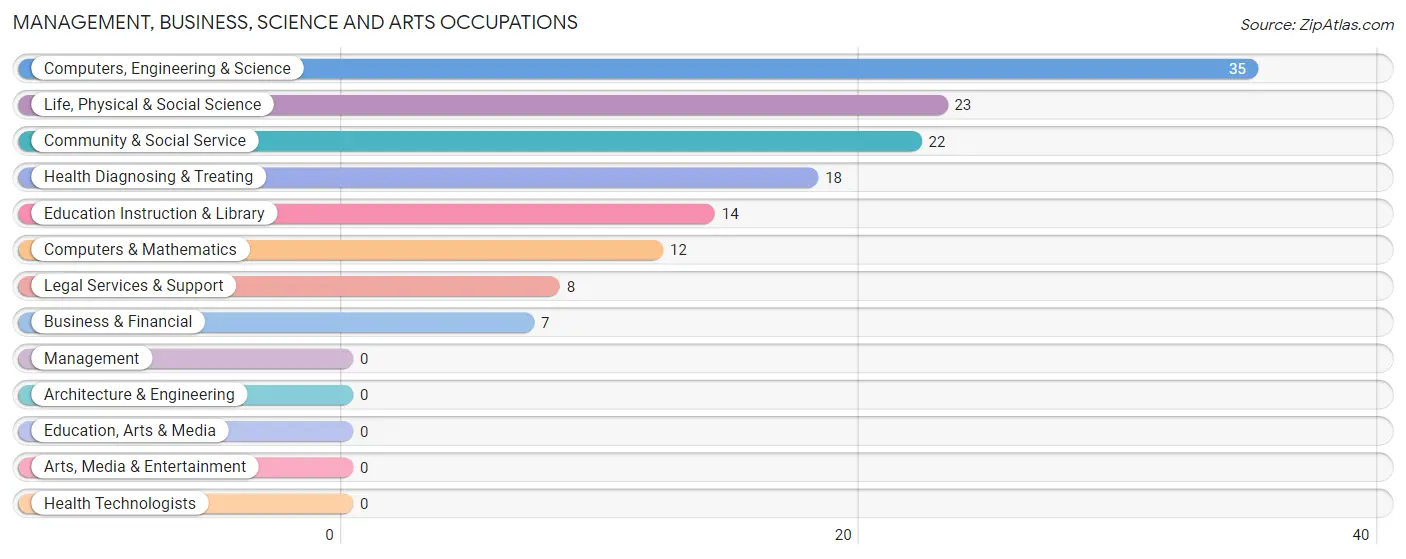
Management, Business, Science and Arts Occupations
The most common Management, Business, Science and Arts occupations in Upper Stewartsville are Computers, Engineering & Science (35 | 22.9%), Life, Physical & Social Science (23 | 15.0%), Community & Social Service (22 | 14.4%), Health Diagnosing & Treating (18 | 11.8%), and Education Instruction & Library (14 | 9.1%).
Management, Business, Science and Arts Occupations by Sex
Within the Management, Business, Science and Arts occupations in Upper Stewartsville, the most male-oriented occupations are Life, Physical & Social Science (100.0%), Community & Social Service (100.0%), and Legal Services & Support (100.0%), while the most female-oriented occupations are Business & Financial (100.0%), Health Diagnosing & Treating (100.0%), and Computers & Mathematics (83.3%).
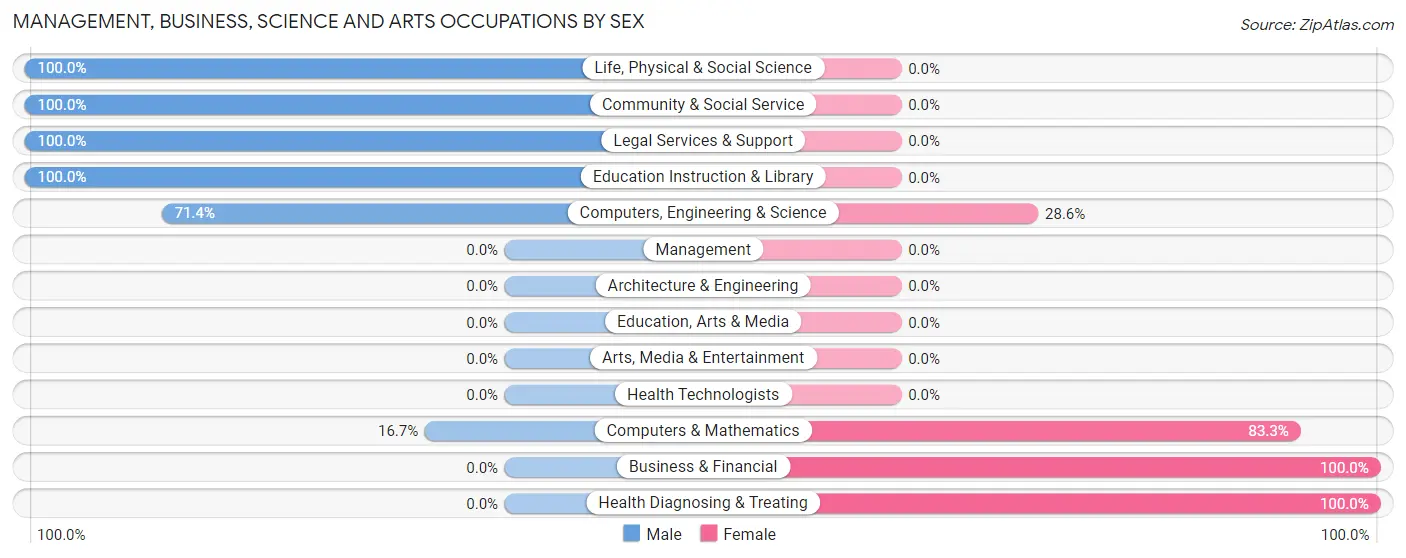
| Occupation | Male | Female |
| Management | 0 (0.0%) | 0 (0.0%) |
| Business & Financial | 0 (0.0%) | 7 (100.0%) |
| Computers, Engineering & Science | 25 (71.4%) | 10 (28.6%) |
| Computers & Mathematics | 2 (16.7%) | 10 (83.3%) |
| Architecture & Engineering | 0 (0.0%) | 0 (0.0%) |
| Life, Physical & Social Science | 23 (100.0%) | 0 (0.0%) |
| Community & Social Service | 22 (100.0%) | 0 (0.0%) |
| Education, Arts & Media | 0 (0.0%) | 0 (0.0%) |
| Legal Services & Support | 8 (100.0%) | 0 (0.0%) |
| Education Instruction & Library | 14 (100.0%) | 0 (0.0%) |
| Arts, Media & Entertainment | 0 (0.0%) | 0 (0.0%) |
| Health Diagnosing & Treating | 0 (0.0%) | 18 (100.0%) |
| Health Technologists | 0 (0.0%) | 0 (0.0%) |
| Total (Category) | 47 (57.3%) | 35 (42.7%) |
| Total (Overall) | 104 (68.0%) | 49 (32.0%) |
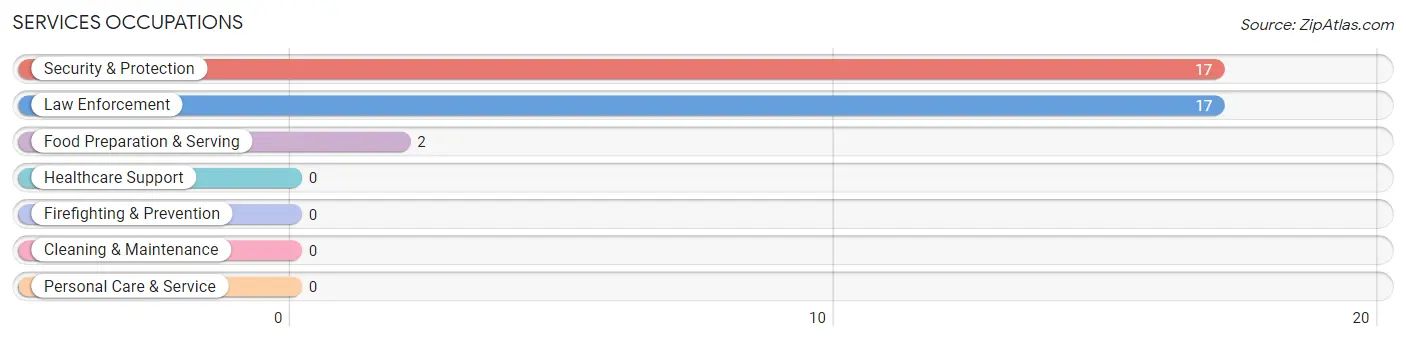
Services Occupations
The most common Services occupations in Upper Stewartsville are Security & Protection (17 | 11.1%), Law Enforcement (17 | 11.1%), and Food Preparation & Serving (2 | 1.3%).
Services Occupations by Sex
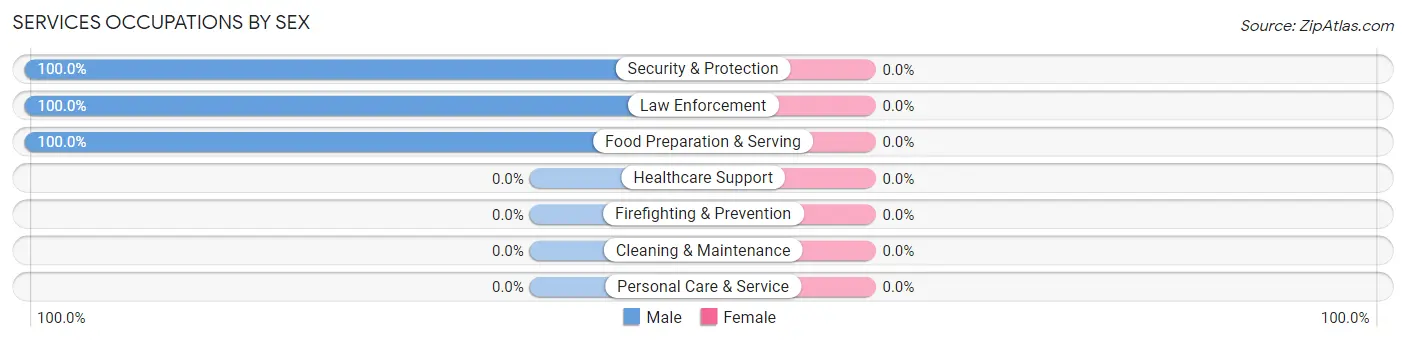
| Occupation | Male | Female |
| Healthcare Support | 0 (0.0%) | 0 (0.0%) |
| Security & Protection | 17 (100.0%) | 0 (0.0%) |
| Firefighting & Prevention | 0 (0.0%) | 0 (0.0%) |
| Law Enforcement | 17 (100.0%) | 0 (0.0%) |
| Food Preparation & Serving | 2 (100.0%) | 0 (0.0%) |
| Cleaning & Maintenance | 0 (0.0%) | 0 (0.0%) |
| Personal Care & Service | 0 (0.0%) | 0 (0.0%) |
| Total (Category) | 19 (100.0%) | 0 (0.0%) |
| Total (Overall) | 104 (68.0%) | 49 (32.0%) |
Sales and Office Occupations
The most common Sales and Office occupations in Upper Stewartsville are , and Office & Administration (14 | 9.1%).
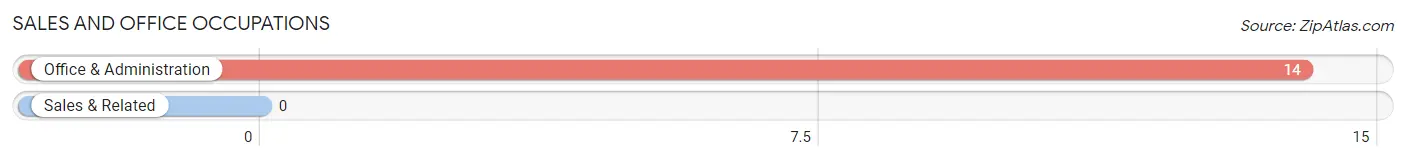
Sales and Office Occupations by Sex

| Occupation | Male | Female |
| Sales & Related | 0 (0.0%) | 0 (0.0%) |
| Office & Administration | 0 (0.0%) | 14 (100.0%) |
| Total (Category) | 0 (0.0%) | 14 (100.0%) |
| Total (Overall) | 104 (68.0%) | 49 (32.0%) |
Natural Resources, Construction and Maintenance Occupations
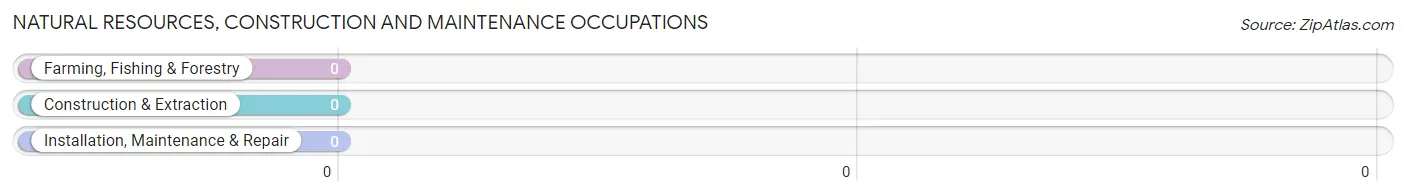
Natural Resources, Construction and Maintenance Occupations by Sex
| Occupation | Male | Female |
| Farming, Fishing & Forestry | 0 (0.0%) | 0 (0.0%) |
| Construction & Extraction | 0 (0.0%) | 0 (0.0%) |
| Installation, Maintenance & Repair | 0 (0.0%) | 0 (0.0%) |
| Total (Category) | 0 (0.0%) | 0 (0.0%) |
| Total (Overall) | 104 (68.0%) | 49 (32.0%) |
Production, Transportation and Moving Occupations
The most common Production, Transportation and Moving occupations in Upper Stewartsville are , and Transportation (38 | 24.8%).
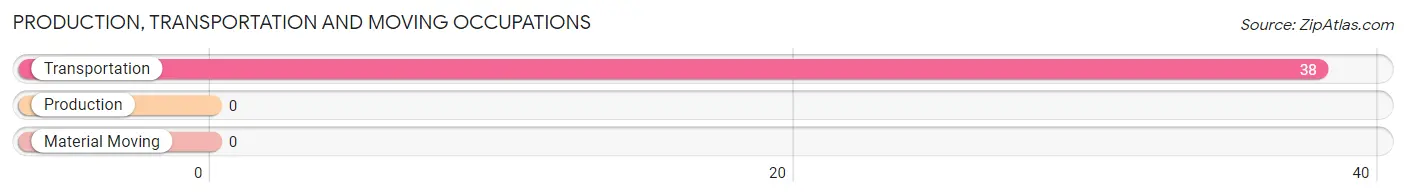
Production, Transportation and Moving Occupations by Sex
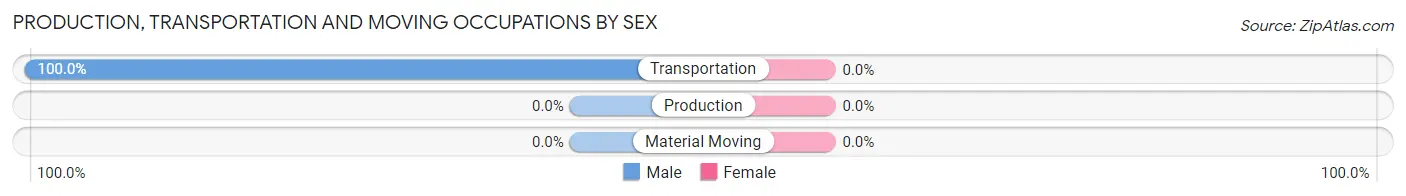
| Occupation | Male | Female |
| Production | 0 (0.0%) | 0 (0.0%) |
| Transportation | 38 (100.0%) | 0 (0.0%) |
| Material Moving | 0 (0.0%) | 0 (0.0%) |
| Total (Category) | 38 (100.0%) | 0 (0.0%) |
| Total (Overall) | 104 (68.0%) | 49 (32.0%) |
Employment Industries by Sex in Upper Stewartsville
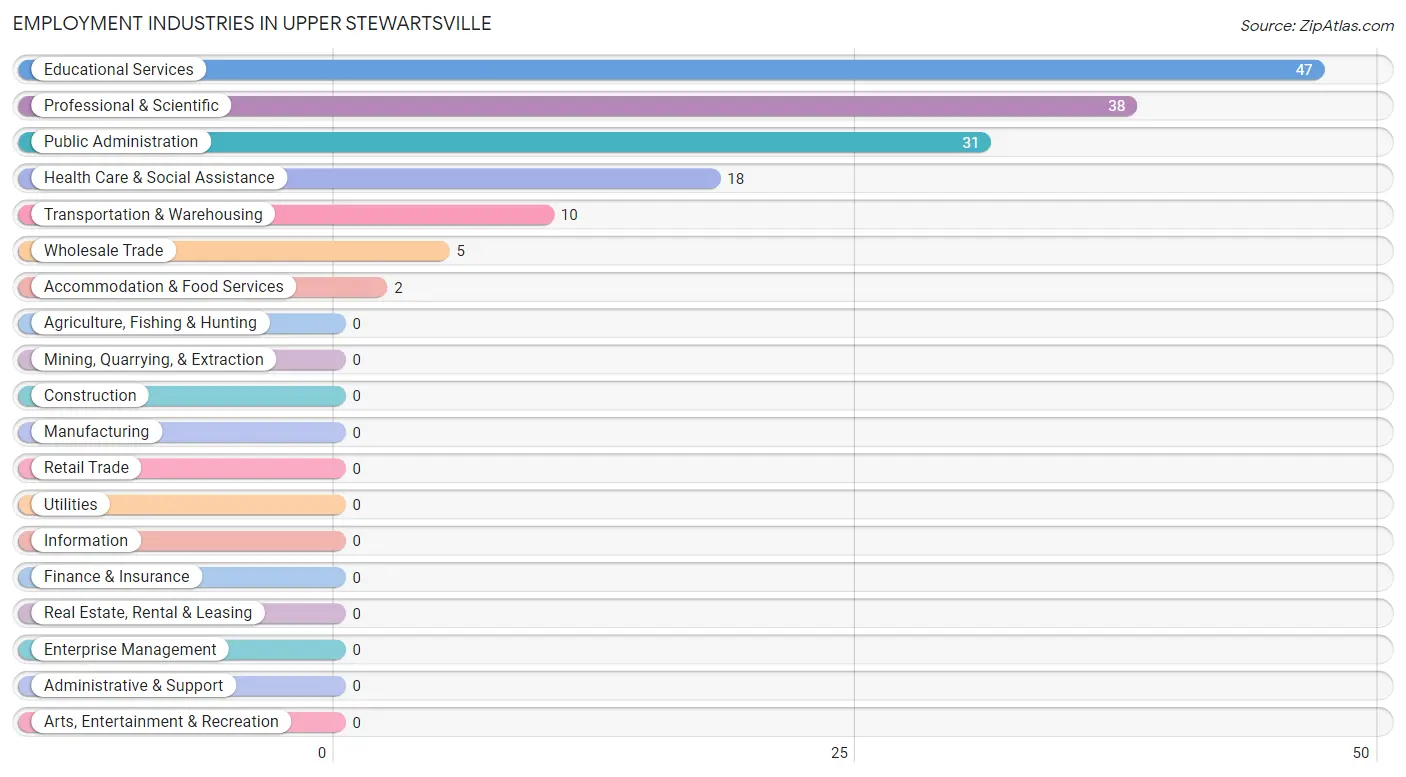
Employment Industries in Upper Stewartsville
The major employment industries in Upper Stewartsville include Educational Services (47 | 30.7%), Professional & Scientific (38 | 24.8%), Public Administration (31 | 20.3%), Health Care & Social Assistance (18 | 11.8%), and Transportation & Warehousing (10 | 6.5%).
Employment Industries by Sex in Upper Stewartsville
The Upper Stewartsville industries that see more men than women are Wholesale Trade (100.0%), Educational Services (100.0%), and Accommodation & Food Services (100.0%), whereas the industries that tend to have a higher number of women are Transportation & Warehousing (100.0%), Health Care & Social Assistance (100.0%), and Public Administration (45.2%).
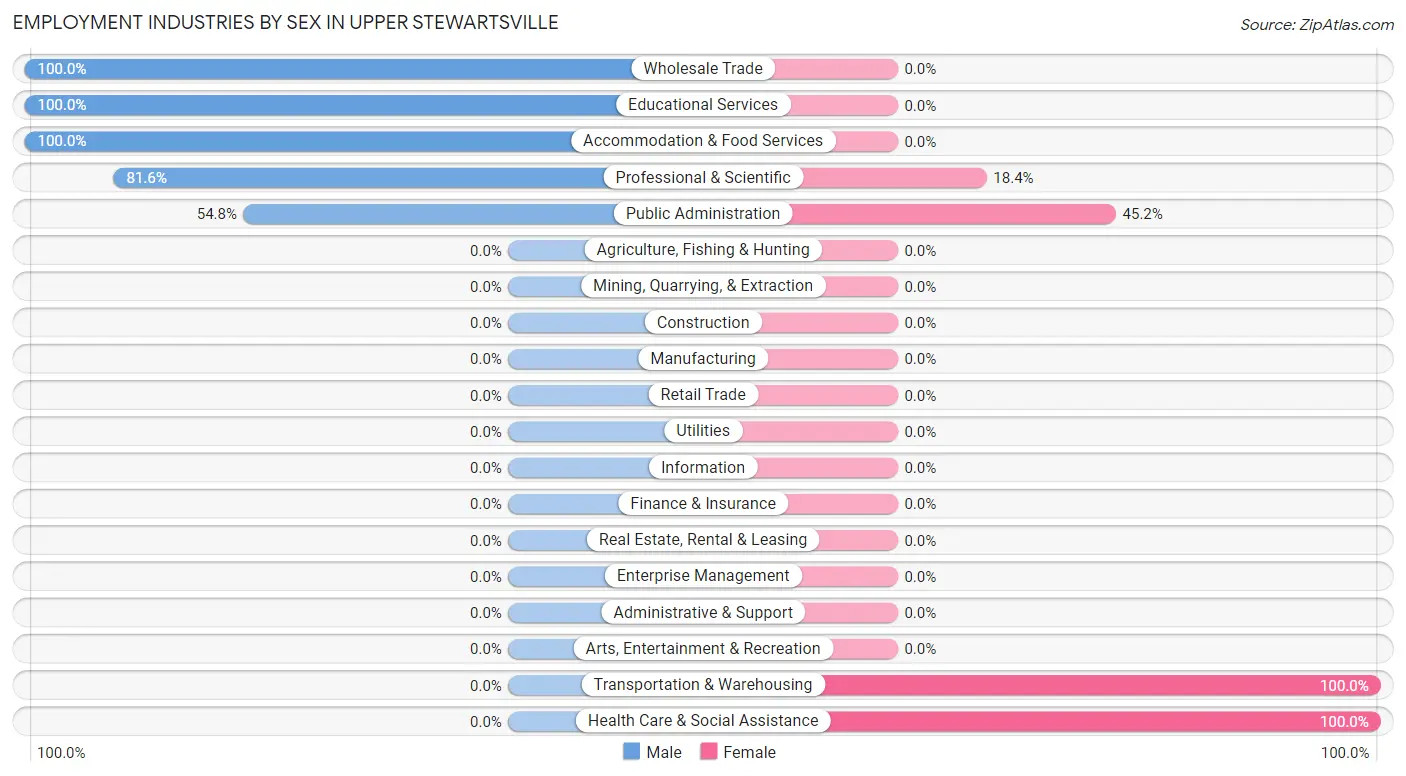
| Industry | Male | Female |
| Agriculture, Fishing & Hunting | 0 (0.0%) | 0 (0.0%) |
| Mining, Quarrying, & Extraction | 0 (0.0%) | 0 (0.0%) |
| Construction | 0 (0.0%) | 0 (0.0%) |
| Manufacturing | 0 (0.0%) | 0 (0.0%) |
| Wholesale Trade | 5 (100.0%) | 0 (0.0%) |
| Retail Trade | 0 (0.0%) | 0 (0.0%) |
| Transportation & Warehousing | 0 (0.0%) | 10 (100.0%) |
| Utilities | 0 (0.0%) | 0 (0.0%) |
| Information | 0 (0.0%) | 0 (0.0%) |
| Finance & Insurance | 0 (0.0%) | 0 (0.0%) |
| Real Estate, Rental & Leasing | 0 (0.0%) | 0 (0.0%) |
| Professional & Scientific | 31 (81.6%) | 7 (18.4%) |
| Enterprise Management | 0 (0.0%) | 0 (0.0%) |
| Administrative & Support | 0 (0.0%) | 0 (0.0%) |
| Educational Services | 47 (100.0%) | 0 (0.0%) |
| Health Care & Social Assistance | 0 (0.0%) | 18 (100.0%) |
| Arts, Entertainment & Recreation | 0 (0.0%) | 0 (0.0%) |
| Accommodation & Food Services | 2 (100.0%) | 0 (0.0%) |
| Public Administration | 17 (54.8%) | 14 (45.2%) |
| Total | 104 (68.0%) | 49 (32.0%) |
Education in Upper Stewartsville
School Enrollment in Upper Stewartsville
The most common levels of schooling among the 122 students in Upper Stewartsville are college / undergraduate (40 | 32.8%), high school (31 | 25.4%), and elementary school (22 | 18.0%).
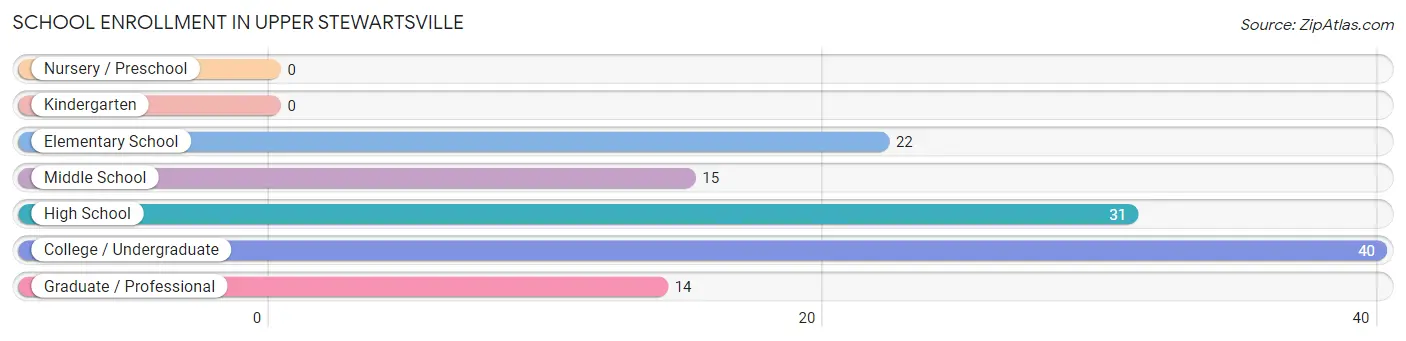
| School Level | # Students | % Students |
| Nursery / Preschool | 0 | 0.0% |
| Kindergarten | 0 | 0.0% |
| Elementary School | 22 | 18.0% |
| Middle School | 15 | 12.3% |
| High School | 31 | 25.4% |
| College / Undergraduate | 40 | 32.8% |
| Graduate / Professional | 14 | 11.5% |
| Total | 122 | 100.0% |
School Enrollment by Age by Funding Source in Upper Stewartsville
Out of a total of 122 students who are enrolled in schools in Upper Stewartsville, 54 (44.3%) attend a private institution, while the remaining 68 (55.7%) are enrolled in public schools. The age group of 18 to 19 year olds has the highest likelihood of being enrolled in private schools, with 23 (100.0% in the age bracket) enrolled. Conversely, the age group of 5 to 9 year old has the lowest likelihood of being enrolled in a private school, with 22 (100.0% in the age bracket) attending a public institution.
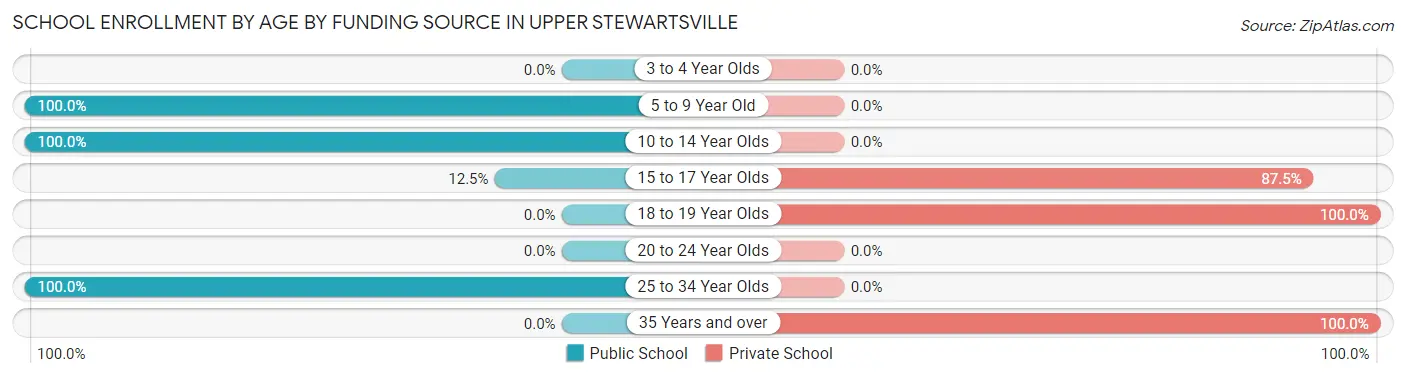
| Age Bracket | Public School | Private School |
| 3 to 4 Year Olds | 0 (0.0%) | 0 (0.0%) |
| 5 to 9 Year Old | 22 (100.0%) | 0 (0.0%) |
| 10 to 14 Year Olds | 30 (100.0%) | 0 (0.0%) |
| 15 to 17 Year Olds | 2 (12.5%) | 14 (87.5%) |
| 18 to 19 Year Olds | 0 (0.0%) | 23 (100.0%) |
| 20 to 24 Year Olds | 0 (0.0%) | 0 (0.0%) |
| 25 to 34 Year Olds | 14 (100.0%) | 0 (0.0%) |
| 35 Years and over | 0 (0.0%) | 17 (100.0%) |
| Total | 68 (55.7%) | 54 (44.3%) |
Educational Attainment by Field of Study in Upper Stewartsville
Physical & health sciences (51 | 29.1%), business (33 | 18.9%), computers & mathematics (32 | 18.3%), bio, nature & agricultural (15 | 8.6%), and science & technology (15 | 8.6%) are the most common fields of study among 175 individuals in Upper Stewartsville who have obtained a bachelor's degree or higher.

| Field of Study | # Graduates | % Graduates |
| Computers & Mathematics | 32 | 18.3% |
| Bio, Nature & Agricultural | 15 | 8.6% |
| Physical & Health Sciences | 51 | 29.1% |
| Psychology | 0 | 0.0% |
| Social Sciences | 6 | 3.4% |
| Engineering | 0 | 0.0% |
| Multidisciplinary Studies | 0 | 0.0% |
| Science & Technology | 15 | 8.6% |
| Business | 33 | 18.9% |
| Education | 8 | 4.6% |
| Literature & Languages | 0 | 0.0% |
| Liberal Arts & History | 0 | 0.0% |
| Visual & Performing Arts | 15 | 8.6% |
| Communications | 0 | 0.0% |
| Arts & Humanities | 0 | 0.0% |
| Total | 175 | 100.0% |
Transportation & Commute in Upper Stewartsville
Vehicle Availability by Sex in Upper Stewartsville
The most prevalent vehicle ownership categories in Upper Stewartsville are males with 2 vehicles (67, accounting for 64.4%) and females with 2 vehicles (31, making up 136.7%).
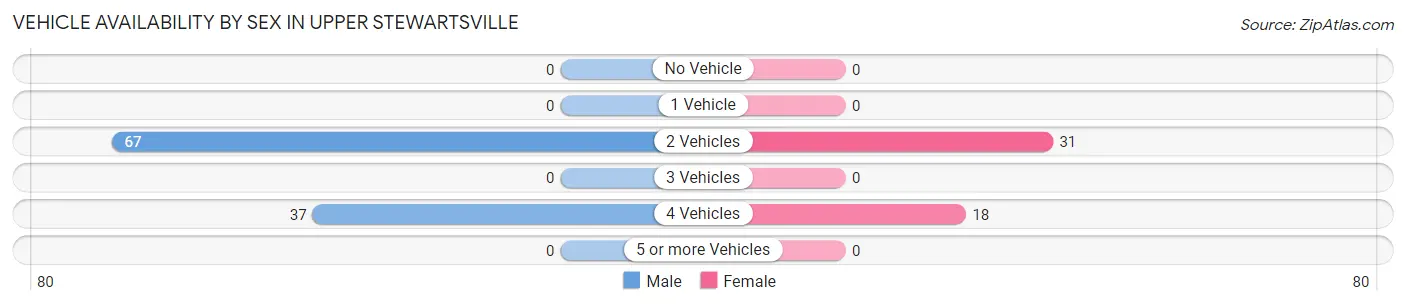
| Vehicles Available | Male | Female |
| No Vehicle | 0 (0.0%) | 0 (0.0%) |
| 1 Vehicle | 0 (0.0%) | 0 (0.0%) |
| 2 Vehicles | 67 (64.4%) | 31 (63.3%) |
| 3 Vehicles | 0 (0.0%) | 0 (0.0%) |
| 4 Vehicles | 37 (35.6%) | 18 (36.7%) |
| 5 or more Vehicles | 0 (0.0%) | 0 (0.0%) |
| Total | 104 (100.0%) | 49 (100.0%) |
Commute Time in Upper Stewartsville
The most frequently occuring commute durations in Upper Stewartsville are 20 to 24 minutes (47 commuters, 38.8%), 25 to 29 minutes (33 commuters, 27.3%), and 60 to 89 minutes (22 commuters, 18.2%).
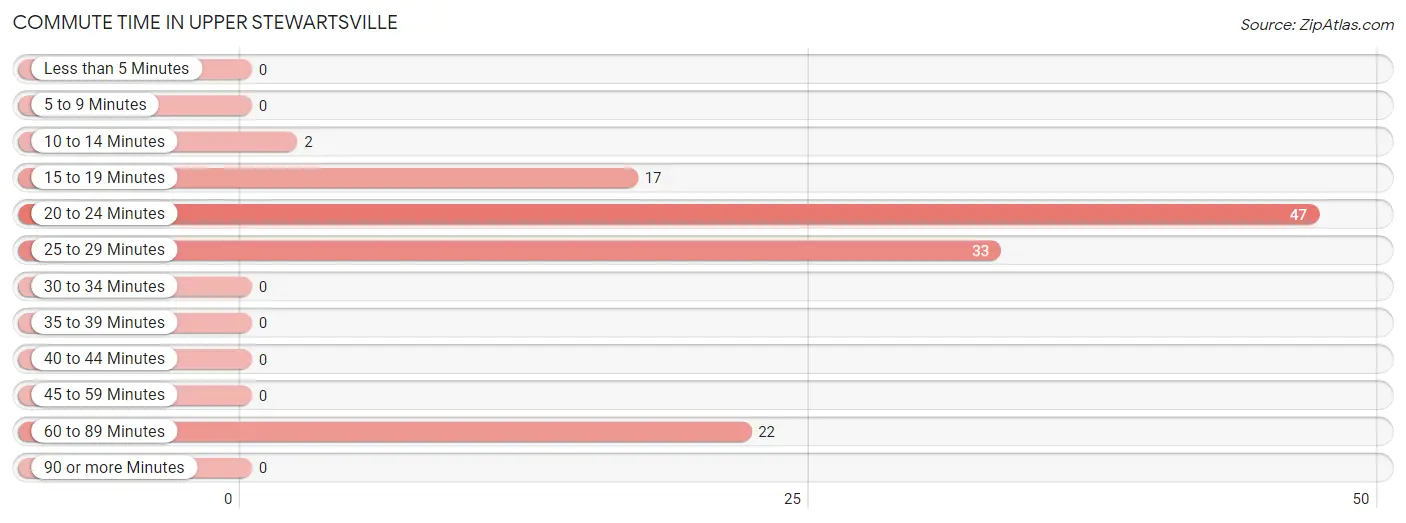
| Commute Time | # Commuters | % Commuters |
| Less than 5 Minutes | 0 | 0.0% |
| 5 to 9 Minutes | 0 | 0.0% |
| 10 to 14 Minutes | 2 | 1.7% |
| 15 to 19 Minutes | 17 | 14.1% |
| 20 to 24 Minutes | 47 | 38.8% |
| 25 to 29 Minutes | 33 | 27.3% |
| 30 to 34 Minutes | 0 | 0.0% |
| 35 to 39 Minutes | 0 | 0.0% |
| 40 to 44 Minutes | 0 | 0.0% |
| 45 to 59 Minutes | 0 | 0.0% |
| 60 to 89 Minutes | 22 | 18.2% |
| 90 or more Minutes | 0 | 0.0% |
Commute Time by Sex in Upper Stewartsville
The most common commute times in Upper Stewartsville are 20 to 24 minutes (33 commuters, 36.7%) for males and 20 to 24 minutes (14 commuters, 45.2%) for females.
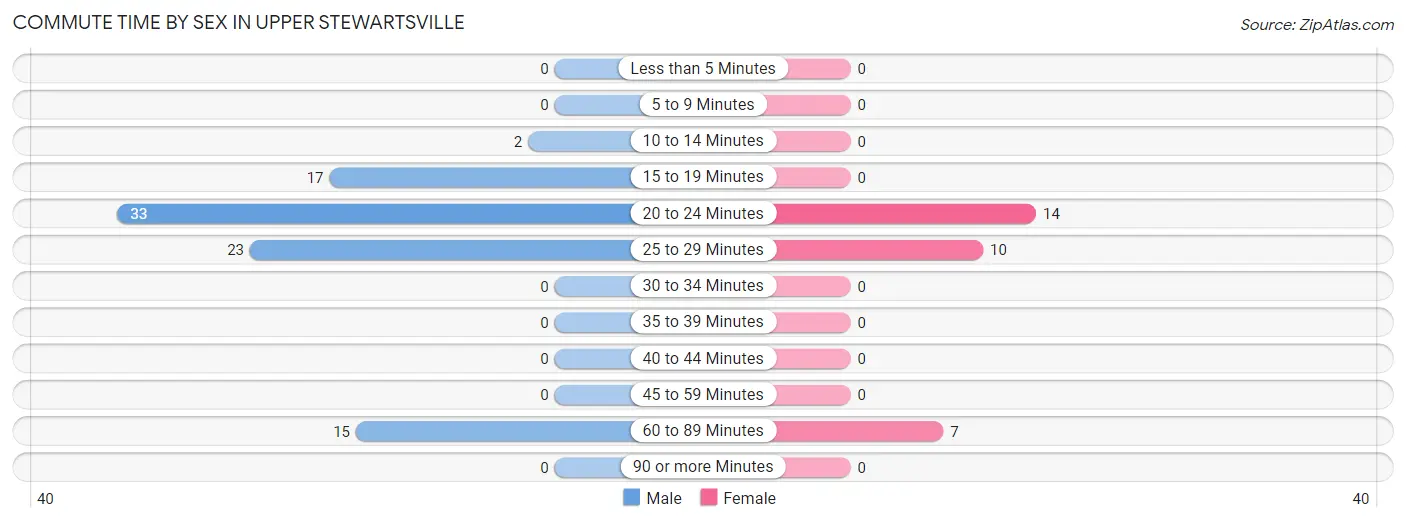
| Commute Time | Male | Female |
| Less than 5 Minutes | 0 (0.0%) | 0 (0.0%) |
| 5 to 9 Minutes | 0 (0.0%) | 0 (0.0%) |
| 10 to 14 Minutes | 2 (2.2%) | 0 (0.0%) |
| 15 to 19 Minutes | 17 (18.9%) | 0 (0.0%) |
| 20 to 24 Minutes | 33 (36.7%) | 14 (45.2%) |
| 25 to 29 Minutes | 23 (25.6%) | 10 (32.3%) |
| 30 to 34 Minutes | 0 (0.0%) | 0 (0.0%) |
| 35 to 39 Minutes | 0 (0.0%) | 0 (0.0%) |
| 40 to 44 Minutes | 0 (0.0%) | 0 (0.0%) |
| 45 to 59 Minutes | 0 (0.0%) | 0 (0.0%) |
| 60 to 89 Minutes | 15 (16.7%) | 7 (22.6%) |
| 90 or more Minutes | 0 (0.0%) | 0 (0.0%) |
Time of Departure to Work by Sex in Upper Stewartsville
The most frequent times of departure to work in Upper Stewartsville are 8:00 AM to 8:29 AM (50, 55.6%) for males and 7:00 AM to 7:29 AM (14, 45.2%) for females.
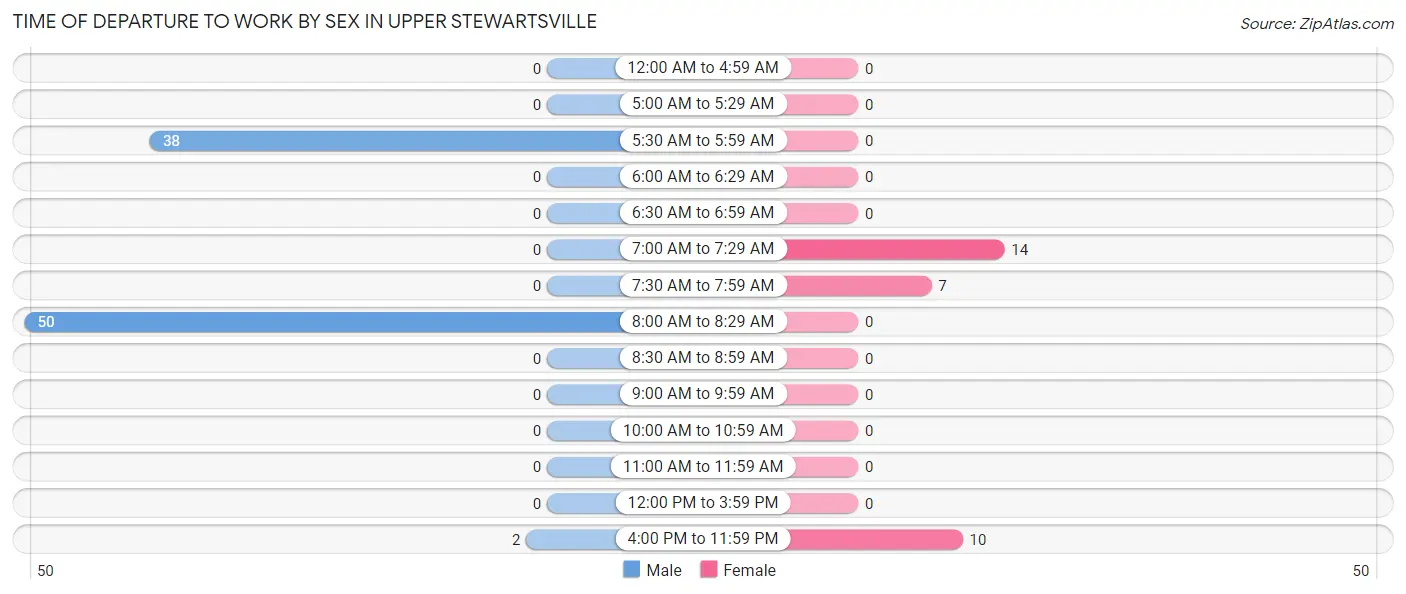
| Time of Departure | Male | Female |
| 12:00 AM to 4:59 AM | 0 (0.0%) | 0 (0.0%) |
| 5:00 AM to 5:29 AM | 0 (0.0%) | 0 (0.0%) |
| 5:30 AM to 5:59 AM | 38 (42.2%) | 0 (0.0%) |
| 6:00 AM to 6:29 AM | 0 (0.0%) | 0 (0.0%) |
| 6:30 AM to 6:59 AM | 0 (0.0%) | 0 (0.0%) |
| 7:00 AM to 7:29 AM | 0 (0.0%) | 14 (45.2%) |
| 7:30 AM to 7:59 AM | 0 (0.0%) | 7 (22.6%) |
| 8:00 AM to 8:29 AM | 50 (55.6%) | 0 (0.0%) |
| 8:30 AM to 8:59 AM | 0 (0.0%) | 0 (0.0%) |
| 9:00 AM to 9:59 AM | 0 (0.0%) | 0 (0.0%) |
| 10:00 AM to 10:59 AM | 0 (0.0%) | 0 (0.0%) |
| 11:00 AM to 11:59 AM | 0 (0.0%) | 0 (0.0%) |
| 12:00 PM to 3:59 PM | 0 (0.0%) | 0 (0.0%) |
| 4:00 PM to 11:59 PM | 2 (2.2%) | 10 (32.3%) |
| Total | 90 (100.0%) | 31 (100.0%) |
Housing Occupancy in Upper Stewartsville
Occupancy by Ownership in Upper Stewartsville
Of the total 123 dwellings in Upper Stewartsville, owner-occupied units account for 116 (94.3%), while renter-occupied units make up 7 (5.7%).
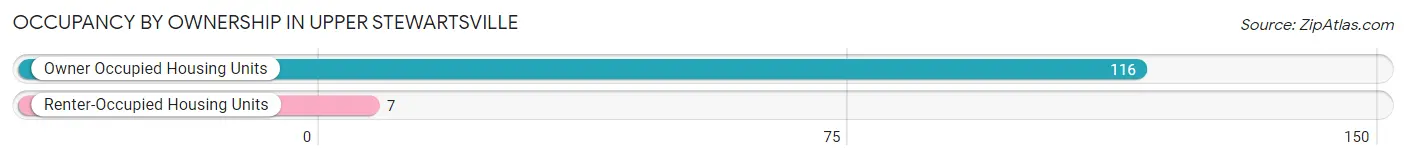
| Occupancy | # Housing Units | % Housing Units |
| Owner Occupied Housing Units | 116 | 94.3% |
| Renter-Occupied Housing Units | 7 | 5.7% |
| Total Occupied Housing Units | 123 | 100.0% |
Occupancy by Household Size in Upper Stewartsville
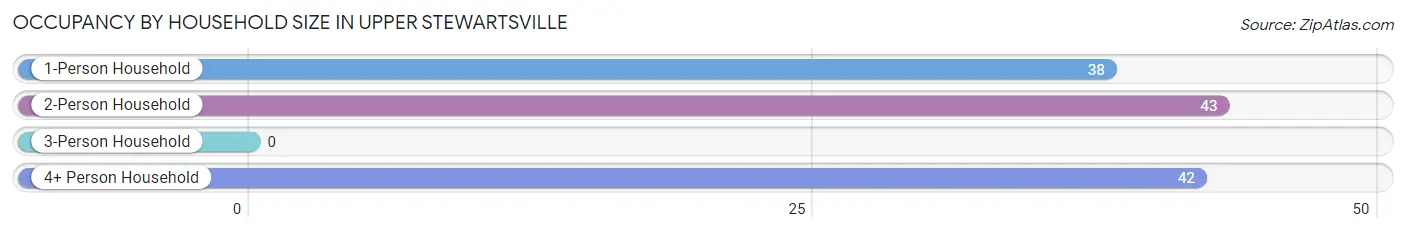
| Household Size | # Housing Units | % Housing Units |
| 1-Person Household | 38 | 30.9% |
| 2-Person Household | 43 | 35.0% |
| 3-Person Household | 0 | 0.0% |
| 4+ Person Household | 42 | 34.2% |
| Total Housing Units | 123 | 100.0% |
Occupancy by Ownership by Household Size in Upper Stewartsville
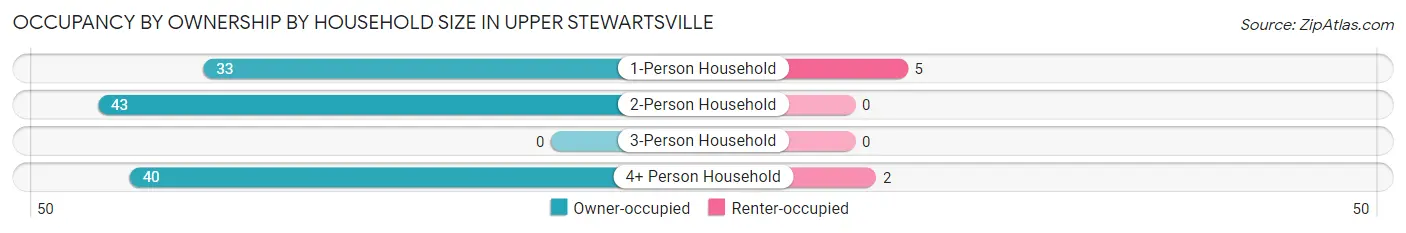
| Household Size | Owner-occupied | Renter-occupied |
| 1-Person Household | 33 (86.8%) | 5 (13.2%) |
| 2-Person Household | 43 (100.0%) | 0 (0.0%) |
| 3-Person Household | 0 (0.0%) | 0 (0.0%) |
| 4+ Person Household | 40 (95.2%) | 2 (4.8%) |
| Total Housing Units | 116 (94.3%) | 7 (5.7%) |
Occupancy by Educational Attainment in Upper Stewartsville
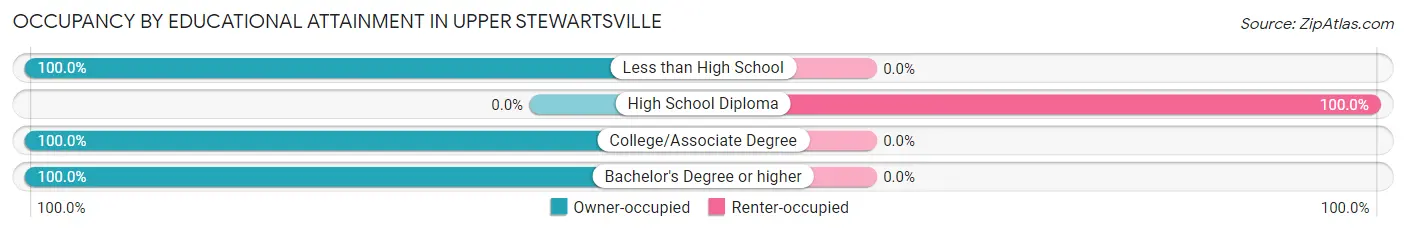
| Household Size | Owner-occupied | Renter-occupied |
| Less than High School | 21 (100.0%) | 0 (0.0%) |
| High School Diploma | 0 (0.0%) | 7 (100.0%) |
| College/Associate Degree | 21 (100.0%) | 0 (0.0%) |
| Bachelor's Degree or higher | 74 (100.0%) | 0 (0.0%) |
Occupancy by Age of Householder in Upper Stewartsville
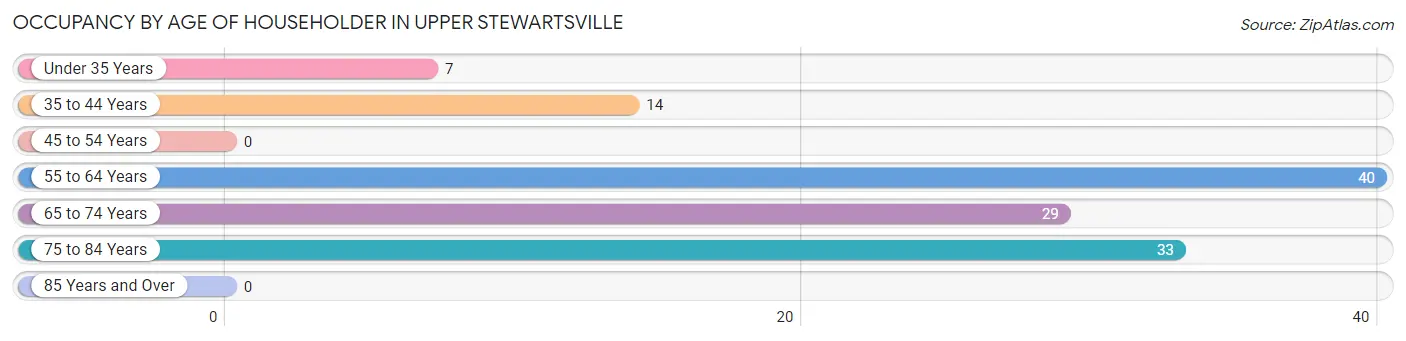
| Age Bracket | # Households | % Households |
| Under 35 Years | 7 | 5.7% |
| 35 to 44 Years | 14 | 11.4% |
| 45 to 54 Years | 0 | 0.0% |
| 55 to 64 Years | 40 | 32.5% |
| 65 to 74 Years | 29 | 23.6% |
| 75 to 84 Years | 33 | 26.8% |
| 85 Years and Over | 0 | 0.0% |
| Total | 123 | 100.0% |
Housing Finances in Upper Stewartsville
Median Income by Occupancy in Upper Stewartsville
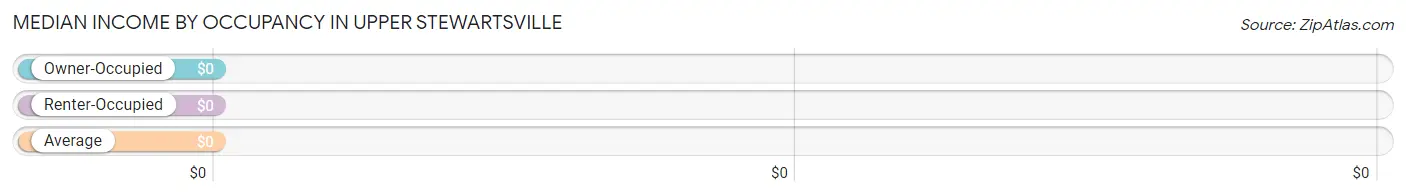
| Occupancy Type | # Households | Median Income |
| Owner-Occupied | 116 (94.3%) | $0 |
| Renter-Occupied | 7 (5.7%) | $0 |
| Average | 123 (100.0%) | $0 |
Occupancy by Householder Income Bracket in Upper Stewartsville
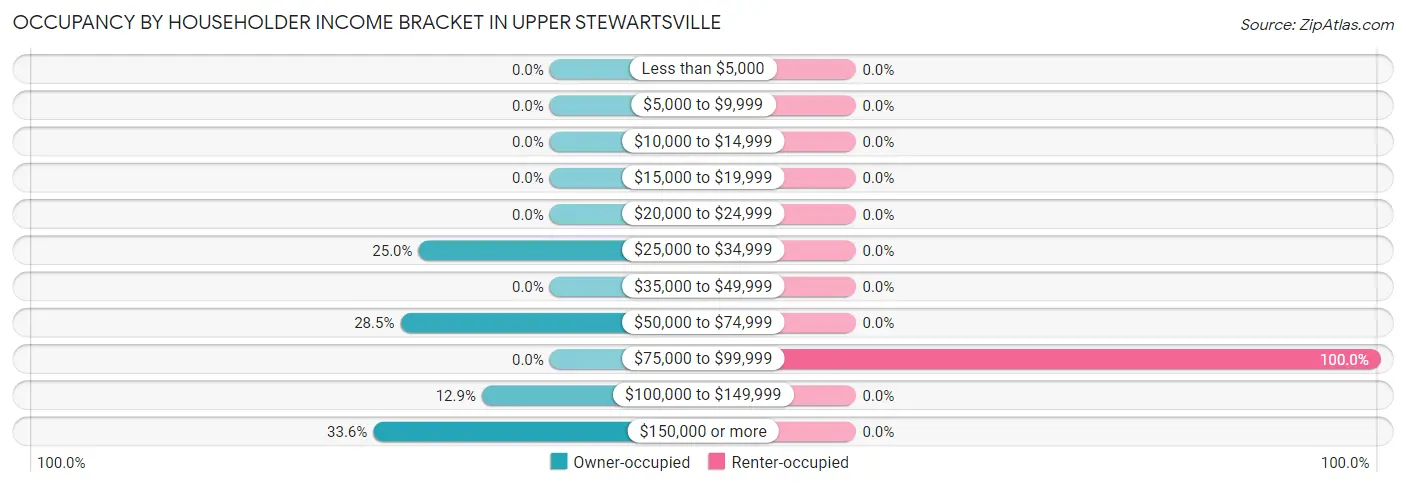
| Income Bracket | Owner-occupied | Renter-occupied |
| Less than $5,000 | 0 (0.0%) | 0 (0.0%) |
| $5,000 to $9,999 | 0 (0.0%) | 0 (0.0%) |
| $10,000 to $14,999 | 0 (0.0%) | 0 (0.0%) |
| $15,000 to $19,999 | 0 (0.0%) | 0 (0.0%) |
| $20,000 to $24,999 | 0 (0.0%) | 0 (0.0%) |
| $25,000 to $34,999 | 29 (25.0%) | 0 (0.0%) |
| $35,000 to $49,999 | 0 (0.0%) | 0 (0.0%) |
| $50,000 to $74,999 | 33 (28.4%) | 0 (0.0%) |
| $75,000 to $99,999 | 0 (0.0%) | 7 (100.0%) |
| $100,000 to $149,999 | 15 (12.9%) | 0 (0.0%) |
| $150,000 or more | 39 (33.6%) | 0 (0.0%) |
| Total | 116 (100.0%) | 7 (100.0%) |
Monthly Housing Cost Tiers in Upper Stewartsville
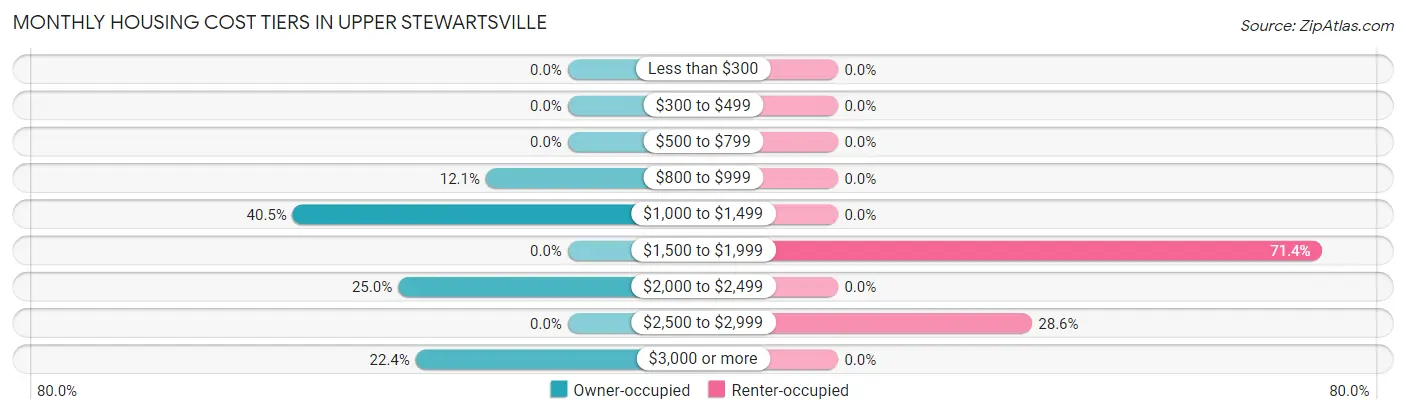
| Monthly Cost | Owner-occupied | Renter-occupied |
| Less than $300 | 0 (0.0%) | 0 (0.0%) |
| $300 to $499 | 0 (0.0%) | 0 (0.0%) |
| $500 to $799 | 0 (0.0%) | 0 (0.0%) |
| $800 to $999 | 14 (12.1%) | 0 (0.0%) |
| $1,000 to $1,499 | 47 (40.5%) | 0 (0.0%) |
| $1,500 to $1,999 | 0 (0.0%) | 5 (71.4%) |
| $2,000 to $2,499 | 29 (25.0%) | 0 (0.0%) |
| $2,500 to $2,999 | 0 (0.0%) | 2 (28.6%) |
| $3,000 or more | 26 (22.4%) | 0 (0.0%) |
| Total | 116 (100.0%) | 7 (100.0%) |
Physical Housing Characteristics in Upper Stewartsville
Housing Structures in Upper Stewartsville
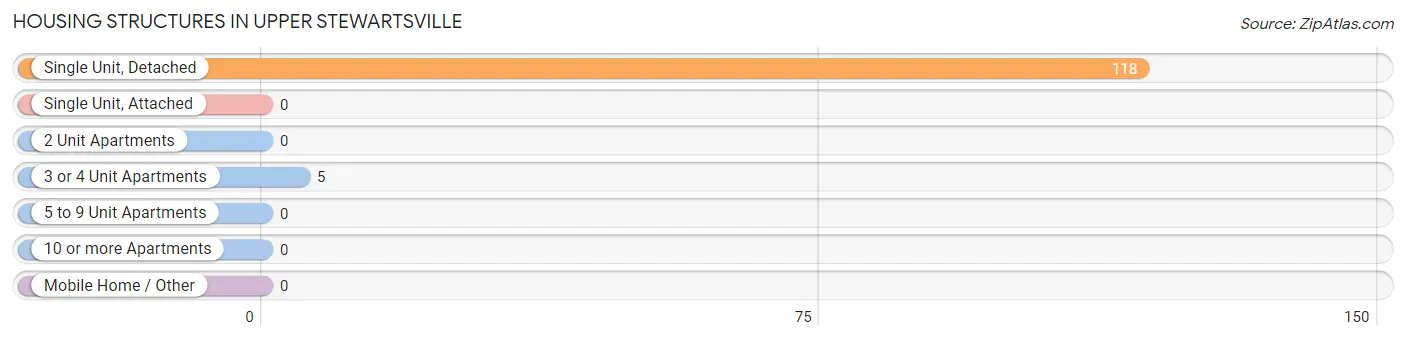
| Structure Type | # Housing Units | % Housing Units |
| Single Unit, Detached | 118 | 95.9% |
| Single Unit, Attached | 0 | 0.0% |
| 2 Unit Apartments | 0 | 0.0% |
| 3 or 4 Unit Apartments | 5 | 4.1% |
| 5 to 9 Unit Apartments | 0 | 0.0% |
| 10 or more Apartments | 0 | 0.0% |
| Mobile Home / Other | 0 | 0.0% |
| Total | 123 | 100.0% |
Housing Structures by Occupancy in Upper Stewartsville
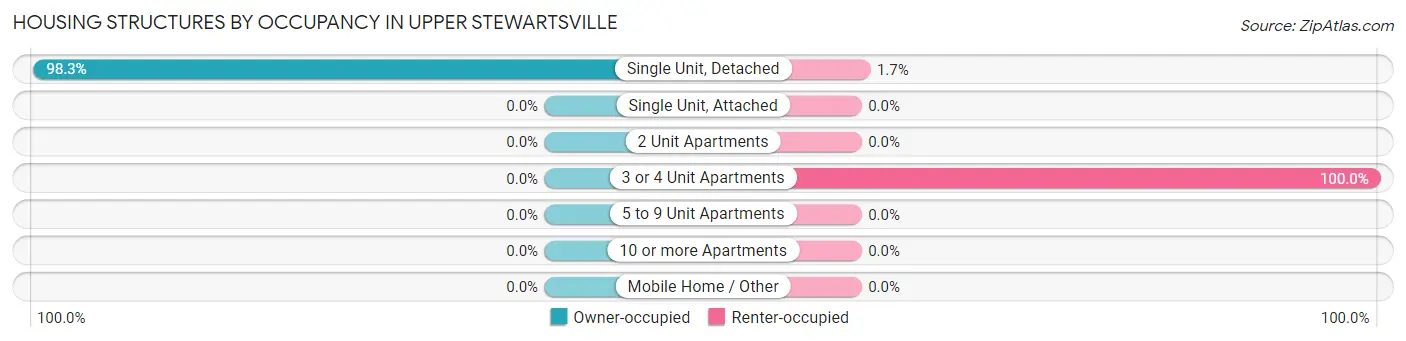
| Structure Type | Owner-occupied | Renter-occupied |
| Single Unit, Detached | 116 (98.3%) | 2 (1.7%) |
| Single Unit, Attached | 0 (0.0%) | 0 (0.0%) |
| 2 Unit Apartments | 0 (0.0%) | 0 (0.0%) |
| 3 or 4 Unit Apartments | 0 (0.0%) | 5 (100.0%) |
| 5 to 9 Unit Apartments | 0 (0.0%) | 0 (0.0%) |
| 10 or more Apartments | 0 (0.0%) | 0 (0.0%) |
| Mobile Home / Other | 0 (0.0%) | 0 (0.0%) |
| Total | 116 (94.3%) | 7 (5.7%) |
Housing Structures by Number of Rooms in Upper Stewartsville
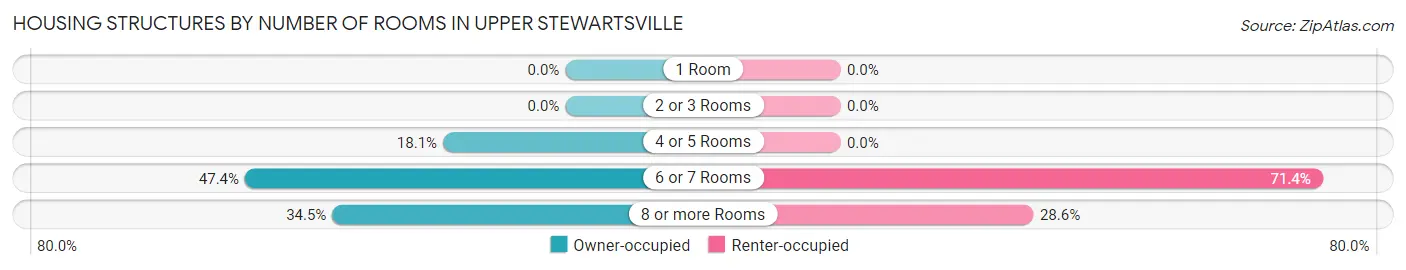
| Number of Rooms | Owner-occupied | Renter-occupied |
| 1 Room | 0 (0.0%) | 0 (0.0%) |
| 2 or 3 Rooms | 0 (0.0%) | 0 (0.0%) |
| 4 or 5 Rooms | 21 (18.1%) | 0 (0.0%) |
| 6 or 7 Rooms | 55 (47.4%) | 5 (71.4%) |
| 8 or more Rooms | 40 (34.5%) | 2 (28.6%) |
| Total | 116 (100.0%) | 7 (100.0%) |
Housing Structure by Heating Type in Upper Stewartsville
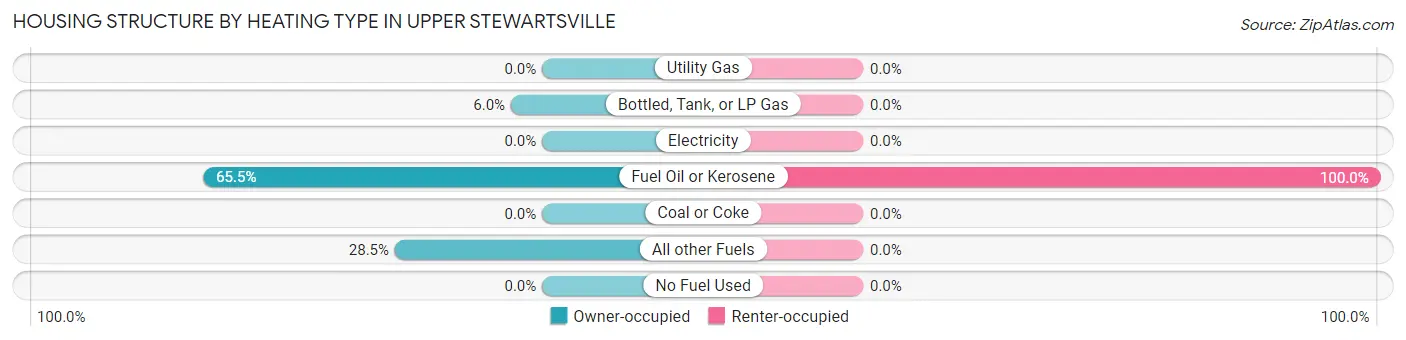
| Heating Type | Owner-occupied | Renter-occupied |
| Utility Gas | 0 (0.0%) | 0 (0.0%) |
| Bottled, Tank, or LP Gas | 7 (6.0%) | 0 (0.0%) |
| Electricity | 0 (0.0%) | 0 (0.0%) |
| Fuel Oil or Kerosene | 76 (65.5%) | 7 (100.0%) |
| Coal or Coke | 0 (0.0%) | 0 (0.0%) |
| All other Fuels | 33 (28.4%) | 0 (0.0%) |
| No Fuel Used | 0 (0.0%) | 0 (0.0%) |
| Total | 116 (100.0%) | 7 (100.0%) |
Household Vehicle Usage in Upper Stewartsville
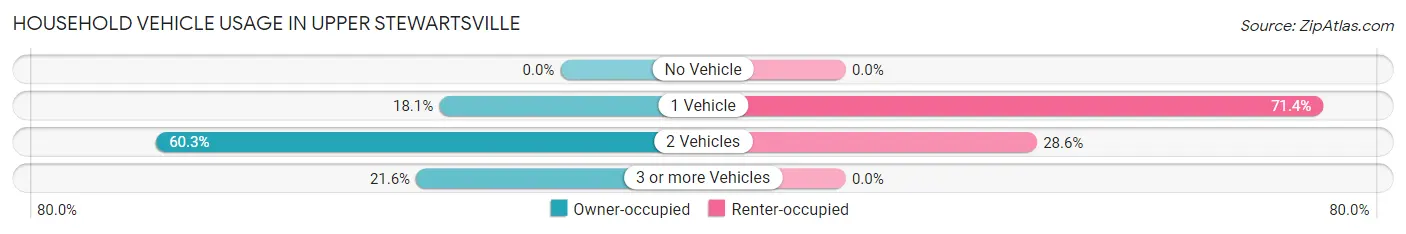
| Vehicles per Household | Owner-occupied | Renter-occupied |
| No Vehicle | 0 (0.0%) | 0 (0.0%) |
| 1 Vehicle | 21 (18.1%) | 5 (71.4%) |
| 2 Vehicles | 70 (60.3%) | 2 (28.6%) |
| 3 or more Vehicles | 25 (21.5%) | 0 (0.0%) |
| Total | 116 (100.0%) | 7 (100.0%) |
Real Estate & Mortgages in Upper Stewartsville
Real Estate and Mortgage Overview in Upper Stewartsville
| Characteristic | Without Mortgage | With Mortgage |
| Housing Units | 40 | 76 |
| Median Property Value | - | - |
| Median Household Income | - | - |
| Monthly Housing Costs | - | - |
| Real Estate Taxes | - | - |
Property Value by Mortgage Status in Upper Stewartsville
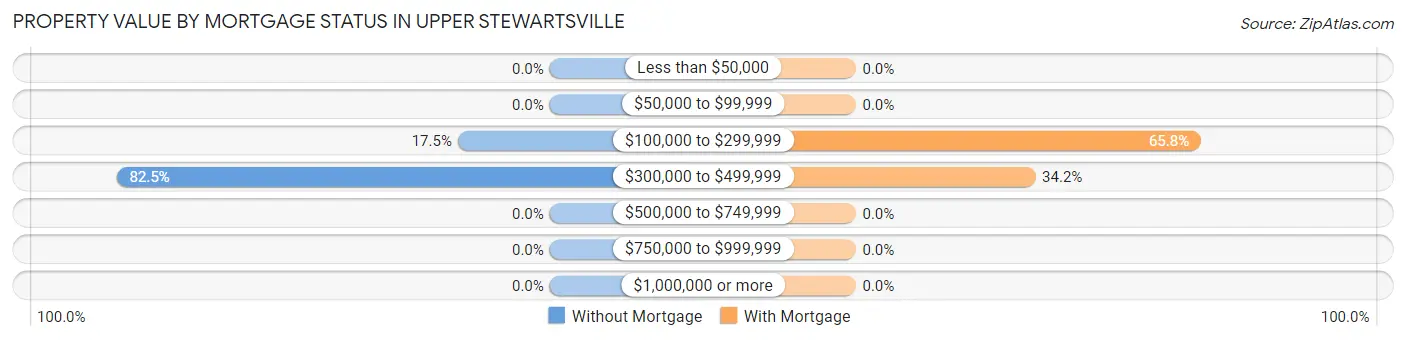
| Property Value | Without Mortgage | With Mortgage |
| Less than $50,000 | 0 (0.0%) | 0 (0.0%) |
| $50,000 to $99,999 | 0 (0.0%) | 0 (0.0%) |
| $100,000 to $299,999 | 7 (17.5%) | 50 (65.8%) |
| $300,000 to $499,999 | 33 (82.5%) | 26 (34.2%) |
| $500,000 to $749,999 | 0 (0.0%) | 0 (0.0%) |
| $750,000 to $999,999 | 0 (0.0%) | 0 (0.0%) |
| $1,000,000 or more | 0 (0.0%) | 0 (0.0%) |
| Total | 40 (100.0%) | 76 (100.0%) |
Household Income by Mortgage Status in Upper Stewartsville
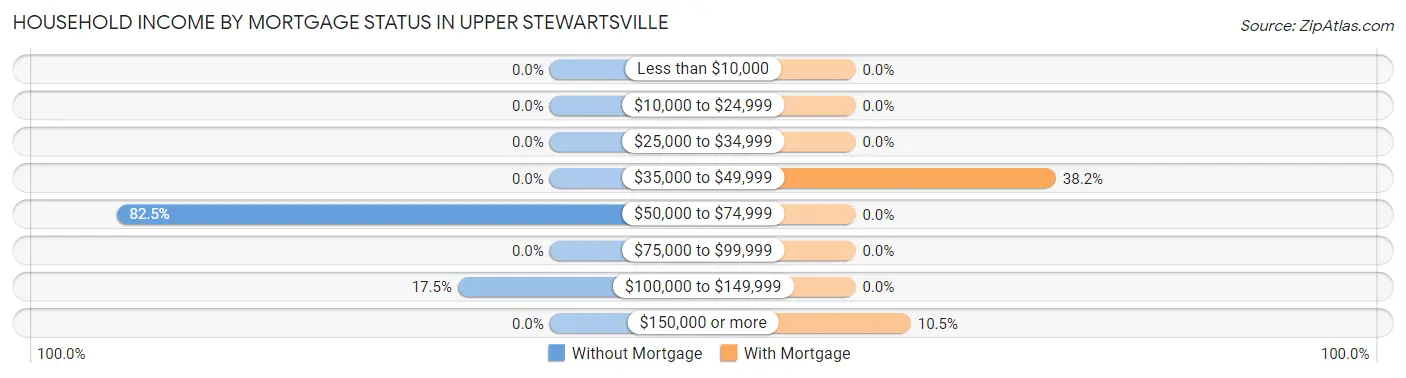
| Household Income | Without Mortgage | With Mortgage |
| Less than $10,000 | 0 (0.0%) | 0 (0.0%) |
| $10,000 to $24,999 | 0 (0.0%) | 0 (0.0%) |
| $25,000 to $34,999 | 0 (0.0%) | 0 (0.0%) |
| $35,000 to $49,999 | 0 (0.0%) | 29 (38.2%) |
| $50,000 to $74,999 | 33 (82.5%) | 0 (0.0%) |
| $75,000 to $99,999 | 0 (0.0%) | 0 (0.0%) |
| $100,000 to $149,999 | 7 (17.5%) | 0 (0.0%) |
| $150,000 or more | 0 (0.0%) | 8 (10.5%) |
| Total | 40 (100.0%) | 76 (100.0%) |
Property Value to Household Income Ratio in Upper Stewartsville
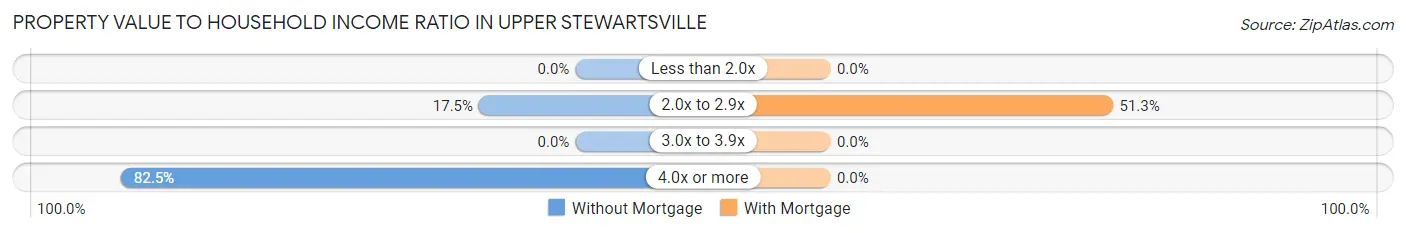
| Value-to-Income Ratio | Without Mortgage | With Mortgage |
| Less than 2.0x | 0 (0.0%) | 0 (0.0%) |
| 2.0x to 2.9x | 7 (17.5%) | 39 (51.3%) |
| 3.0x to 3.9x | 0 (0.0%) | 0 (0.0%) |
| 4.0x or more | 33 (82.5%) | 0 (0.0%) |
| Total | 40 (100.0%) | 76 (100.0%) |
Real Estate Taxes by Mortgage Status in Upper Stewartsville
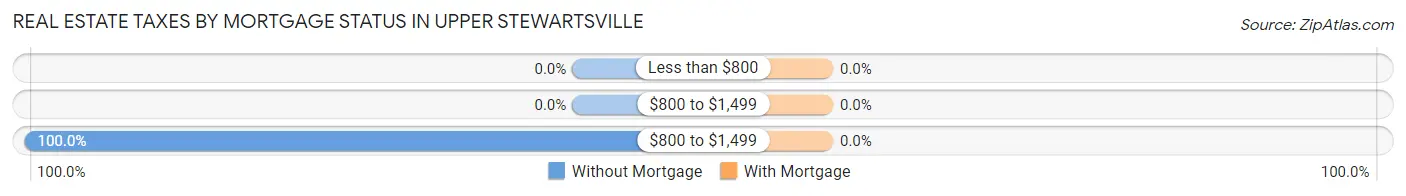
| Property Taxes | Without Mortgage | With Mortgage |
| Less than $800 | 0 (0.0%) | 0 (0.0%) |
| $800 to $1,499 | 0 (0.0%) | 0 (0.0%) |
| $800 to $1,499 | 40 (100.0%) | 0 (0.0%) |
| Total | 40 (100.0%) | 76 (100.0%) |
Health & Disability in Upper Stewartsville
Health Insurance Coverage by Age in Upper Stewartsville
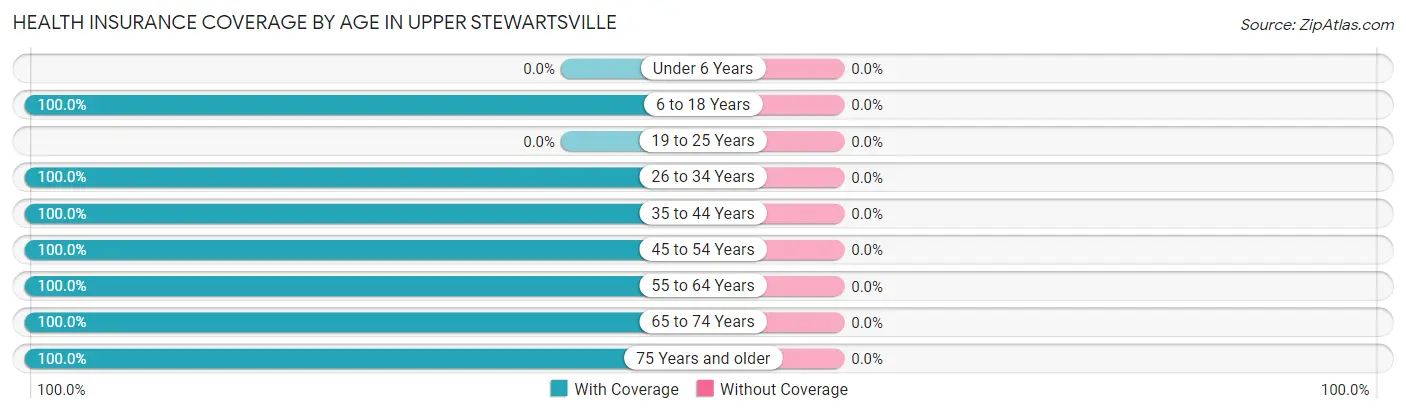
| Age Bracket | With Coverage | Without Coverage |
| Under 6 Years | 0 (0.0%) | 0 (0.0%) |
| 6 to 18 Years | 91 (100.0%) | 0 (0.0%) |
| 19 to 25 Years | 0 (0.0%) | 0 (0.0%) |
| 26 to 34 Years | 54 (100.0%) | 0 (0.0%) |
| 35 to 44 Years | 33 (100.0%) | 0 (0.0%) |
| 45 to 54 Years | 2 (100.0%) | 0 (0.0%) |
| 55 to 64 Years | 68 (100.0%) | 0 (0.0%) |
| 65 to 74 Years | 63 (100.0%) | 0 (0.0%) |
| 75 Years and older | 33 (100.0%) | 0 (0.0%) |
| Total | 344 (100.0%) | 0 (0.0%) |
Health Insurance Coverage by Citizenship Status in Upper Stewartsville
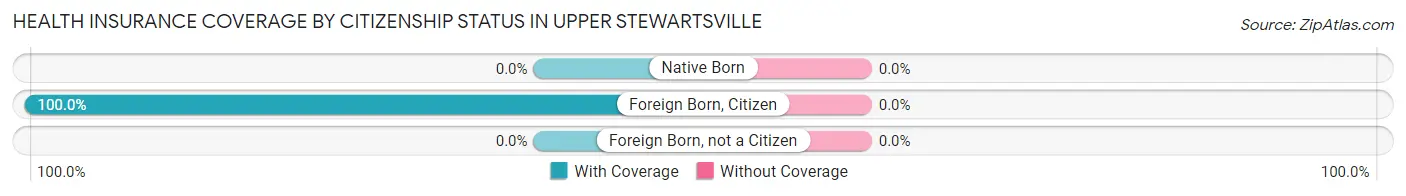
| Citizenship Status | With Coverage | Without Coverage |
| Native Born | 0 (0.0%) | 0 (0.0%) |
| Foreign Born, Citizen | 91 (100.0%) | 0 (0.0%) |
| Foreign Born, not a Citizen | 0 (0.0%) | 0 (0.0%) |
Health Insurance Coverage by Household Income in Upper Stewartsville
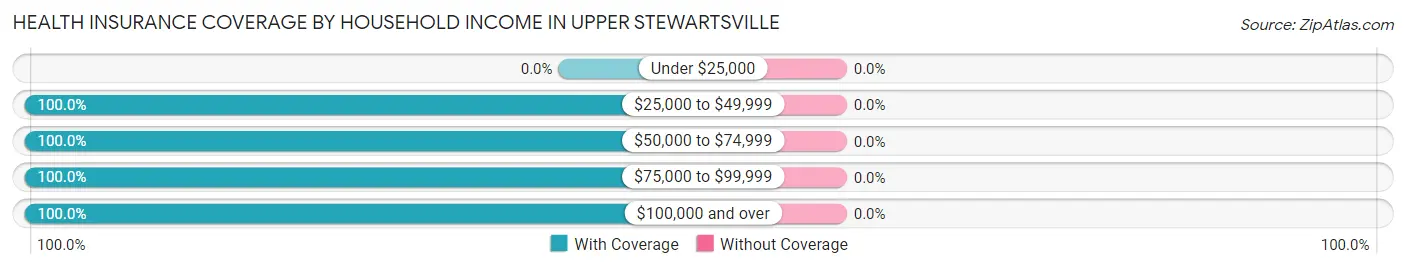
| Household Income | With Coverage | Without Coverage |
| Under $25,000 | 0 (0.0%) | 0 (0.0%) |
| $25,000 to $49,999 | 56 (100.0%) | 0 (0.0%) |
| $50,000 to $74,999 | 33 (100.0%) | 0 (0.0%) |
| $75,000 to $99,999 | 13 (100.0%) | 0 (0.0%) |
| $100,000 and over | 242 (100.0%) | 0 (0.0%) |
Public vs Private Health Insurance Coverage by Age in Upper Stewartsville
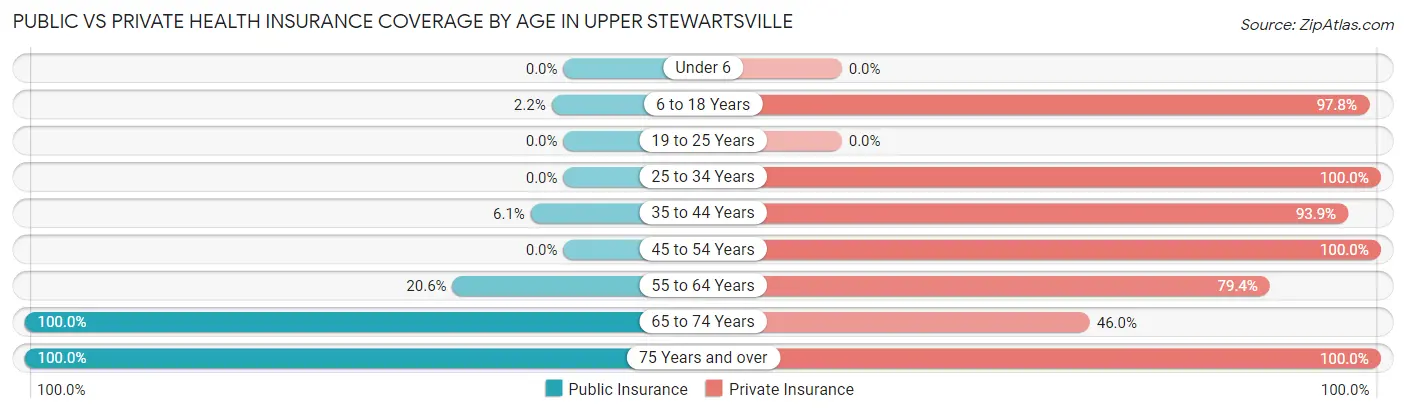
| Age Bracket | Public Insurance | Private Insurance |
| Under 6 | 0 (0.0%) | 0 (0.0%) |
| 6 to 18 Years | 2 (2.2%) | 89 (97.8%) |
| 19 to 25 Years | 0 (0.0%) | 0 (0.0%) |
| 25 to 34 Years | 0 (0.0%) | 54 (100.0%) |
| 35 to 44 Years | 2 (6.1%) | 31 (93.9%) |
| 45 to 54 Years | 0 (0.0%) | 2 (100.0%) |
| 55 to 64 Years | 14 (20.6%) | 54 (79.4%) |
| 65 to 74 Years | 63 (100.0%) | 29 (46.0%) |
| 75 Years and over | 33 (100.0%) | 33 (100.0%) |
| Total | 114 (33.1%) | 292 (84.9%) |
Disability Status by Sex by Age in Upper Stewartsville
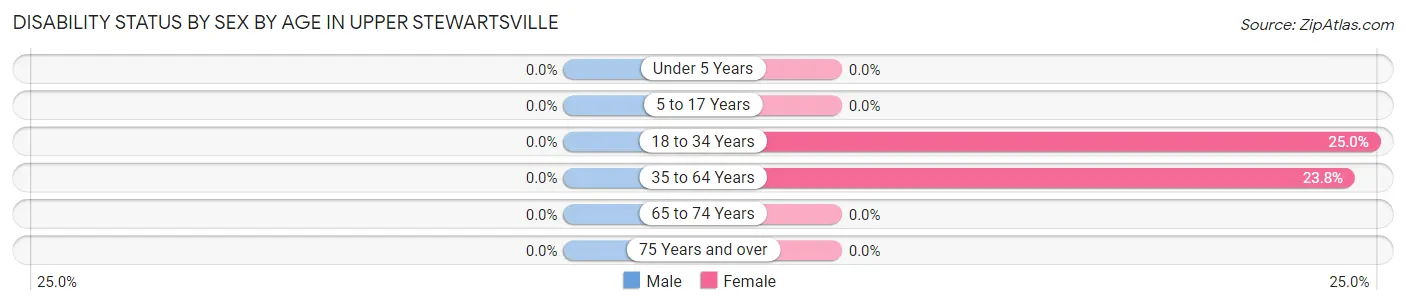
| Age Bracket | Male | Female |
| Under 5 Years | 0 (0.0%) | 0 (0.0%) |
| 5 to 17 Years | 0 (0.0%) | 0 (0.0%) |
| 18 to 34 Years | 0 (0.0%) | 10 (25.0%) |
| 35 to 64 Years | 0 (0.0%) | 10 (23.8%) |
| 65 to 74 Years | 0 (0.0%) | 0 (0.0%) |
| 75 Years and over | 0 (0.0%) | 0 (0.0%) |
Disability Class by Sex by Age in Upper Stewartsville
Disability Class: Hearing Difficulty
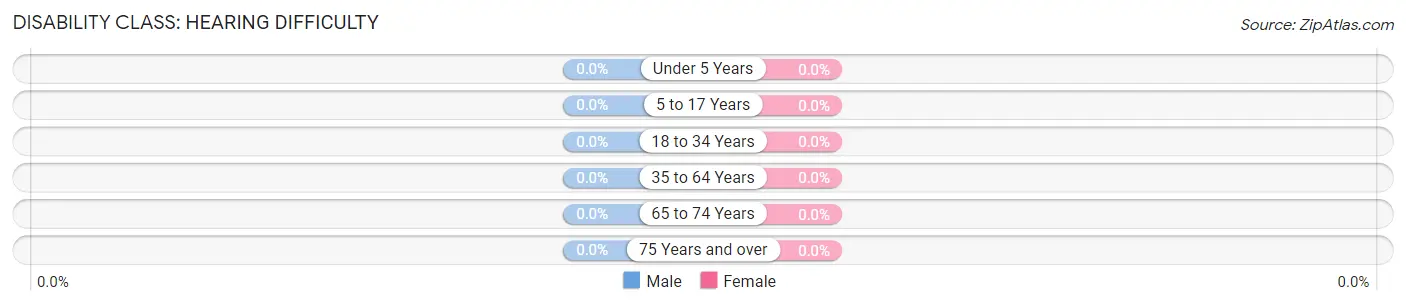
| Age Bracket | Male | Female |
| Under 5 Years | 0 (0.0%) | 0 (0.0%) |
| 5 to 17 Years | 0 (0.0%) | 0 (0.0%) |
| 18 to 34 Years | 0 (0.0%) | 0 (0.0%) |
| 35 to 64 Years | 0 (0.0%) | 0 (0.0%) |
| 65 to 74 Years | 0 (0.0%) | 0 (0.0%) |
| 75 Years and over | 0 (0.0%) | 0 (0.0%) |
Disability Class: Vision Difficulty
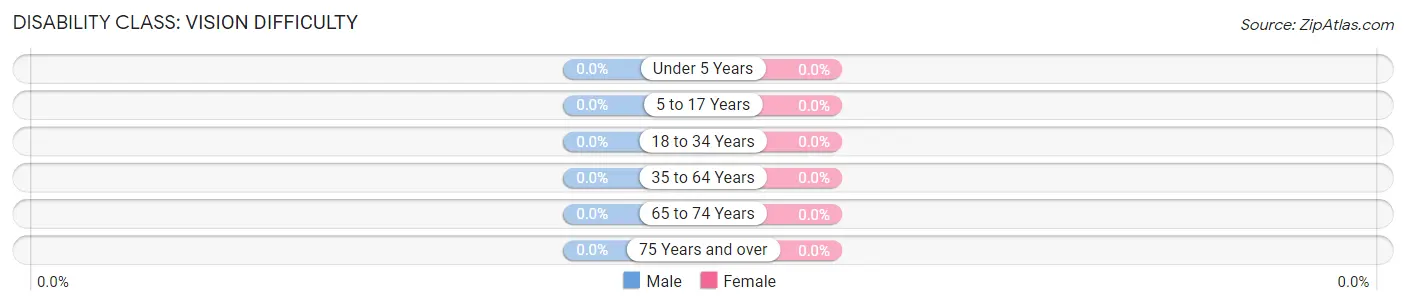
| Age Bracket | Male | Female |
| Under 5 Years | 0 (0.0%) | 0 (0.0%) |
| 5 to 17 Years | 0 (0.0%) | 0 (0.0%) |
| 18 to 34 Years | 0 (0.0%) | 0 (0.0%) |
| 35 to 64 Years | 0 (0.0%) | 0 (0.0%) |
| 65 to 74 Years | 0 (0.0%) | 0 (0.0%) |
| 75 Years and over | 0 (0.0%) | 0 (0.0%) |
Disability Class: Cognitive Difficulty
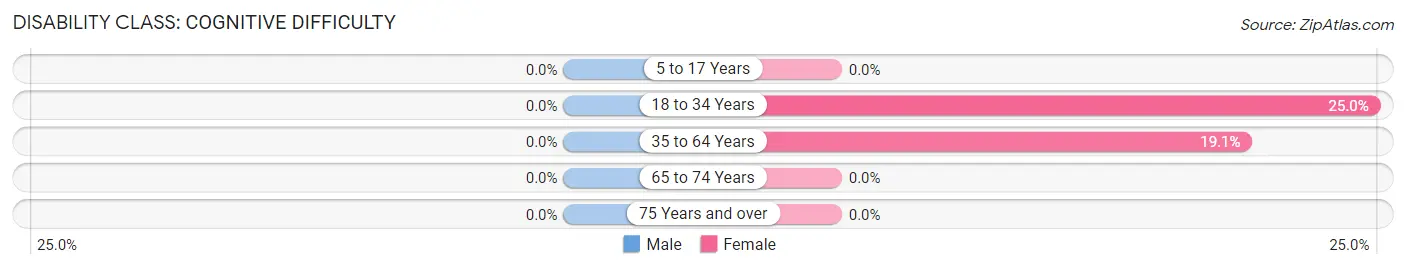
| Age Bracket | Male | Female |
| 5 to 17 Years | 0 (0.0%) | 0 (0.0%) |
| 18 to 34 Years | 0 (0.0%) | 10 (25.0%) |
| 35 to 64 Years | 0 (0.0%) | 8 (19.1%) |
| 65 to 74 Years | 0 (0.0%) | 0 (0.0%) |
| 75 Years and over | 0 (0.0%) | 0 (0.0%) |
Disability Class: Ambulatory Difficulty
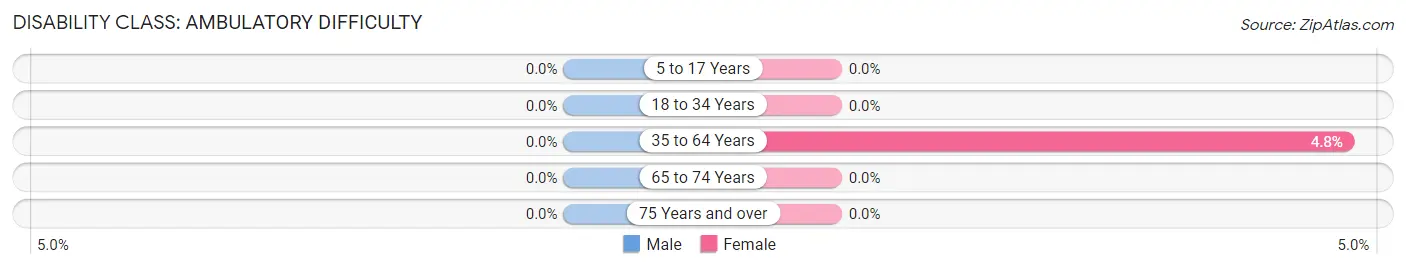
| Age Bracket | Male | Female |
| 5 to 17 Years | 0 (0.0%) | 0 (0.0%) |
| 18 to 34 Years | 0 (0.0%) | 0 (0.0%) |
| 35 to 64 Years | 0 (0.0%) | 2 (4.8%) |
| 65 to 74 Years | 0 (0.0%) | 0 (0.0%) |
| 75 Years and over | 0 (0.0%) | 0 (0.0%) |
Disability Class: Self-Care Difficulty
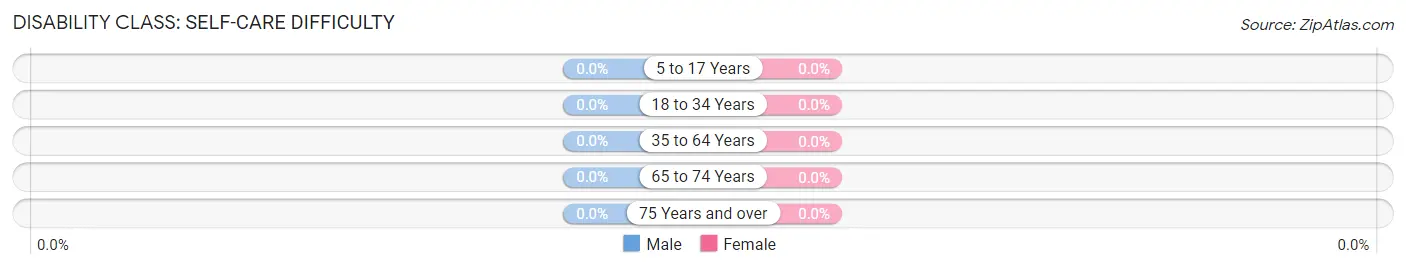
| Age Bracket | Male | Female |
| 5 to 17 Years | 0 (0.0%) | 0 (0.0%) |
| 18 to 34 Years | 0 (0.0%) | 0 (0.0%) |
| 35 to 64 Years | 0 (0.0%) | 0 (0.0%) |
| 65 to 74 Years | 0 (0.0%) | 0 (0.0%) |
| 75 Years and over | 0 (0.0%) | 0 (0.0%) |
Technology Access in Upper Stewartsville
Computing Device Access in Upper Stewartsville
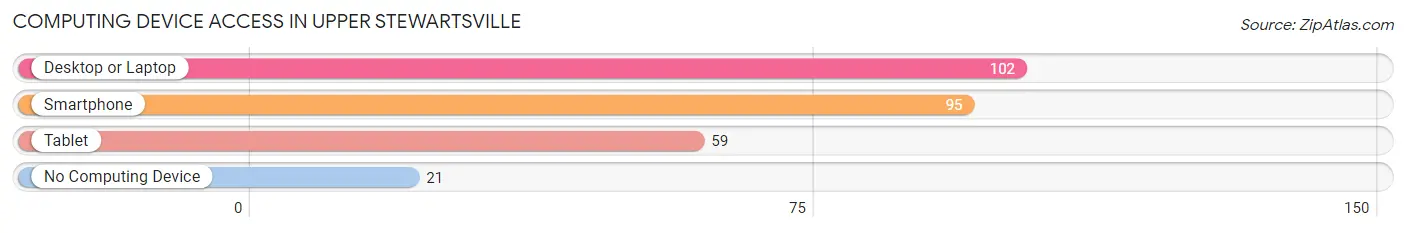
| Device Type | # Households | % Households |
| Desktop or Laptop | 102 | 82.9% |
| Smartphone | 95 | 77.2% |
| Tablet | 59 | 48.0% |
| No Computing Device | 21 | 17.1% |
| Total | 123 | 100.0% |
Internet Access in Upper Stewartsville
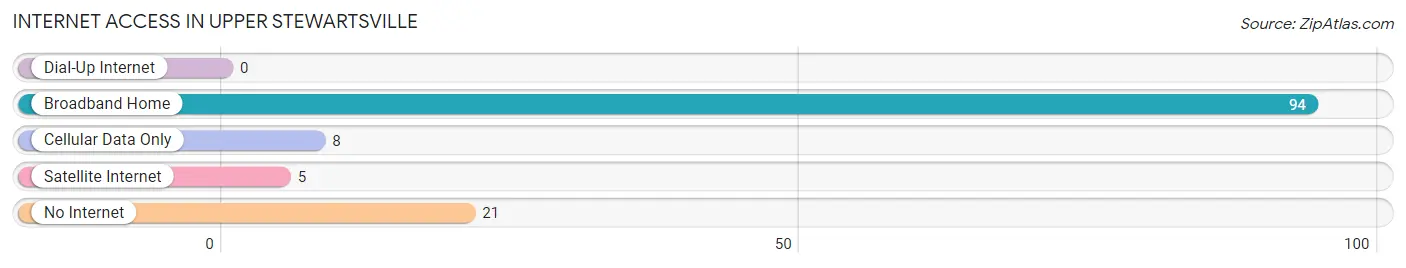
| Internet Type | # Households | % Households |
| Dial-Up Internet | 0 | 0.0% |
| Broadband Home | 94 | 76.4% |
| Cellular Data Only | 8 | 6.5% |
| Satellite Internet | 5 | 4.1% |
| No Internet | 21 | 17.1% |
| Total | 123 | 100.0% |
Upper Stewartsville Summary
Upper Stewartsville is a small unincorporated community located in the western part of Warren County, New Jersey. It is situated in the foothills of the Kittatinny Mountains, and is part of the Great Appalachian Valley. The community is located approximately 10 miles south of the Delaware River, and is bordered by the townships of Pohatcong and Greenwich.
History
Upper Stewartsville was first settled in the late 1700s by German immigrants. The area was originally known as “Stewartsville”, named after the Stewart family who owned much of the land in the area. The name was later changed to “Upper Stewartsville” to distinguish it from the nearby town of Stewartsville.
The area was primarily agricultural, with many of the early settlers growing wheat, corn, and other crops. The area was also known for its iron ore deposits, which were mined and used to make tools and weapons.
In the late 1800s, the area began to develop as a small industrial center. Several factories were built, including a paper mill, a sawmill, and a grist mill. The area also became a popular tourist destination, with many visitors coming to enjoy the scenic views of the Kittatinny Mountains.
Geography
Upper Stewartsville is located in the western part of Warren County, New Jersey. It is situated in the foothills of the Kittatinny Mountains, and is part of the Great Appalachian Valley. The community is located approximately 10 miles south of the Delaware River, and is bordered by the townships of Pohatcong and Greenwich.
The area is characterized by rolling hills and valleys, with the highest point in the area being the summit of Mount Tammany, which rises to an elevation of 1,527 feet. The area is also home to several small streams, including the Musconetcong River, which flows through the community.
Economy
Upper Stewartsville is a primarily residential community, with most of the population employed in the nearby towns of Phillipsburg and Easton. The area is also home to several small businesses, including a few restaurants, a gas station, and a few convenience stores.
The area is also home to several farms, which produce a variety of crops, including corn, wheat, and hay. The area is also known for its iron ore deposits, which are mined and used to make tools and weapons.
Demographics
As of the 2010 census, the population of Upper Stewartsville was 1,845. The racial makeup of the community was 94.3% White, 2.2% African American, 0.3% Native American, 0.7% Asian, and 2.5% from other races. The median household income was $50,938, and the median family income was $60,938.
Conclusion
Upper Stewartsville is a small unincorporated community located in the western part of Warren County, New Jersey. It is situated in the foothills of the Kittatinny Mountains, and is part of the Great Appalachian Valley. The area is primarily residential, with most of the population employed in the nearby towns of Phillipsburg and Easton. The area is also home to several small businesses, farms, and iron ore deposits. As of the 2010 census, the population of Upper Stewartsville was 1,845. The racial makeup of the community was 94.3% White, 2.2% African American, 0.3% Native American, 0.7% Asian, and 2.5% from other races. The median household income was $50,938, and the median family income was $60,938.
Common Questions
What is Per Capita Income in Upper Stewartsville?
Per Capita income in Upper Stewartsville is $50,196.
What is Inequality or Gini Index in Upper Stewartsville?
Inequality or Gini Index in Upper Stewartsville is 0.45.
What is the Total Population of Upper Stewartsville?
Total Population of Upper Stewartsville is 344.
What is the Total Male Population of Upper Stewartsville?
Total Male Population of Upper Stewartsville is 204.
What is the Total Female Population of Upper Stewartsville?
Total Female Population of Upper Stewartsville is 140.
What is the Ratio of Males per 100 Females in Upper Stewartsville?
There are 145.71 Males per 100 Females in Upper Stewartsville.
What is the Ratio of Females per 100 Males in Upper Stewartsville?
There are 68.63 Females per 100 Males in Upper Stewartsville.
What is the Median Population Age in Upper Stewartsville?
Median Population Age in Upper Stewartsville is 37.8 Years.
What is the Average Family Size in Upper Stewartsville
Average Family Size in Upper Stewartsville is 3.5 People.
What is the Average Household Size in Upper Stewartsville
Average Household Size in Upper Stewartsville is 2.8 People.
How Large is the Labor Force in Upper Stewartsville?
There are 168 People in the Labor Forcein in Upper Stewartsville.
What is the Percentage of People in the Labor Force in Upper Stewartsville?
57.5% of People are in the Labor Force in Upper Stewartsville.
What is the Unemployment Rate in Upper Stewartsville?
Unemployment Rate in Upper Stewartsville is 8.9%.