Cities with the Highest Percentage of Immigrants from Russia in New Jersey
RELATED REPORTS & OPTIONS
Russia
New Jersey
Compare Cities
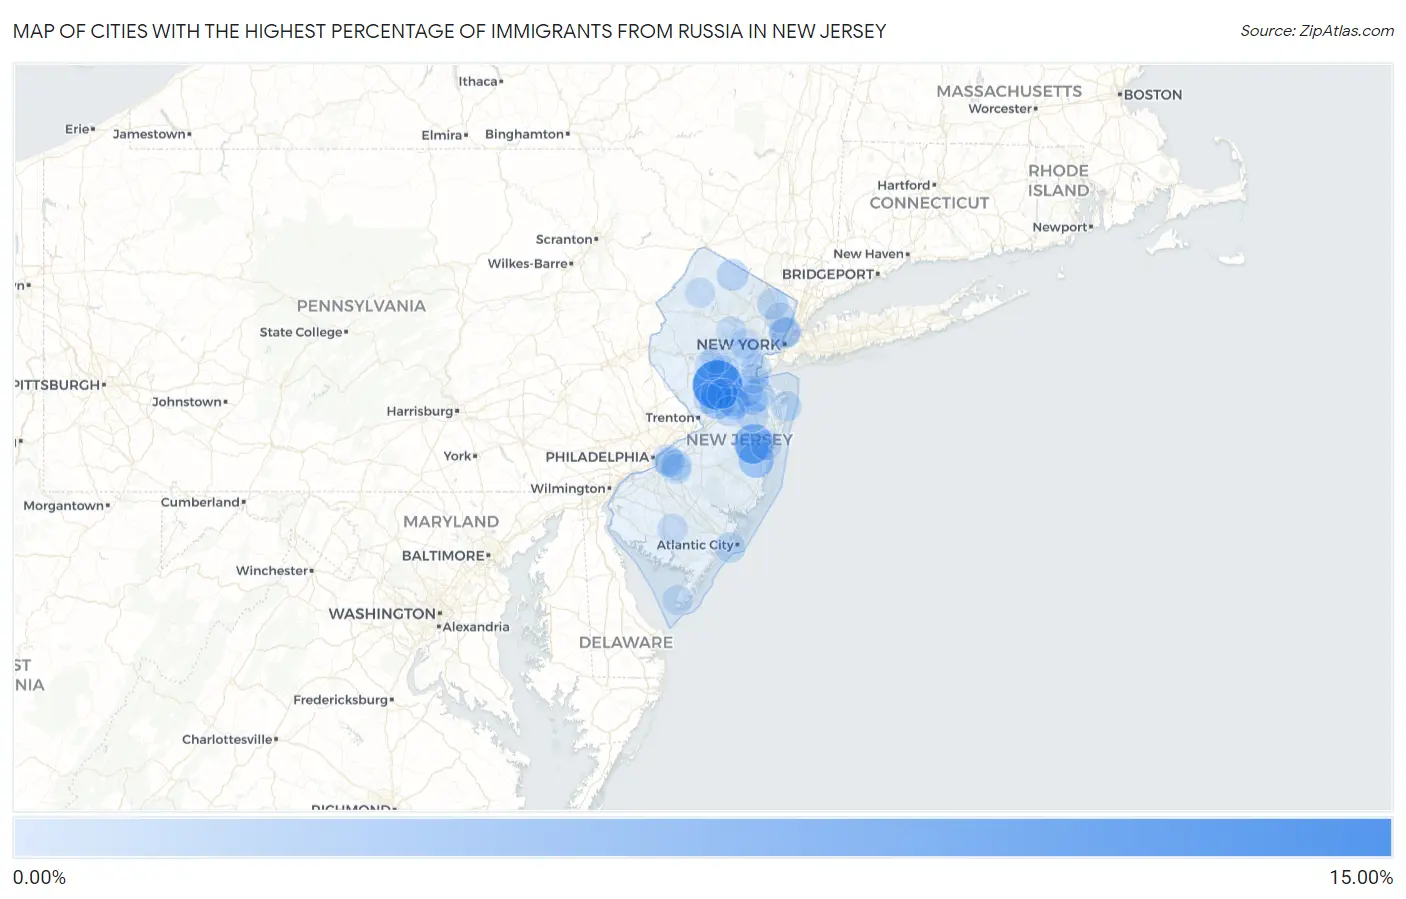
Map of Cities with the Highest Percentage of Immigrants from Russia in New Jersey
0.00%
15.00%
Cities with the Highest Percentage of Immigrants from Russia in New Jersey
| City | Russia | vs State | vs National | |
| 1. | Griggstown | 13.61% | 0.22%(+13.4)#1 | 0.12%(+13.5)#5 |
| 2. | Cedar Glen West | 6.53% | 0.22%(+6.31)#2 | 0.12%(+6.41)#15 |
| 3. | Plainsboro Center | 4.16% | 0.22%(+3.94)#3 | 0.12%(+4.03)#30 |
| 4. | Holiday Heights | 4.00% | 0.22%(+3.78)#4 | 0.12%(+3.88)#34 |
| 5. | Fair Lawn Borough | 2.96% | 0.22%(+2.74)#5 | 0.12%(+2.84)#54 |
| 6. | Auburn | 2.73% | 0.22%(+2.51)#6 | 0.12%(+2.60)#66 |
| 7. | Saddle River Borough | 2.35% | 0.22%(+2.13)#7 | 0.12%(+2.23)#89 |
| 8. | Morganville | 2.33% | 0.22%(+2.11)#8 | 0.12%(+2.21)#91 |
| 9. | Leisure Knoll | 2.33% | 0.22%(+2.11)#9 | 0.12%(+2.20)#92 |
| 10. | Clearbrook | 1.96% | 0.22%(+1.74)#10 | 0.12%(+1.84)#126 |
| 11. | Guttenberg | 1.93% | 0.22%(+1.71)#11 | 0.12%(+1.81)#128 |
| 12. | Rossmoor | 1.80% | 0.22%(+1.58)#12 | 0.12%(+1.68)#141 |
| 13. | Fort Lee Borough | 1.66% | 0.22%(+1.44)#13 | 0.12%(+1.53)#163 |
| 14. | The Ponds | 1.64% | 0.22%(+1.42)#14 | 0.12%(+1.51)#170 |
| 15. | Cranford | 1.56% | 0.22%(+1.34)#15 | 0.12%(+1.44)#177 |
| 16. | Franklin Center | 1.50% | 0.22%(+1.28)#16 | 0.12%(+1.38)#189 |
| 17. | Highland Lakes | 1.47% | 0.22%(+1.25)#17 | 0.12%(+1.34)#203 |
| 18. | West Freehold | 1.39% | 0.22%(+1.17)#18 | 0.12%(+1.27)#215 |
| 19. | Pines Lake | 1.38% | 0.22%(+1.16)#19 | 0.12%(+1.26)#220 |
| 20. | Concordia | 1.37% | 0.22%(+1.15)#20 | 0.12%(+1.24)#229 |
| 21. | New Providence Borough | 1.35% | 0.22%(+1.13)#21 | 0.12%(+1.22)#237 |
| 22. | Cliffside Park Borough | 1.34% | 0.22%(+1.12)#22 | 0.12%(+1.22)#240 |
| 23. | Kingston | 1.32% | 0.22%(+1.10)#23 | 0.12%(+1.20)#247 |
| 24. | Laurel Springs Borough | 1.30% | 0.22%(+1.08)#24 | 0.12%(+1.17)#256 |
| 25. | Preakness | 1.29% | 0.22%(+1.07)#25 | 0.12%(+1.17)#260 |
| 26. | Vincentown | 1.29% | 0.22%(+1.07)#26 | 0.12%(+1.16)#264 |
| 27. | Ridgewood | 1.24% | 0.22%(+1.02)#27 | 0.12%(+1.12)#281 |
| 28. | Northvale Borough | 1.22% | 0.22%(+0.996)#28 | 0.12%(+1.09)#287 |
| 29. | Oakland Borough | 1.19% | 0.22%(+0.966)#29 | 0.12%(+1.06)#296 |
| 30. | Cresskill Borough | 1.18% | 0.22%(+0.955)#30 | 0.12%(+1.05)#298 |
| 31. | Franklin Lakes Borough | 1.17% | 0.22%(+0.952)#31 | 0.12%(+1.05)#299 |
| 32. | Layton | 1.10% | 0.22%(+0.882)#32 | 0.12%(+0.979)#320 |
| 33. | North Haledon Borough | 1.05% | 0.22%(+0.825)#33 | 0.12%(+0.922)#343 |
| 34. | West Berlin | 0.97% | 0.22%(+0.753)#34 | 0.12%(+0.851)#377 |
| 35. | Springfield | 0.96% | 0.22%(+0.738)#35 | 0.12%(+0.835)#387 |
| 36. | High Bridge Borough | 0.95% | 0.22%(+0.734)#36 | 0.12%(+0.831)#389 |
| 37. | Basking Ridge | 0.95% | 0.22%(+0.729)#37 | 0.12%(+0.826)#393 |
| 38. | Hopewell Borough | 0.93% | 0.22%(+0.711)#38 | 0.12%(+0.809)#398 |
| 39. | Old Bridge | 0.90% | 0.22%(+0.677)#39 | 0.12%(+0.774)#421 |
| 40. | Golden Triangle | 0.87% | 0.22%(+0.647)#40 | 0.12%(+0.744)#439 |
| 41. | Bedminster | 0.87% | 0.22%(+0.646)#41 | 0.12%(+0.743)#441 |
| 42. | Berlin Borough | 0.84% | 0.22%(+0.621)#42 | 0.12%(+0.718)#456 |
| 43. | River Edge Borough | 0.84% | 0.22%(+0.620)#43 | 0.12%(+0.717)#457 |
| 44. | Allendale Borough | 0.84% | 0.22%(+0.616)#44 | 0.12%(+0.713)#459 |
| 45. | Princeton | 0.82% | 0.22%(+0.601)#45 | 0.12%(+0.698)#469 |
| 46. | Ventnor City | 0.80% | 0.22%(+0.577)#46 | 0.12%(+0.674)#493 |
| 47. | Audubon Park Borough | 0.78% | 0.22%(+0.556)#47 | 0.12%(+0.653)#505 |
| 48. | Hightstown Borough | 0.77% | 0.22%(+0.547)#48 | 0.12%(+0.645)#510 |
| 49. | Greentree | 0.75% | 0.22%(+0.533)#49 | 0.12%(+0.631)#521 |
| 50. | Robertsville | 0.74% | 0.22%(+0.523)#50 | 0.12%(+0.620)#531 |
| 51. | Springdale | 0.72% | 0.22%(+0.501)#51 | 0.12%(+0.599)#552 |
| 52. | Edgewater Borough | 0.69% | 0.22%(+0.474)#52 | 0.12%(+0.572)#584 |
| 53. | Bridgewater Center | 0.67% | 0.22%(+0.451)#53 | 0.12%(+0.549)#609 |
| 54. | Far Hills Borough | 0.67% | 0.22%(+0.448)#54 | 0.12%(+0.546)#613 |
| 55. | Leonia Borough | 0.64% | 0.22%(+0.416)#55 | 0.12%(+0.513)#648 |
| 56. | Manville Borough | 0.63% | 0.22%(+0.413)#56 | 0.12%(+0.511)#656 |
| 57. | Sewaren | 0.63% | 0.22%(+0.411)#57 | 0.12%(+0.508)#660 |
| 58. | Highland Park Borough | 0.63% | 0.22%(+0.407)#58 | 0.12%(+0.504)#664 |
| 59. | Twin Rivers | 0.63% | 0.22%(+0.406)#59 | 0.12%(+0.503)#665 |
| 60. | Englewood Cliffs Borough | 0.62% | 0.22%(+0.397)#60 | 0.12%(+0.494)#679 |
| 61. | Long Branch | 0.61% | 0.22%(+0.387)#61 | 0.12%(+0.485)#691 |
| 62. | Seaside Heights Borough | 0.59% | 0.22%(+0.372)#62 | 0.12%(+0.469)#712 |
| 63. | Tenafly Borough | 0.58% | 0.22%(+0.355)#63 | 0.12%(+0.452)#738 |
| 64. | Oradell Borough | 0.57% | 0.22%(+0.352)#64 | 0.12%(+0.450)#741 |
| 65. | Great Notch | 0.57% | 0.22%(+0.352)#65 | 0.12%(+0.450)#742 |
| 66. | Paramus Borough | 0.57% | 0.22%(+0.348)#66 | 0.12%(+0.445)#749 |
| 67. | Stone Harbor Borough | 0.56% | 0.22%(+0.343)#67 | 0.12%(+0.441)#752 |
| 68. | Summit | 0.55% | 0.22%(+0.334)#68 | 0.12%(+0.431)#771 |
| 69. | Troy Hills | 0.54% | 0.22%(+0.318)#69 | 0.12%(+0.415)#795 |
| 70. | Mendham Borough | 0.52% | 0.22%(+0.303)#70 | 0.12%(+0.401)#818 |
| 71. | Florham Park Borough | 0.52% | 0.22%(+0.296)#71 | 0.12%(+0.393)#827 |
| 72. | Hillsdale Borough | 0.51% | 0.22%(+0.293)#72 | 0.12%(+0.391)#828 |
| 73. | Vineland | 0.51% | 0.22%(+0.288)#73 | 0.12%(+0.385)#835 |
| 74. | Shrewsbury Borough | 0.51% | 0.22%(+0.287)#74 | 0.12%(+0.385)#839 |
| 75. | Pine Beach Borough | 0.50% | 0.22%(+0.279)#75 | 0.12%(+0.377)#850 |
| 76. | Netcong Borough | 0.49% | 0.22%(+0.268)#76 | 0.12%(+0.365)#878 |
| 77. | Alpine Borough | 0.48% | 0.22%(+0.263)#77 | 0.12%(+0.360)#883 |
| 78. | Hawthorne Borough | 0.47% | 0.22%(+0.253)#78 | 0.12%(+0.350)#907 |
| 79. | Leisure Village East | 0.47% | 0.22%(+0.253)#79 | 0.12%(+0.350)#908 |
| 80. | Green Knoll | 0.47% | 0.22%(+0.247)#80 | 0.12%(+0.344)#920 |
| 81. | Morristown | 0.46% | 0.22%(+0.242)#81 | 0.12%(+0.339)#927 |
| 82. | Liberty Corner | 0.45% | 0.22%(+0.235)#82 | 0.12%(+0.332)#941 |
| 83. | North Cape May | 0.44% | 0.22%(+0.223)#83 | 0.12%(+0.321)#951 |
| 84. | Westfield | 0.44% | 0.22%(+0.221)#84 | 0.12%(+0.318)#957 |
| 85. | Whippany | 0.44% | 0.22%(+0.219)#85 | 0.12%(+0.316)#961 |
| 86. | Bradley Gardens | 0.43% | 0.22%(+0.212)#86 | 0.12%(+0.309)#978 |
| 87. | William Paterson University Of New Jersey | 0.42% | 0.22%(+0.202)#87 | 0.12%(+0.299)#999 |
| 88. | Ellisburg | 0.42% | 0.22%(+0.200)#88 | 0.12%(+0.297)#1,005 |
| 89. | The College Of New Jersey | 0.42% | 0.22%(+0.198)#89 | 0.12%(+0.296)#1,014 |
| 90. | South Amboy | 0.42% | 0.22%(+0.197)#90 | 0.12%(+0.295)#1,017 |
| 91. | Newton | 0.41% | 0.22%(+0.186)#91 | 0.12%(+0.283)#1,045 |
| 92. | Lake Hopatcong | 0.39% | 0.22%(+0.171)#92 | 0.12%(+0.268)#1,085 |
| 93. | Hackensack | 0.39% | 0.22%(+0.169)#93 | 0.12%(+0.266)#1,093 |
| 94. | Wanaque Borough | 0.38% | 0.22%(+0.163)#94 | 0.12%(+0.261)#1,109 |
| 95. | Cedar Knolls | 0.38% | 0.22%(+0.162)#95 | 0.12%(+0.260)#1,111 |
| 96. | Stirling | 0.38% | 0.22%(+0.162)#96 | 0.12%(+0.260)#1,113 |
| 97. | Monmouth Junction | 0.38% | 0.22%(+0.159)#97 | 0.12%(+0.257)#1,120 |
| 98. | West New York | 0.38% | 0.22%(+0.155)#98 | 0.12%(+0.253)#1,125 |
| 99. | Fair Haven Borough | 0.37% | 0.22%(+0.149)#99 | 0.12%(+0.247)#1,139 |
| 100. | Chesilhurst Borough | 0.36% | 0.22%(+0.141)#100 | 0.12%(+0.238)#1,163 |
Common Questions
What are the Top 10 Cities with the Highest Percentage of Immigrants from Russia in New Jersey?
Top 10 Cities with the Highest Percentage of Immigrants from Russia in New Jersey are:
#1
13.61%
#2
6.53%
#3
4.16%
#4
4.00%
#5
2.33%
#6
2.33%
#7
1.93%
#8
1.80%
#9
1.50%
#10
1.47%
What city has the Highest Percentage of Immigrants from Russia in New Jersey?
Griggstown has the Highest Percentage of Immigrants from Russia in New Jersey with 13.61%.
What is the Percentage of Immigrants from Russia in the State of New Jersey?
Percentage of Immigrants from Russia in New Jersey is 0.22%.
What is the Percentage of Immigrants from Russia in the United States?
Percentage of Immigrants from Russia in the United States is 0.12%.