Hopatcong borough, NJ Map & Demographics
Hopatcong borough Overview
$52,157
PER CAPITA INCOME
$123,706
AVG FAMILY INCOME
$107,670
AVG HOUSEHOLD INCOME
11.3%
WAGE / INCOME GAP [ % ]
88.7¢/ $1
WAGE / INCOME GAP [ $ ]
$12,770
FAMILY INCOME DEFICIT
0.38
INEQUALITY / GINI INDEX
14,411
TOTAL POPULATION
7,288
MALE POPULATION
7,123
FEMALE POPULATION
102.32
MALES / 100 FEMALES
97.74
FEMALES / 100 MALES
41.5
MEDIAN AGE
3.0
AVG FAMILY SIZE
2.5
AVG HOUSEHOLD SIZE
8,857
LABOR FORCE [ PEOPLE ]
74.2%
PERCENT IN LABOR FORCE
3.1%
UNEMPLOYMENT RATE
Income in Hopatcong borough
Income Overview in Hopatcong borough
Per Capita Income in Hopatcong borough is $52,157, while median incomes of families and households are $123,706 and $107,670 respectively.
| Characteristic | Number | Measure |
| Per Capita Income | 14,411 | $52,157 |
| Median Family Income | 3,941 | $123,706 |
| Mean Family Income | 3,941 | $145,637 |
| Median Household Income | 5,756 | $107,670 |
| Mean Household Income | 5,756 | $129,592 |
| Income Deficit | 3,941 | $12,770 |
| Wage / Income Gap (%) | 14,411 | 11.30% |
| Wage / Income Gap ($) | 14,411 | 88.70¢ per $1 |
| Gini / Inequality Index | 14,411 | 0.38 |
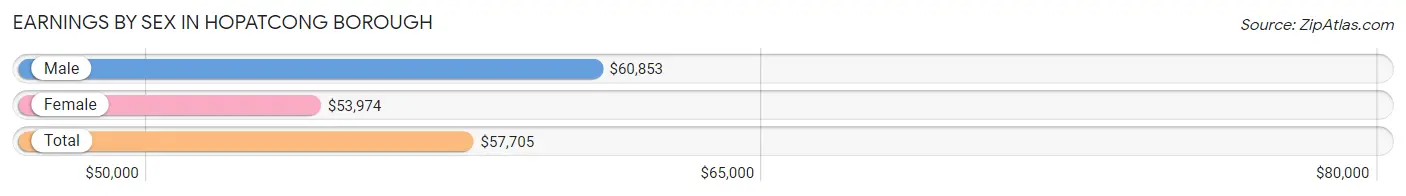
Earnings by Sex in Hopatcong borough
Average Earnings in Hopatcong borough are $57,705, $60,853 for men and $53,974 for women, a difference of 11.3%.
| Sex | Number | Average Earnings |
| Male | 4,877 (53.9%) | $60,853 |
| Female | 4,166 (46.1%) | $53,974 |
| Total | 9,043 (100.0%) | $57,705 |
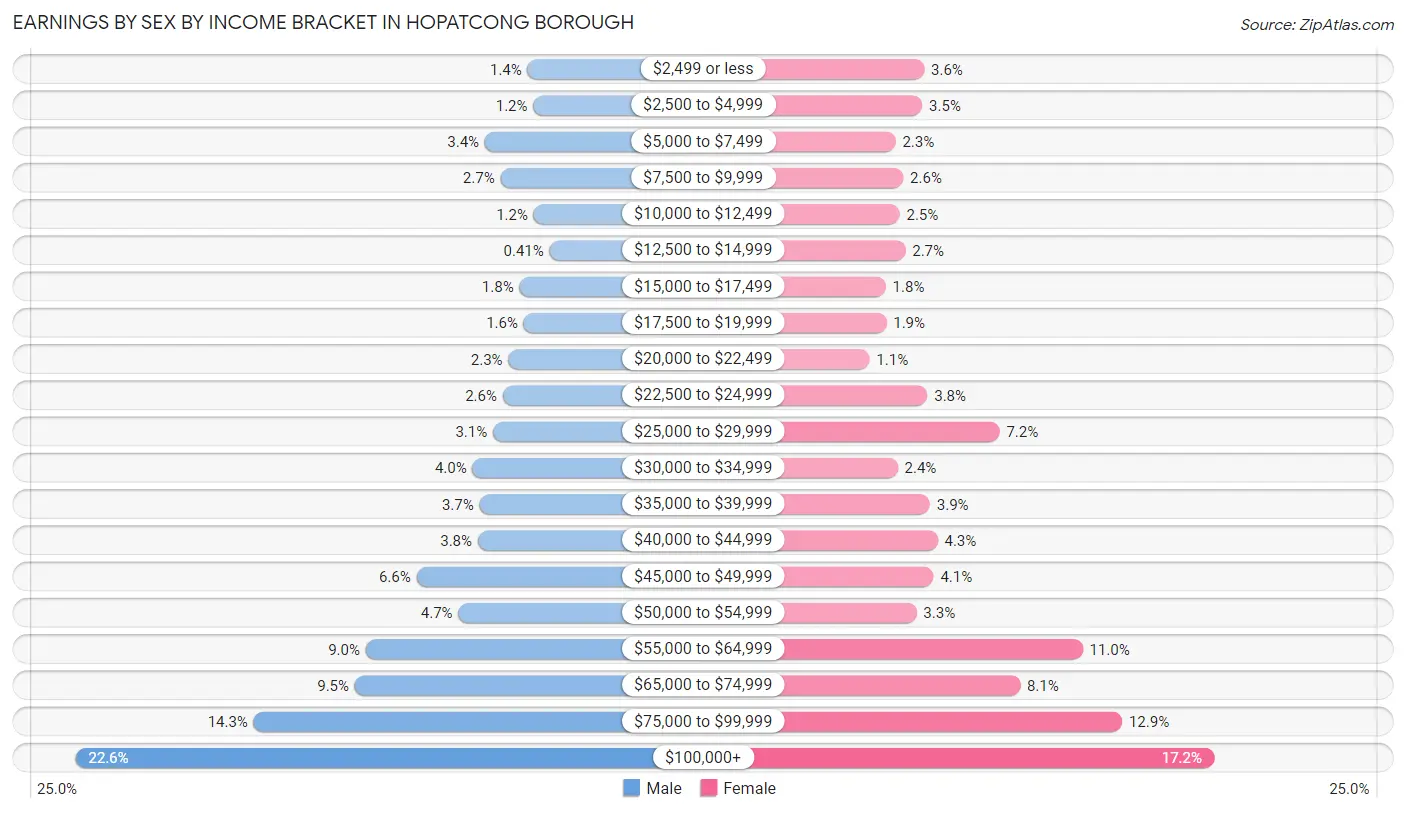
Earnings by Sex by Income Bracket in Hopatcong borough
The most common earnings brackets in Hopatcong borough are $100,000+ for men (1,103 | 22.6%) and $100,000+ for women (716 | 17.2%).
| Income | Male | Female |
| $2,499 or less | 70 (1.4%) | 151 (3.6%) |
| $2,500 to $4,999 | 57 (1.2%) | 147 (3.5%) |
| $5,000 to $7,499 | 168 (3.4%) | 95 (2.3%) |
| $7,500 to $9,999 | 132 (2.7%) | 110 (2.6%) |
| $10,000 to $12,499 | 56 (1.1%) | 103 (2.5%) |
| $12,500 to $14,999 | 20 (0.4%) | 114 (2.7%) |
| $15,000 to $17,499 | 89 (1.8%) | 76 (1.8%) |
| $17,500 to $19,999 | 79 (1.6%) | 77 (1.8%) |
| $20,000 to $22,499 | 114 (2.3%) | 44 (1.1%) |
| $22,500 to $24,999 | 127 (2.6%) | 157 (3.8%) |
| $25,000 to $29,999 | 149 (3.1%) | 298 (7.1%) |
| $30,000 to $34,999 | 196 (4.0%) | 99 (2.4%) |
| $35,000 to $39,999 | 180 (3.7%) | 162 (3.9%) |
| $40,000 to $44,999 | 184 (3.8%) | 177 (4.3%) |
| $45,000 to $49,999 | 324 (6.6%) | 169 (4.1%) |
| $50,000 to $54,999 | 228 (4.7%) | 136 (3.3%) |
| $55,000 to $64,999 | 440 (9.0%) | 460 (11.0%) |
| $65,000 to $74,999 | 465 (9.5%) | 338 (8.1%) |
| $75,000 to $99,999 | 696 (14.3%) | 537 (12.9%) |
| $100,000+ | 1,103 (22.6%) | 716 (17.2%) |
| Total | 4,877 (100.0%) | 4,166 (100.0%) |
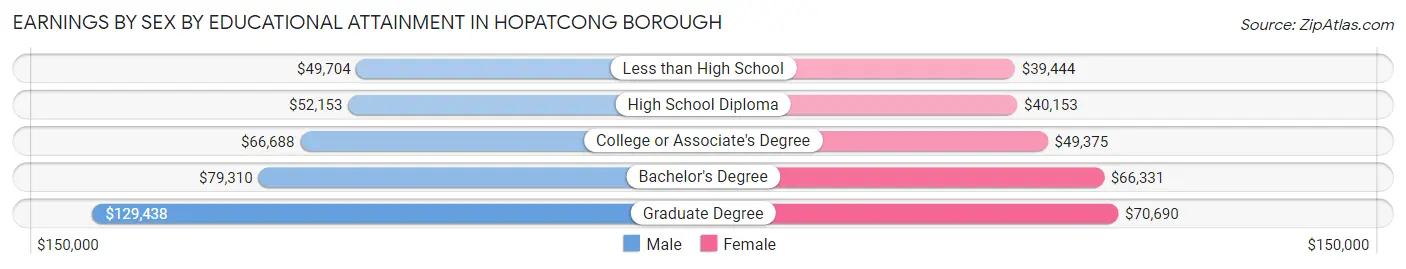
Earnings by Sex by Educational Attainment in Hopatcong borough
Average earnings in Hopatcong borough are $66,176 for men and $57,645 for women, a difference of 12.9%. Men with an educational attainment of graduate degree enjoy the highest average annual earnings of $129,438, while those with less than high school education earn the least with $49,704. Women with an educational attainment of graduate degree earn the most with the average annual earnings of $70,690, while those with less than high school education have the smallest earnings of $39,444.
| Educational Attainment | Male Income | Female Income |
| Less than High School | $49,704 | $39,444 |
| High School Diploma | $52,153 | $40,153 |
| College or Associate's Degree | $66,688 | $49,375 |
| Bachelor's Degree | $79,310 | $66,331 |
| Graduate Degree | $129,438 | $70,690 |
| Total | $66,176 | $57,645 |
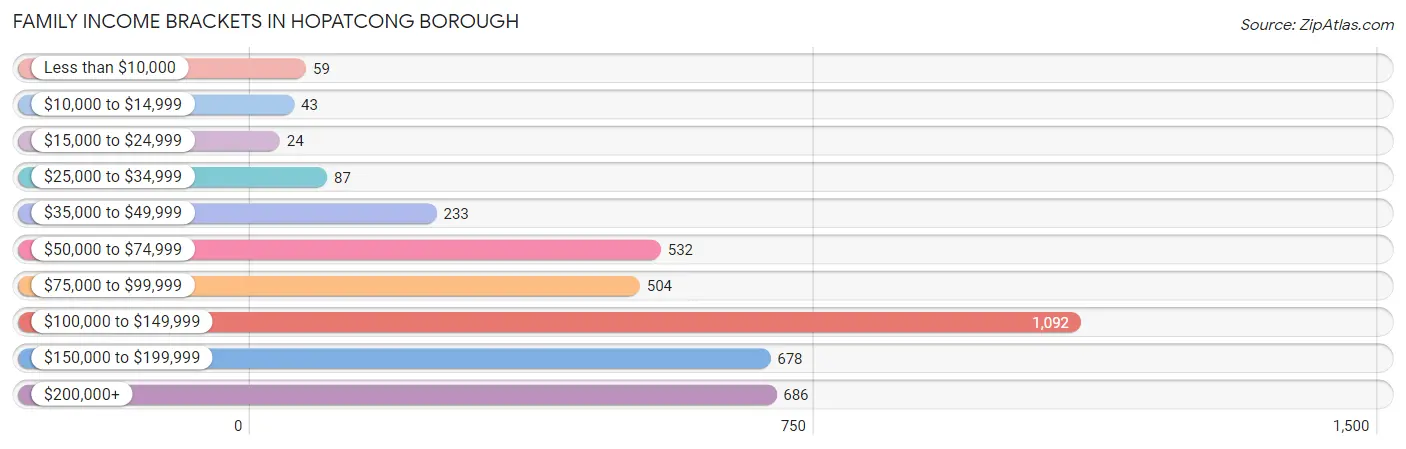
Family Income in Hopatcong borough
Family Income Brackets in Hopatcong borough
According to the Hopatcong borough family income data, there are 1,092 families falling into the $100,000 to $149,999 income range, which is the most common income bracket and makes up 27.7% of all families. Conversely, the $15,000 to $24,999 income bracket is the least frequent group with only 24 families (0.6%) belonging to this category.
| Income Bracket | # Families | % Families |
| Less than $10,000 | 59 | 1.5% |
| $10,000 to $14,999 | 43 | 1.1% |
| $15,000 to $24,999 | 24 | 0.6% |
| $25,000 to $34,999 | 87 | 2.2% |
| $35,000 to $49,999 | 233 | 5.9% |
| $50,000 to $74,999 | 532 | 13.5% |
| $75,000 to $99,999 | 504 | 12.8% |
| $100,000 to $149,999 | 1,092 | 27.7% |
| $150,000 to $199,999 | 678 | 17.2% |
| $200,000+ | 686 | 17.4% |
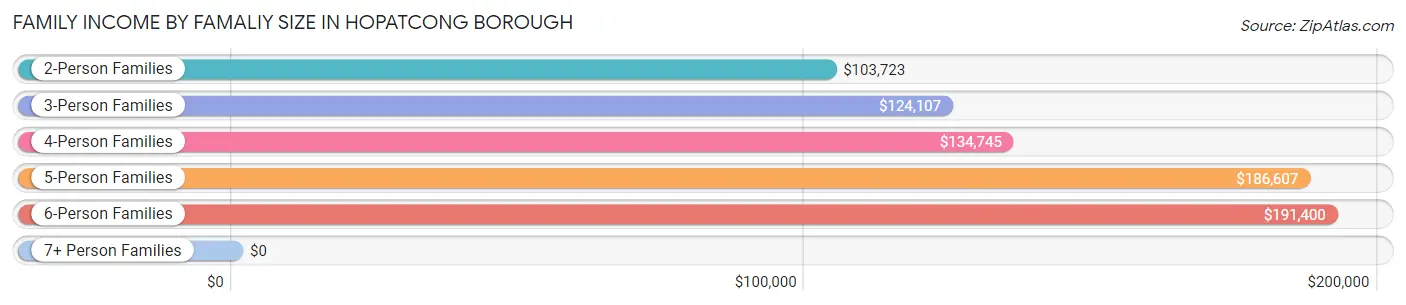
Family Income by Famaliy Size in Hopatcong borough
6-person families (134 | 3.4%) account for the highest median family income in Hopatcong borough with $191,400 per family, while 2-person families (1,711 | 43.4%) have the highest median income of $51,862 per family member.
| Income Bracket | # Families | Median Income |
| 2-Person Families | 1,711 (43.4%) | $103,723 |
| 3-Person Families | 1,005 (25.5%) | $124,107 |
| 4-Person Families | 838 (21.3%) | $134,745 |
| 5-Person Families | 243 (6.2%) | $186,607 |
| 6-Person Families | 134 (3.4%) | $191,400 |
| 7+ Person Families | 10 (0.3%) | $0 |
| Total | 3,941 (100.0%) | $123,706 |
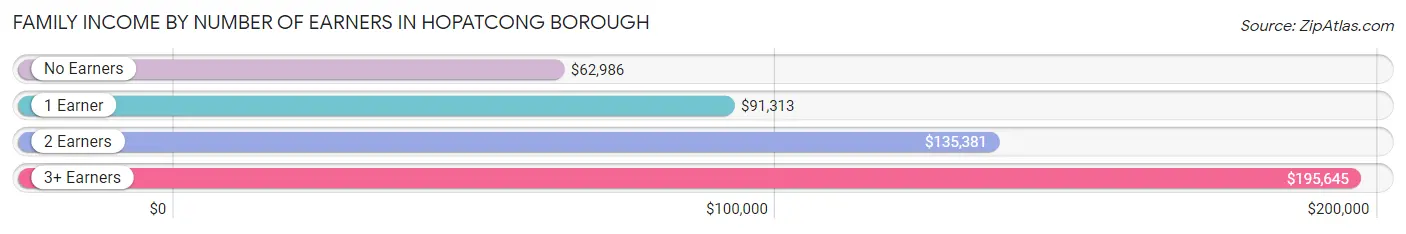
Family Income by Number of Earners in Hopatcong borough
The median family income in Hopatcong borough is $123,706, with families comprising 3+ earners (504) having the highest median family income of $195,645, while families with no earners (361) have the lowest median family income of $62,986, accounting for 12.8% and 9.2% of families, respectively.
| Number of Earners | # Families | Median Income |
| No Earners | 361 (9.2%) | $62,986 |
| 1 Earner | 1,167 (29.6%) | $91,313 |
| 2 Earners | 1,909 (48.4%) | $135,381 |
| 3+ Earners | 504 (12.8%) | $195,645 |
| Total | 3,941 (100.0%) | $123,706 |
Household Income in Hopatcong borough
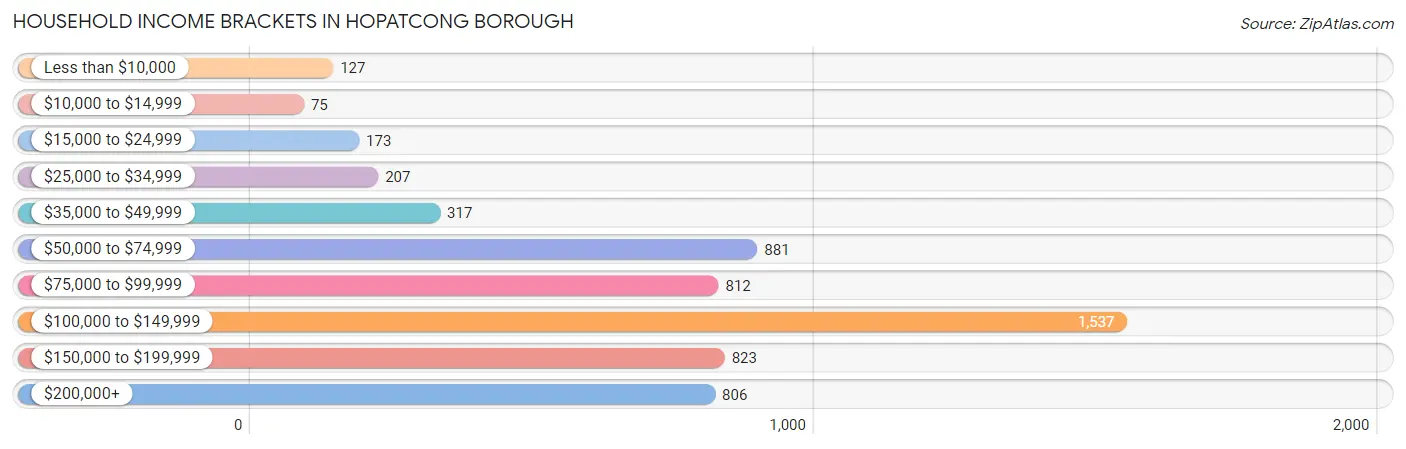
Household Income Brackets in Hopatcong borough
With 1,537 households falling in the category, the $100,000 to $149,999 income range is the most frequent in Hopatcong borough, accounting for 26.7% of all households. In contrast, only 75 households (1.3%) fall into the $10,000 to $14,999 income bracket, making it the least populous group.
| Income Bracket | # Households | % Households |
| Less than $10,000 | 127 | 2.2% |
| $10,000 to $14,999 | 75 | 1.3% |
| $15,000 to $24,999 | 173 | 3.0% |
| $25,000 to $34,999 | 207 | 3.6% |
| $35,000 to $49,999 | 317 | 5.5% |
| $50,000 to $74,999 | 881 | 15.3% |
| $75,000 to $99,999 | 812 | 14.1% |
| $100,000 to $149,999 | 1,537 | 26.7% |
| $150,000 to $199,999 | 823 | 14.3% |
| $200,000+ | 806 | 14.0% |
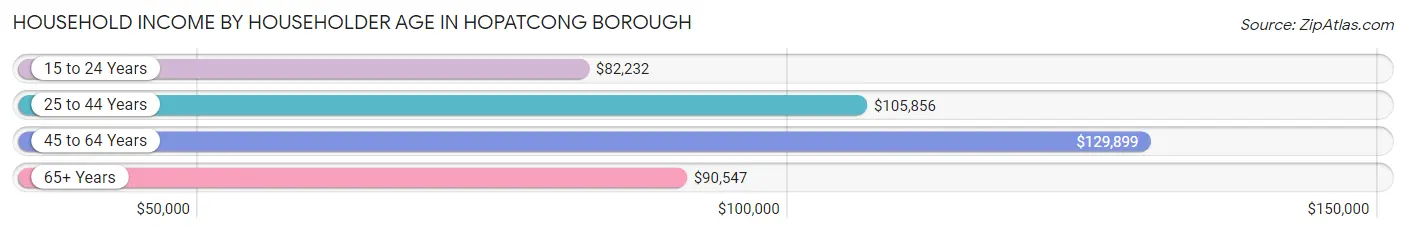
Household Income by Householder Age in Hopatcong borough
The median household income in Hopatcong borough is $107,670, with the highest median household income of $129,899 found in the 45 to 64 years age bracket for the primary householder. A total of 2,682 households (46.6%) fall into this category. Meanwhile, the 15 to 24 years age bracket for the primary householder has the lowest median household income of $82,232, with 75 households (1.3%) in this group.
| Income Bracket | # Households | Median Income |
| 15 to 24 Years | 75 (1.3%) | $82,232 |
| 25 to 44 Years | 1,806 (31.4%) | $105,856 |
| 45 to 64 Years | 2,682 (46.6%) | $129,899 |
| 65+ Years | 1,193 (20.7%) | $90,547 |
| Total | 5,756 (100.0%) | $107,670 |
Poverty in Hopatcong borough
Income Below Poverty by Sex and Age in Hopatcong borough
With 3.7% poverty level for males and 5.1% for females among the residents of Hopatcong borough, 6 to 11 year old males and 15 year old females are the most vulnerable to poverty, with 50 males (14.0%) and 8 females (11.9%) in their respective age groups living below the poverty level.
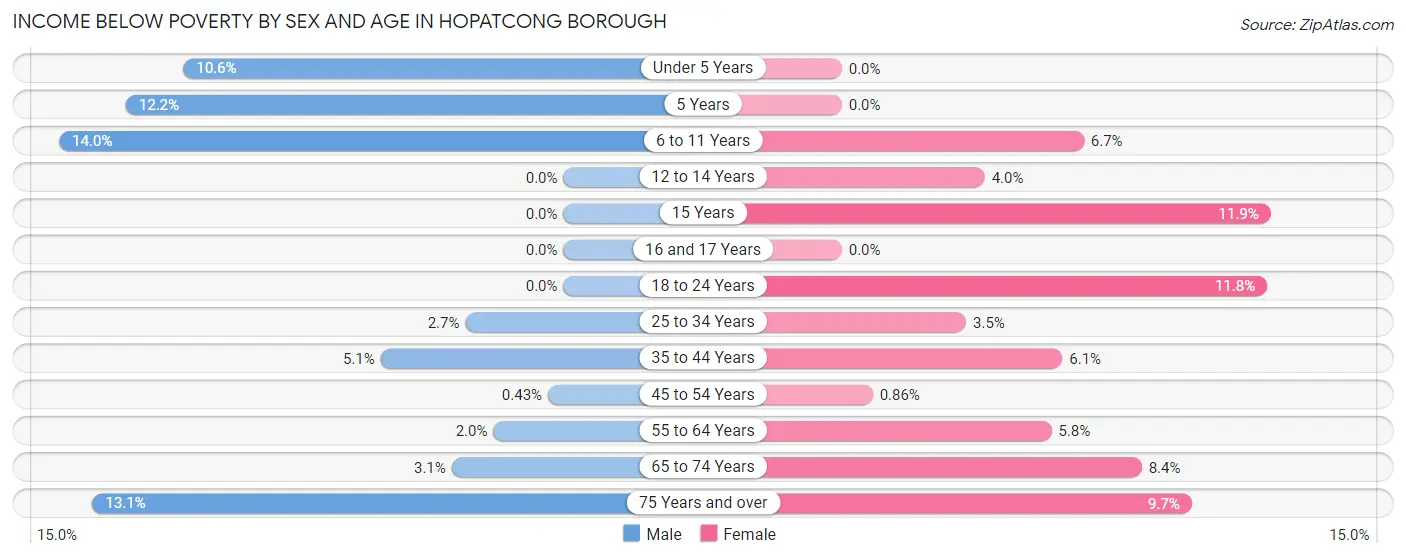
| Age Bracket | Male | Female |
| Under 5 Years | 31 (10.6%) | 0 (0.0%) |
| 5 Years | 19 (12.2%) | 0 (0.0%) |
| 6 to 11 Years | 50 (14.0%) | 37 (6.7%) |
| 12 to 14 Years | 0 (0.0%) | 9 (4.0%) |
| 15 Years | 0 (0.0%) | 8 (11.9%) |
| 16 and 17 Years | 0 (0.0%) | 0 (0.0%) |
| 18 to 24 Years | 0 (0.0%) | 47 (11.8%) |
| 25 to 34 Years | 29 (2.7%) | 40 (3.5%) |
| 35 to 44 Years | 51 (5.1%) | 61 (6.1%) |
| 45 to 54 Years | 5 (0.4%) | 10 (0.9%) |
| 55 to 64 Years | 24 (1.9%) | 63 (5.8%) |
| 65 to 74 Years | 19 (3.1%) | 58 (8.4%) |
| 75 Years and over | 40 (13.1%) | 30 (9.7%) |
| Total | 268 (3.7%) | 363 (5.1%) |
Income Above Poverty by Sex and Age in Hopatcong borough
According to the poverty statistics in Hopatcong borough, males aged 12 to 14 years and females aged under 5 years are the age groups that are most secure financially, with 100.0% of males and 100.0% of females in these age groups living above the poverty line.
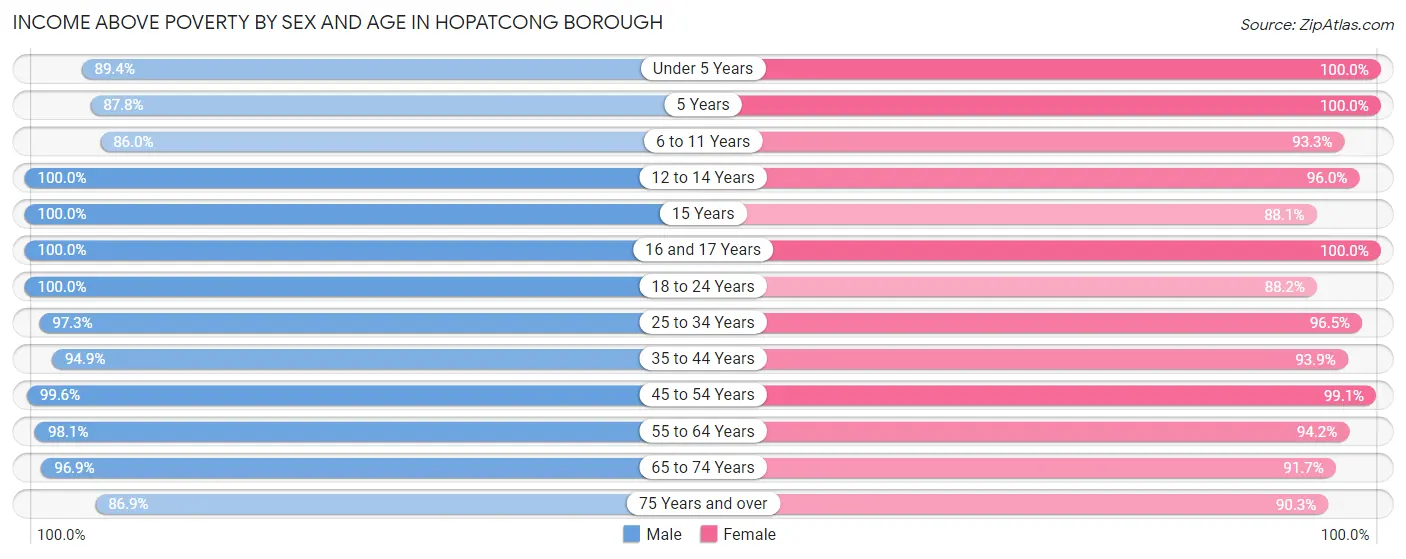
| Age Bracket | Male | Female |
| Under 5 Years | 262 (89.4%) | 280 (100.0%) |
| 5 Years | 137 (87.8%) | 133 (100.0%) |
| 6 to 11 Years | 306 (86.0%) | 512 (93.3%) |
| 12 to 14 Years | 228 (100.0%) | 217 (96.0%) |
| 15 Years | 159 (100.0%) | 59 (88.1%) |
| 16 and 17 Years | 120 (100.0%) | 81 (100.0%) |
| 18 to 24 Years | 570 (100.0%) | 350 (88.2%) |
| 25 to 34 Years | 1,035 (97.3%) | 1,117 (96.5%) |
| 35 to 44 Years | 951 (94.9%) | 932 (93.9%) |
| 45 to 54 Years | 1,159 (99.6%) | 1,149 (99.1%) |
| 55 to 64 Years | 1,209 (98.1%) | 1,015 (94.2%) |
| 65 to 74 Years | 592 (96.9%) | 637 (91.6%) |
| 75 Years and over | 265 (86.9%) | 278 (90.3%) |
| Total | 6,993 (96.3%) | 6,760 (94.9%) |
Income Below Poverty Among Married-Couple Families in Hopatcong borough
The poverty statistics for married-couple families in Hopatcong borough show that 2.1% or 65 of the total 3,050 families live below the poverty line. Families with 3 or 4 children have the highest poverty rate of 15.9%, comprising of 29 families. On the other hand, families with 1 or 2 children have the lowest poverty rate of 0.0%, which includes 0 families.
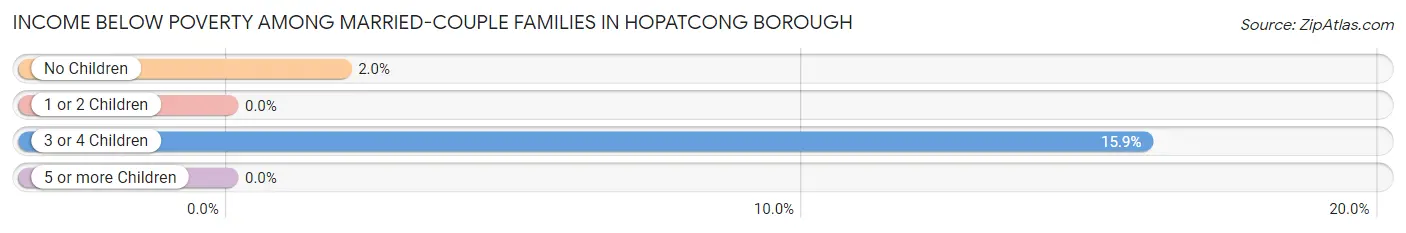
| Children | Above Poverty | Below Poverty |
| No Children | 1,787 (98.0%) | 36 (2.0%) |
| 1 or 2 Children | 1,045 (100.0%) | 0 (0.0%) |
| 3 or 4 Children | 153 (84.1%) | 29 (15.9%) |
| 5 or more Children | 0 (0.0%) | 0 (0.0%) |
| Total | 2,985 (97.9%) | 65 (2.1%) |
Income Below Poverty Among Single-Parent Households in Hopatcong borough
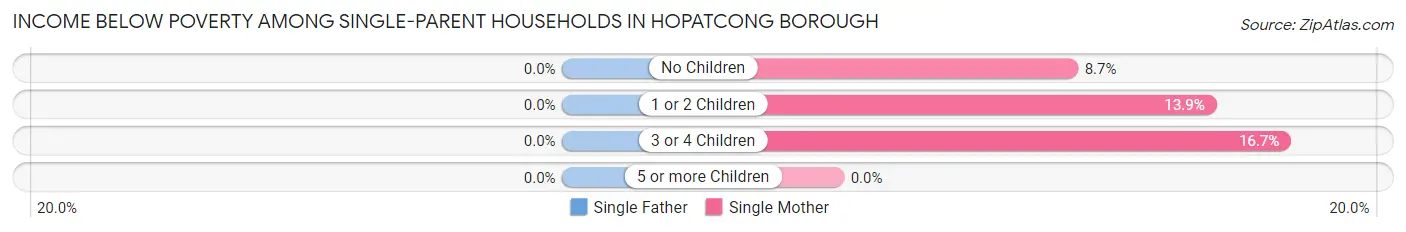
| Children | Single Father | Single Mother |
| No Children | 0 (0.0%) | 19 (8.7%) |
| 1 or 2 Children | 0 (0.0%) | 45 (13.9%) |
| 3 or 4 Children | 0 (0.0%) | 11 (16.7%) |
| 5 or more Children | 0 (0.0%) | 0 (0.0%) |
| Total | 0 (0.0%) | 75 (12.3%) |
Income Below Poverty Among Married-Couple vs Single-Parent Households in Hopatcong borough
The poverty data for Hopatcong borough shows that 65 of the married-couple family households (2.1%) and 75 of the single-parent households (8.4%) are living below the poverty level. Within the married-couple family households, those with 3 or 4 children have the highest poverty rate, with 29 households (15.9%) falling below the poverty line. Among the single-parent households, those with 3 or 4 children have the highest poverty rate, with 11 household (14.7%) living below poverty.
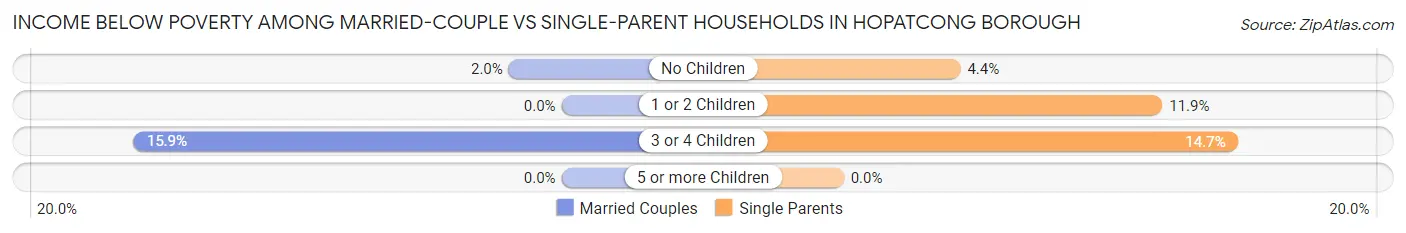
| Children | Married-Couple Families | Single-Parent Households |
| No Children | 36 (2.0%) | 19 (4.3%) |
| 1 or 2 Children | 0 (0.0%) | 45 (11.9%) |
| 3 or 4 Children | 29 (15.9%) | 11 (14.7%) |
| 5 or more Children | 0 (0.0%) | 0 (0.0%) |
| Total | 65 (2.1%) | 75 (8.4%) |
Race in Hopatcong borough
The most populous races in Hopatcong borough are White / Caucasian (11,751 | 81.5%), Hispanic or Latino (2,542 | 17.6%), and Two or more Races (1,209 | 8.4%).
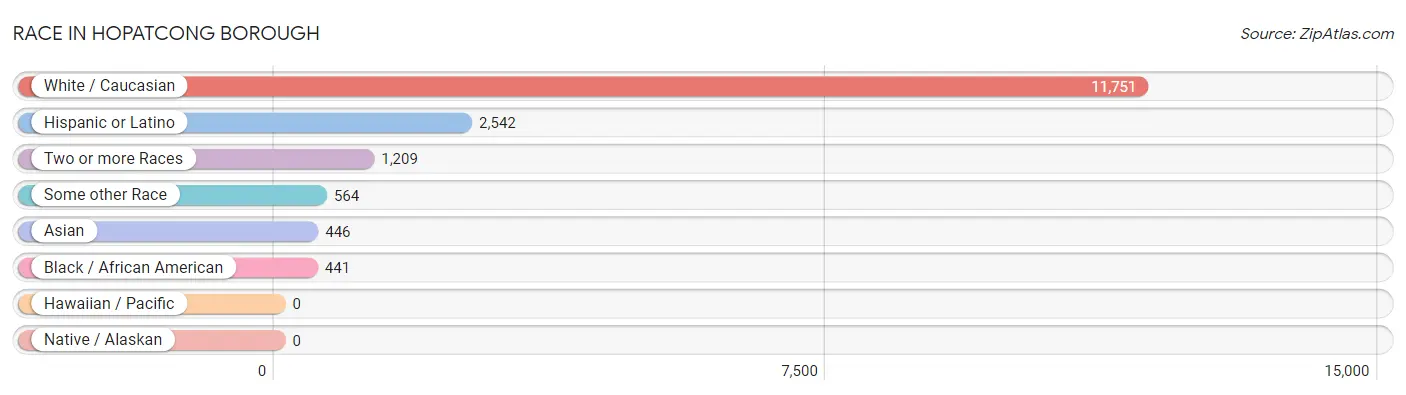
| Race | # Population | % Population |
| Asian | 446 | 3.1% |
| Black / African American | 441 | 3.1% |
| Hawaiian / Pacific | 0 | 0.0% |
| Hispanic or Latino | 2,542 | 17.6% |
| Native / Alaskan | 0 | 0.0% |
| White / Caucasian | 11,751 | 81.5% |
| Two or more Races | 1,209 | 8.4% |
| Some other Race | 564 | 3.9% |
| Total | 14,411 | 100.0% |
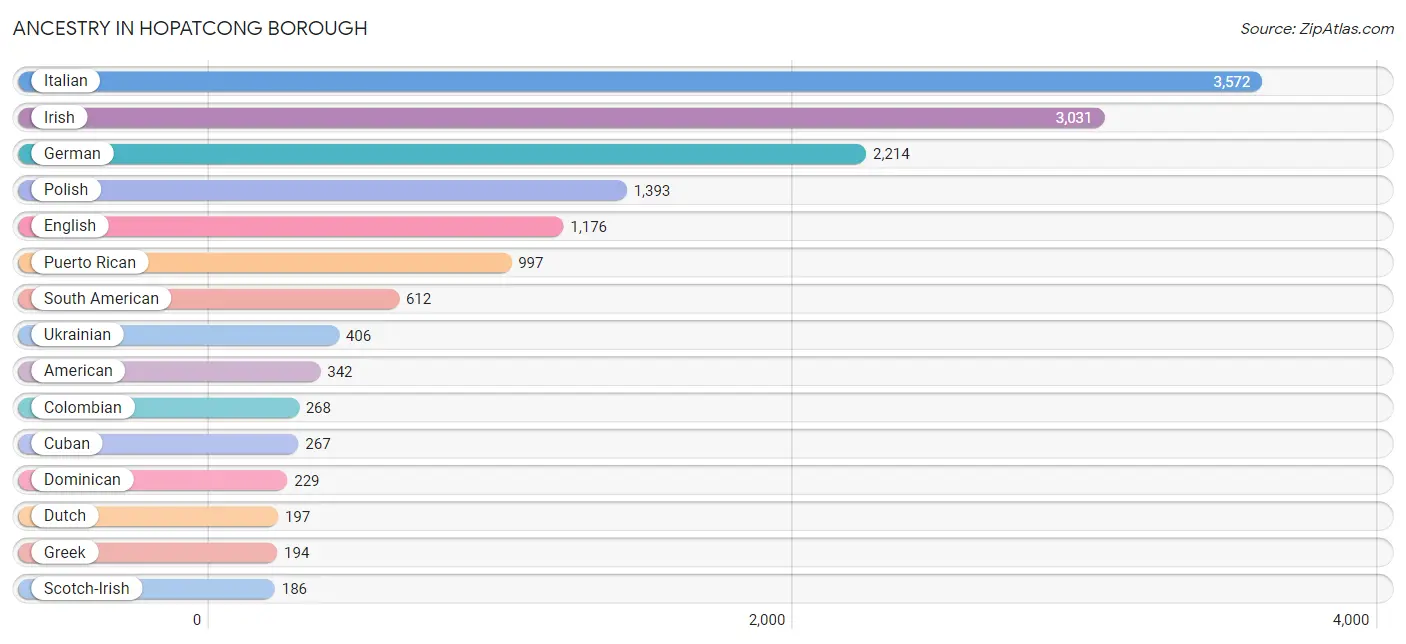
Ancestry in Hopatcong borough
The most populous ancestries reported in Hopatcong borough are Italian (3,572 | 24.8%), Irish (3,031 | 21.0%), German (2,214 | 15.4%), Polish (1,393 | 9.7%), and English (1,176 | 8.2%), together accounting for 79.0% of all Hopatcong borough residents.
| Ancestry | # Population | % Population |
| African | 55 | 0.4% |
| Albanian | 21 | 0.2% |
| American | 342 | 2.4% |
| Arab | 31 | 0.2% |
| Argentinean | 37 | 0.3% |
| Armenian | 45 | 0.3% |
| Austrian | 53 | 0.4% |
| Barbadian | 21 | 0.2% |
| Basque | 11 | 0.1% |
| Bhutanese | 19 | 0.1% |
| Blackfeet | 39 | 0.3% |
| Bolivian | 6 | 0.0% |
| British | 46 | 0.3% |
| Canadian | 9 | 0.1% |
| Celtic | 8 | 0.1% |
| Central American | 64 | 0.4% |
| Cherokee | 43 | 0.3% |
| Chilean | 31 | 0.2% |
| Colombian | 268 | 1.9% |
| Costa Rican | 7 | 0.1% |
| Croatian | 46 | 0.3% |
| Cuban | 267 | 1.8% |
| Czech | 61 | 0.4% |
| Czechoslovakian | 8 | 0.1% |
| Danish | 8 | 0.1% |
| Dominican | 229 | 1.6% |
| Dutch | 197 | 1.4% |
| Eastern European | 50 | 0.4% |
| Ecuadorian | 77 | 0.5% |
| Egyptian | 20 | 0.1% |
| English | 1,176 | 8.2% |
| Estonian | 12 | 0.1% |
| European | 115 | 0.8% |
| Filipino | 14 | 0.1% |
| Finnish | 24 | 0.2% |
| French | 164 | 1.1% |
| French Canadian | 47 | 0.3% |
| German | 2,214 | 15.4% |
| Ghanaian | 47 | 0.3% |
| Greek | 194 | 1.3% |
| Haitian | 40 | 0.3% |
| Hungarian | 178 | 1.2% |
| Indian (Asian) | 175 | 1.2% |
| Irish | 3,031 | 21.0% |
| Israeli | 11 | 0.1% |
| Italian | 3,572 | 24.8% |
| Jamaican | 15 | 0.1% |
| Korean | 176 | 1.2% |
| Lithuanian | 136 | 0.9% |
| Luxembourger | 12 | 0.1% |
| Mexican | 136 | 0.9% |
| Mongolian | 9 | 0.1% |
| Norwegian | 50 | 0.4% |
| Pennsylvania German | 22 | 0.2% |
| Peruvian | 153 | 1.1% |
| Polish | 1,393 | 9.7% |
| Portuguese | 152 | 1.1% |
| Puerto Rican | 997 | 6.9% |
| Romanian | 22 | 0.2% |
| Russian | 95 | 0.7% |
| Salvadoran | 57 | 0.4% |
| Scotch-Irish | 186 | 1.3% |
| Scottish | 179 | 1.2% |
| Slavic | 62 | 0.4% |
| Slovak | 47 | 0.3% |
| South African | 19 | 0.1% |
| South American | 612 | 4.3% |
| Spaniard | 28 | 0.2% |
| Spanish | 89 | 0.6% |
| Sri Lankan | 10 | 0.1% |
| Subsaharan African | 121 | 0.8% |
| Swedish | 173 | 1.2% |
| Swiss | 21 | 0.2% |
| Syrian | 11 | 0.1% |
| Thai | 45 | 0.3% |
| Ukrainian | 406 | 2.8% |
| Uruguayan | 40 | 0.3% |
| Welsh | 49 | 0.3% |
| West Indian | 101 | 0.7% | View All 79 Rows |
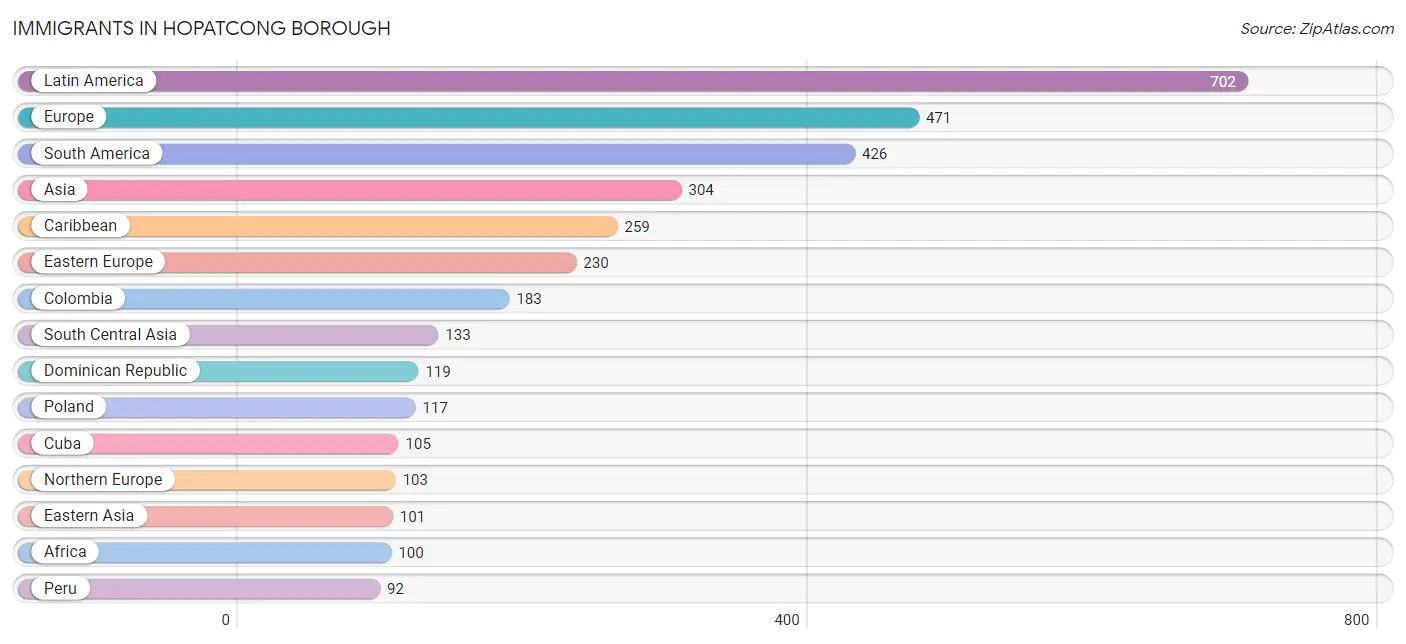
Immigrants in Hopatcong borough
The most numerous immigrant groups reported in Hopatcong borough came from Latin America (702 | 4.9%), Europe (471 | 3.3%), South America (426 | 3.0%), Asia (304 | 2.1%), and Caribbean (259 | 1.8%), together accounting for 15.0% of all Hopatcong borough residents.
| Immigration Origin | # Population | % Population |
| Afghanistan | 59 | 0.4% |
| Africa | 100 | 0.7% |
| Albania | 31 | 0.2% |
| Argentina | 54 | 0.4% |
| Asia | 304 | 2.1% |
| Austria | 8 | 0.1% |
| Bolivia | 6 | 0.0% |
| Brazil | 24 | 0.2% |
| Canada | 5 | 0.0% |
| Caribbean | 259 | 1.8% |
| Central America | 17 | 0.1% |
| China | 82 | 0.6% |
| Colombia | 183 | 1.3% |
| Cuba | 105 | 0.7% |
| Dominican Republic | 119 | 0.8% |
| Eastern Africa | 15 | 0.1% |
| Eastern Asia | 101 | 0.7% |
| Eastern Europe | 230 | 1.6% |
| Ecuador | 24 | 0.2% |
| Egypt | 9 | 0.1% |
| El Salvador | 16 | 0.1% |
| England | 22 | 0.2% |
| Europe | 471 | 3.3% |
| Germany | 34 | 0.2% |
| Ghana | 21 | 0.2% |
| Greece | 27 | 0.2% |
| Guatemala | 1 | 0.0% |
| Haiti | 14 | 0.1% |
| Hong Kong | 32 | 0.2% |
| India | 59 | 0.4% |
| Italy | 13 | 0.1% |
| Jamaica | 21 | 0.2% |
| Japan | 19 | 0.1% |
| Kenya | 15 | 0.1% |
| Latin America | 702 | 4.9% |
| Malaysia | 3 | 0.0% |
| Netherlands | 23 | 0.2% |
| Northern Africa | 9 | 0.1% |
| Northern Europe | 103 | 0.7% |
| Pakistan | 15 | 0.1% |
| Peru | 92 | 0.6% |
| Philippines | 67 | 0.5% |
| Poland | 117 | 0.8% |
| Portugal | 33 | 0.2% |
| Romania | 18 | 0.1% |
| Scotland | 81 | 0.6% |
| South America | 426 | 3.0% |
| South Central Asia | 133 | 0.9% |
| South Eastern Asia | 70 | 0.5% |
| Southern Europe | 73 | 0.5% |
| Taiwan | 14 | 0.1% |
| Ukraine | 52 | 0.4% |
| Uruguay | 40 | 0.3% |
| Western Africa | 21 | 0.2% |
| Western Europe | 65 | 0.4% | View All 55 Rows |
Sex and Age in Hopatcong borough
Sex and Age in Hopatcong borough
The most populous age groups in Hopatcong borough are 55 to 59 Years (712 | 9.8%) for men and 25 to 29 Years (618 | 8.7%) for women.
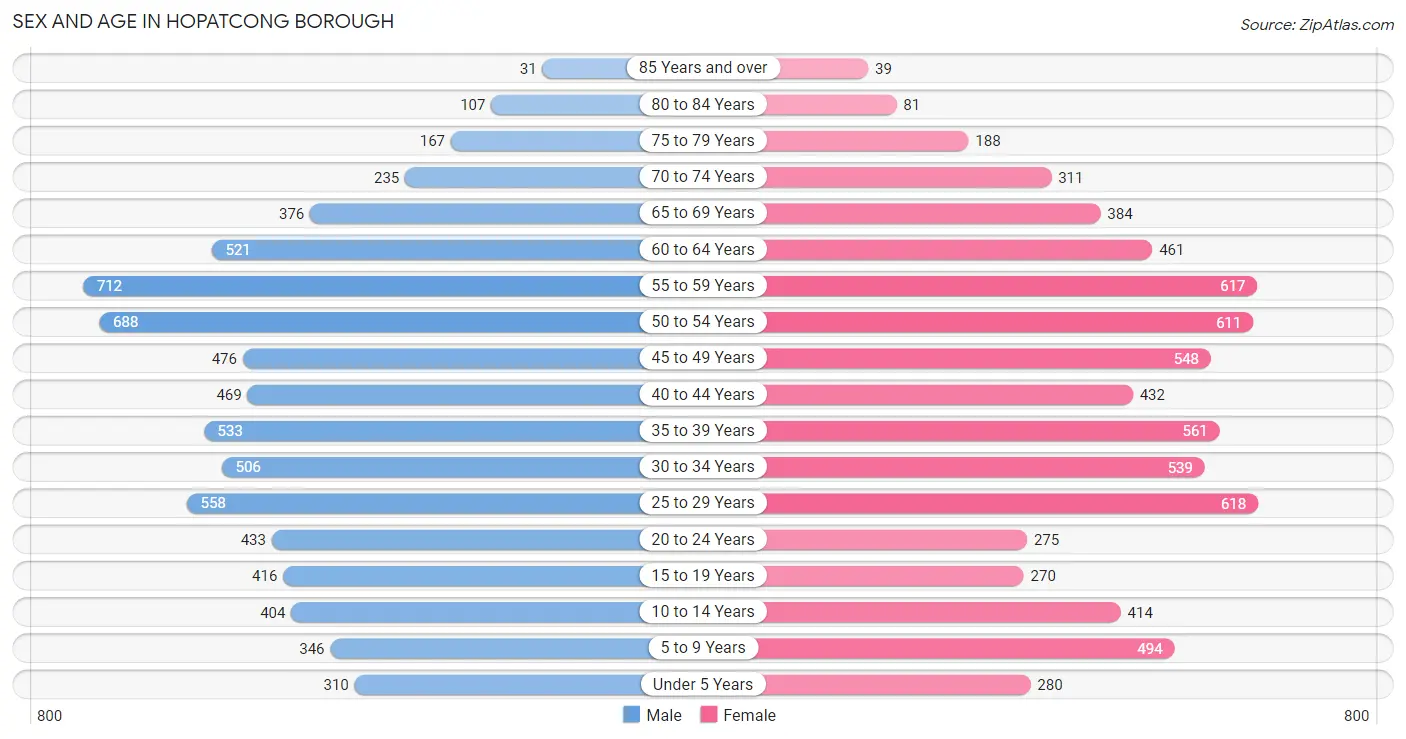
| Age Bracket | Male | Female |
| Under 5 Years | 310 (4.3%) | 280 (3.9%) |
| 5 to 9 Years | 346 (4.8%) | 494 (6.9%) |
| 10 to 14 Years | 404 (5.5%) | 414 (5.8%) |
| 15 to 19 Years | 416 (5.7%) | 270 (3.8%) |
| 20 to 24 Years | 433 (5.9%) | 275 (3.9%) |
| 25 to 29 Years | 558 (7.7%) | 618 (8.7%) |
| 30 to 34 Years | 506 (6.9%) | 539 (7.6%) |
| 35 to 39 Years | 533 (7.3%) | 561 (7.9%) |
| 40 to 44 Years | 469 (6.4%) | 432 (6.1%) |
| 45 to 49 Years | 476 (6.5%) | 548 (7.7%) |
| 50 to 54 Years | 688 (9.4%) | 611 (8.6%) |
| 55 to 59 Years | 712 (9.8%) | 617 (8.7%) |
| 60 to 64 Years | 521 (7.1%) | 461 (6.5%) |
| 65 to 69 Years | 376 (5.2%) | 384 (5.4%) |
| 70 to 74 Years | 235 (3.2%) | 311 (4.4%) |
| 75 to 79 Years | 167 (2.3%) | 188 (2.6%) |
| 80 to 84 Years | 107 (1.5%) | 81 (1.1%) |
| 85 Years and over | 31 (0.4%) | 39 (0.5%) |
| Total | 7,288 (100.0%) | 7,123 (100.0%) |
Families and Households in Hopatcong borough
Median Family Size in Hopatcong borough
The median family size in Hopatcong borough is 2.99 persons per family, with married-couple families (3,050 | 77.4%) accounting for the largest median family size of 3.04 persons per family. On the other hand, single male/father families (283 | 7.2%) represent the smallest median family size with 2.55 persons per family.
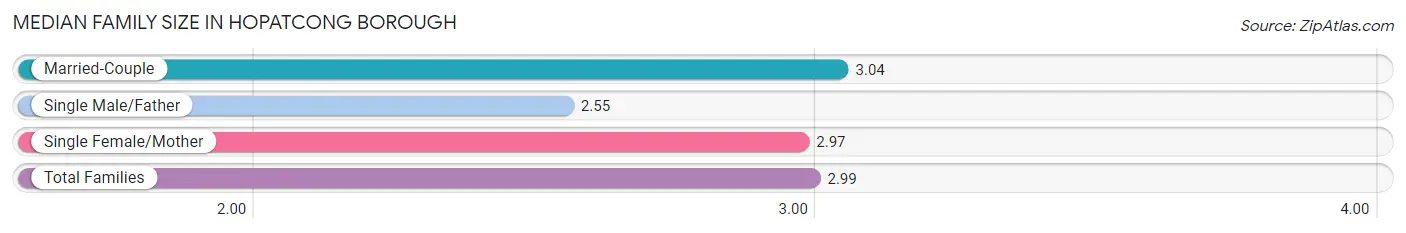
| Family Type | # Families | Family Size |
| Married-Couple | 3,050 (77.4%) | 3.04 |
| Single Male/Father | 283 (7.2%) | 2.55 |
| Single Female/Mother | 608 (15.4%) | 2.97 |
| Total Families | 3,941 (100.0%) | 2.99 |
Median Household Size in Hopatcong borough
The median household size in Hopatcong borough is 2.50 persons per household, with single female/mother households (608 | 10.6%) accounting for the largest median household size of 3.15 persons per household. non-family households (1,815 | 31.5%) represent the smallest median household size with 1.28 persons per household.
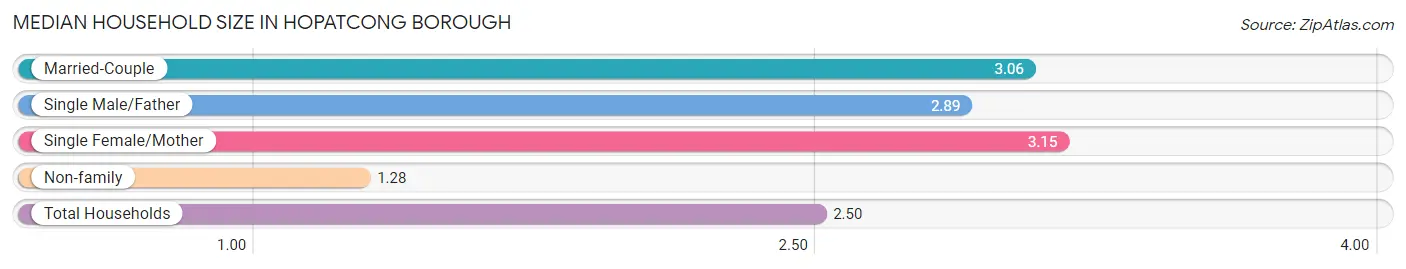
| Household Type | # Households | Household Size |
| Married-Couple | 3,050 (53.0%) | 3.06 |
| Single Male/Father | 283 (4.9%) | 2.89 |
| Single Female/Mother | 608 (10.6%) | 3.15 |
| Non-family | 1,815 (31.5%) | 1.28 |
| Total Households | 5,756 (100.0%) | 2.50 |
Household Size by Marriage Status in Hopatcong borough
Out of a total of 5,756 households in Hopatcong borough, 3,941 (68.5%) are family households, while 1,815 (31.5%) are nonfamily households. The most numerous type of family households are 2-person households, comprising 1,621, and the most common type of nonfamily households are 1-person households, comprising 1,387.
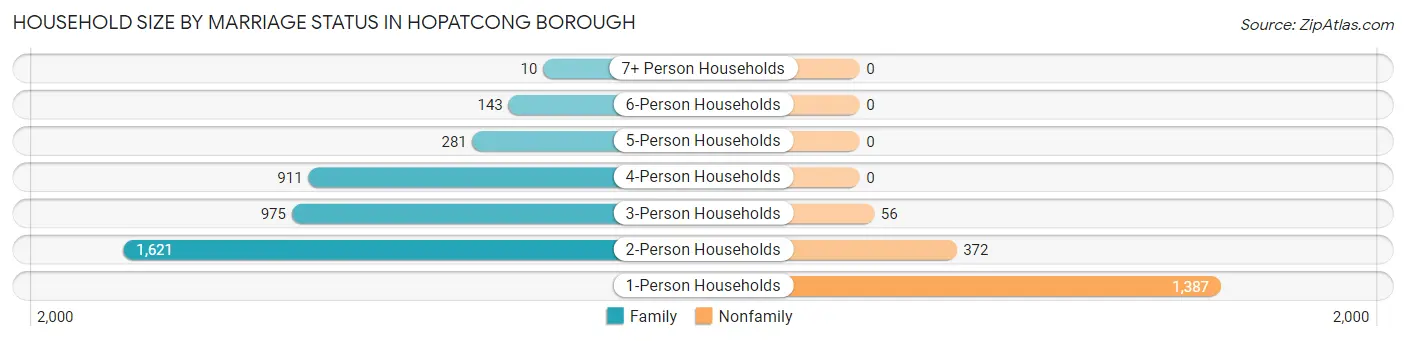
| Household Size | Family Households | Nonfamily Households |
| 1-Person Households | - | 1,387 (24.1%) |
| 2-Person Households | 1,621 (28.2%) | 372 (6.5%) |
| 3-Person Households | 975 (16.9%) | 56 (1.0%) |
| 4-Person Households | 911 (15.8%) | 0 (0.0%) |
| 5-Person Households | 281 (4.9%) | 0 (0.0%) |
| 6-Person Households | 143 (2.5%) | 0 (0.0%) |
| 7+ Person Households | 10 (0.2%) | 0 (0.0%) |
| Total | 3,941 (68.5%) | 1,815 (31.5%) |
Female Fertility in Hopatcong borough
Fertility by Age in Hopatcong borough
Average fertility rate in Hopatcong borough is 36.0 births per 1,000 women. Women in the age bracket of 20 to 34 years have the highest fertility rate with 70.0 births per 1,000 women. Women in the age bracket of 20 to 34 years acount for 80.6% of all women with births.
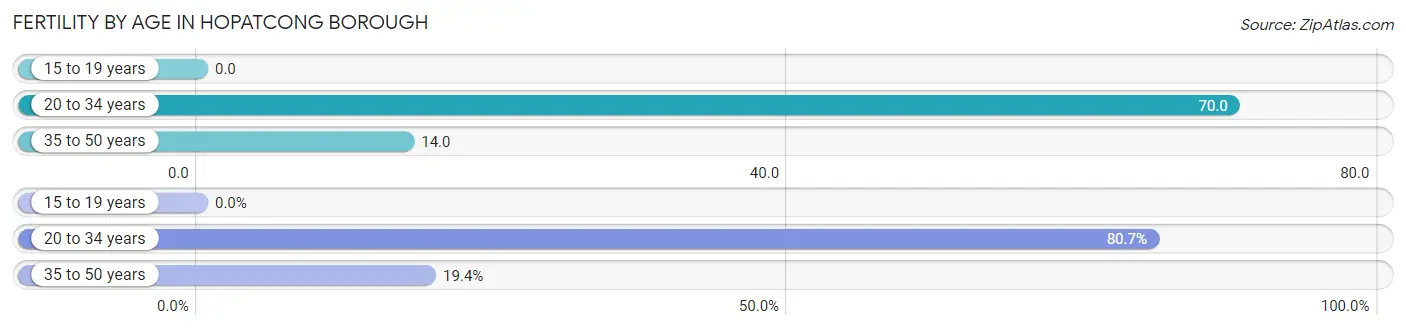
| Age Bracket | Women with Births | Births / 1,000 Women |
| 15 to 19 years | 0 (0.0%) | 0.0 |
| 20 to 34 years | 100 (80.6%) | 70.0 |
| 35 to 50 years | 24 (19.4%) | 14.0 |
| Total | 124 (100.0%) | 36.0 |
Fertility by Age by Marriage Status in Hopatcong borough
50.8% of women with births (124) in Hopatcong borough are married. The highest percentage of unmarried women with births falls into 35 to 50 years age bracket with 75.0% of them unmarried at the time of birth, while the lowest percentage of unmarried women with births belong to 20 to 34 years age bracket with 43.0% of them unmarried.
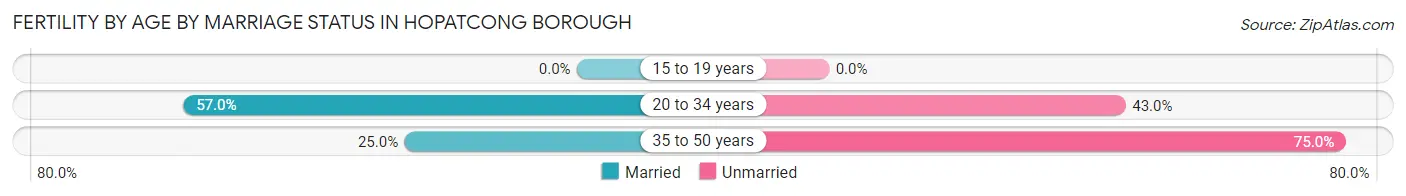
| Age Bracket | Married | Unmarried |
| 15 to 19 years | 0 (0.0%) | 0 (0.0%) |
| 20 to 34 years | 57 (57.0%) | 43 (43.0%) |
| 35 to 50 years | 6 (25.0%) | 18 (75.0%) |
| Total | 63 (50.8%) | 61 (49.2%) |
Fertility by Education in Hopatcong borough
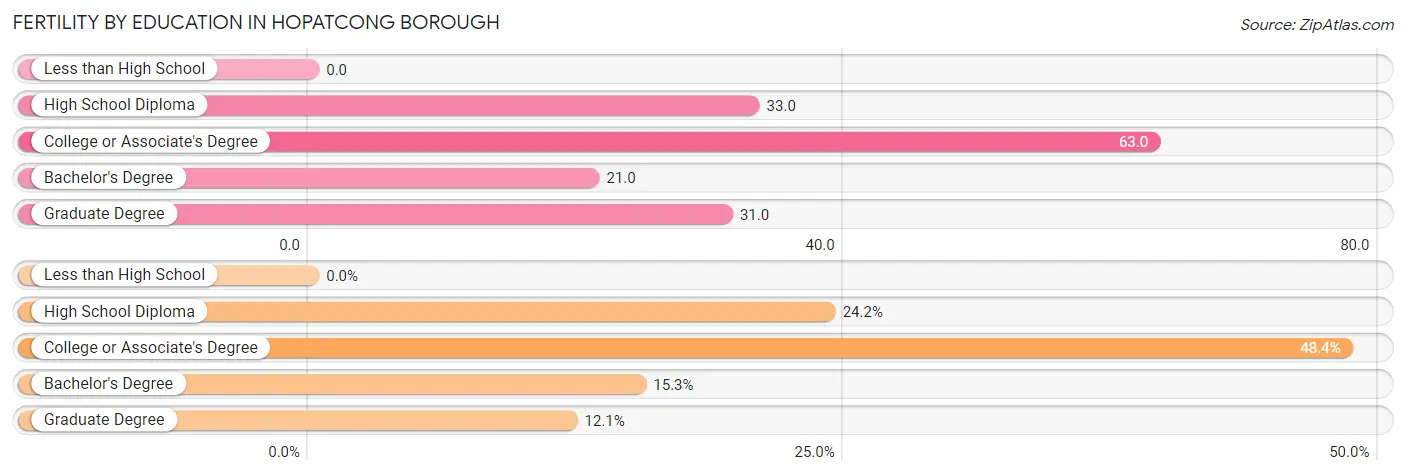
| Educational Attainment | Women with Births | Births / 1,000 Women |
| Less than High School | 0 (0.0%) | 0.0 |
| High School Diploma | 30 (24.2%) | 33.0 |
| College or Associate's Degree | 60 (48.4%) | 63.0 |
| Bachelor's Degree | 19 (15.3%) | 21.0 |
| Graduate Degree | 15 (12.1%) | 31.0 |
| Total | 124 (100.0%) | 36.0 |
Fertility by Education by Marriage Status in Hopatcong borough
49.2% of women with births in Hopatcong borough are unmarried. Women with the educational attainment of college or associate's degree are most likely to be married with 65.0% of them married at childbirth, while women with the educational attainment of bachelor's degree are least likely to be married with 68.4% of them unmarried at childbirth.
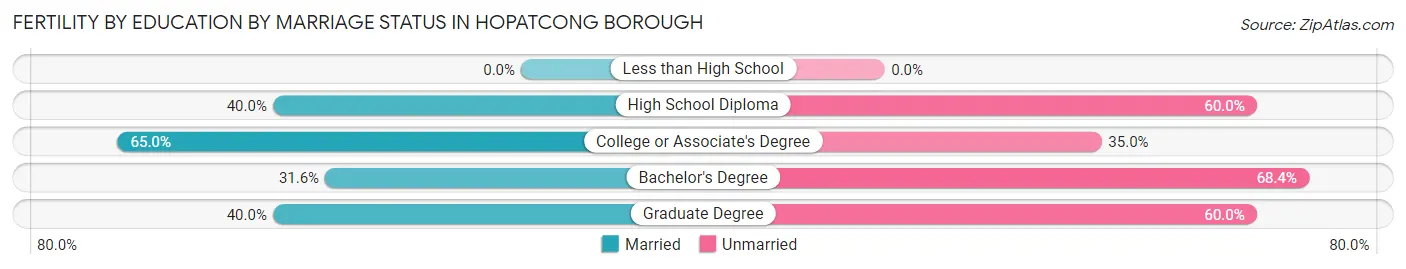
| Educational Attainment | Married | Unmarried |
| Less than High School | 0 (0.0%) | 0 (0.0%) |
| High School Diploma | 12 (40.0%) | 18 (60.0%) |
| College or Associate's Degree | 39 (65.0%) | 21 (35.0%) |
| Bachelor's Degree | 6 (31.6%) | 13 (68.4%) |
| Graduate Degree | 6 (40.0%) | 9 (60.0%) |
| Total | 63 (50.8%) | 61 (49.2%) |
Employment Characteristics in Hopatcong borough
Employment by Class of Employer in Hopatcong borough
Among the 8,367 employed individuals in Hopatcong borough, private company employees (6,015 | 71.9%), local government employees (627 | 7.5%), and state government employees (555 | 6.6%) make up the most common classes of employment.
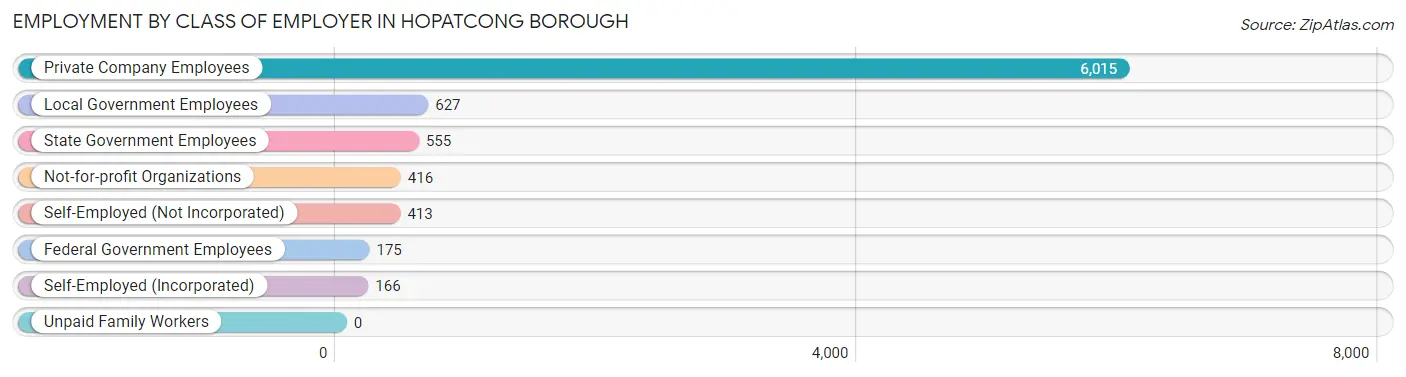
| Employer Class | # Employees | % Employees |
| Private Company Employees | 6,015 | 71.9% |
| Self-Employed (Incorporated) | 166 | 2.0% |
| Self-Employed (Not Incorporated) | 413 | 4.9% |
| Not-for-profit Organizations | 416 | 5.0% |
| Local Government Employees | 627 | 7.5% |
| State Government Employees | 555 | 6.6% |
| Federal Government Employees | 175 | 2.1% |
| Unpaid Family Workers | 0 | 0.0% |
| Total | 8,367 | 100.0% |
Employment Status by Age in Hopatcong borough
According to the labor force statistics for Hopatcong borough, out of the total population over 16 years of age (11,937), 74.2% or 8,857 individuals are in the labor force, with 3.1% or 275 of them unemployed. The age group with the highest labor force participation rate is 25 to 29 years, with 95.5% or 1,123 individuals in the labor force. Within the labor force, the 20 to 24 years age range has the highest percentage of unemployed individuals, with 9.1% or 53 of them being unemployed.
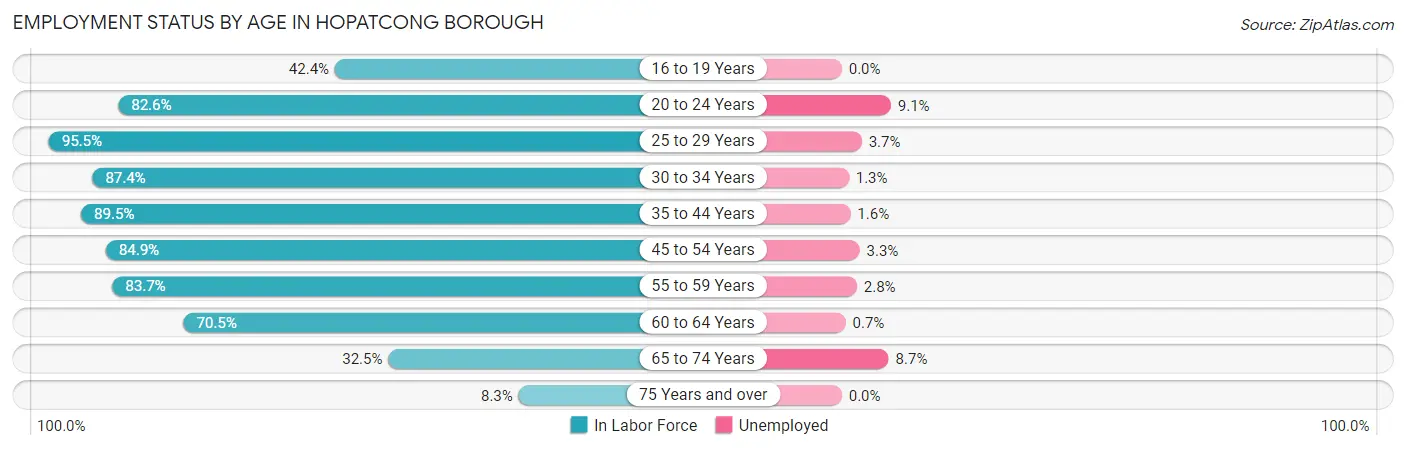
| Age Bracket | In Labor Force | Unemployed |
| 16 to 19 Years | 195 (42.4%) | 0 (0.0%) |
| 20 to 24 Years | 585 (82.6%) | 53 (9.1%) |
| 25 to 29 Years | 1,123 (95.5%) | 42 (3.7%) |
| 30 to 34 Years | 913 (87.4%) | 12 (1.3%) |
| 35 to 44 Years | 1,786 (89.5%) | 29 (1.6%) |
| 45 to 54 Years | 1,972 (84.9%) | 65 (3.3%) |
| 55 to 59 Years | 1,112 (83.7%) | 31 (2.8%) |
| 60 to 64 Years | 692 (70.5%) | 5 (0.7%) |
| 65 to 74 Years | 424 (32.5%) | 37 (8.7%) |
| 75 Years and over | 51 (8.3%) | 0 (0.0%) |
| Total | 8,857 (74.2%) | 275 (3.1%) |
Employment Status by Educational Attainment in Hopatcong borough
According to labor force statistics for Hopatcong borough, 85.9% of individuals (7,602) out of the total population between 25 and 64 years of age (8,850) are in the labor force, with 2.4% or 182 of them being unemployed. The group with the highest labor force participation rate are those with the educational attainment of bachelor's degree or higher, with 91.5% or 2,973 individuals in the labor force. Within the labor force, individuals with less than high school education have the highest percentage of unemployment, with 8.6% or 15 of them being unemployed.
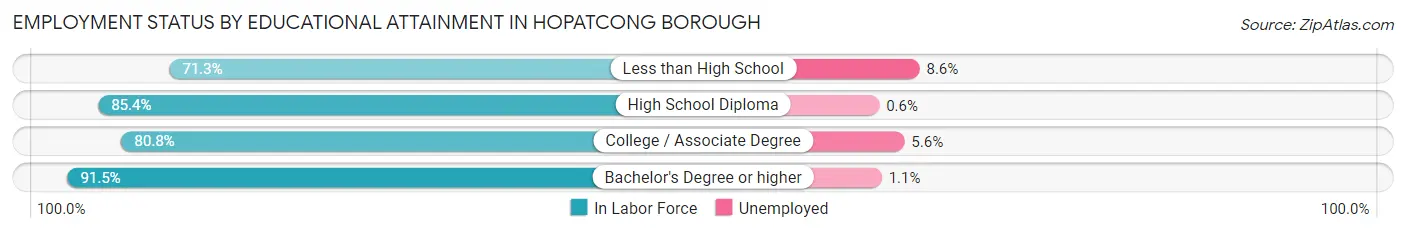
| Educational Attainment | In Labor Force | Unemployed |
| Less than High School | 174 (71.3%) | 21 (8.6%) |
| High School Diploma | 2,267 (85.4%) | 16 (0.6%) |
| College / Associate Degree | 2,184 (80.8%) | 151 (5.6%) |
| Bachelor's Degree or higher | 2,973 (91.5%) | 36 (1.1%) |
| Total | 7,602 (85.9%) | 212 (2.4%) |
Employment Occupations by Sex in Hopatcong borough
Management, Business, Science and Arts Occupations
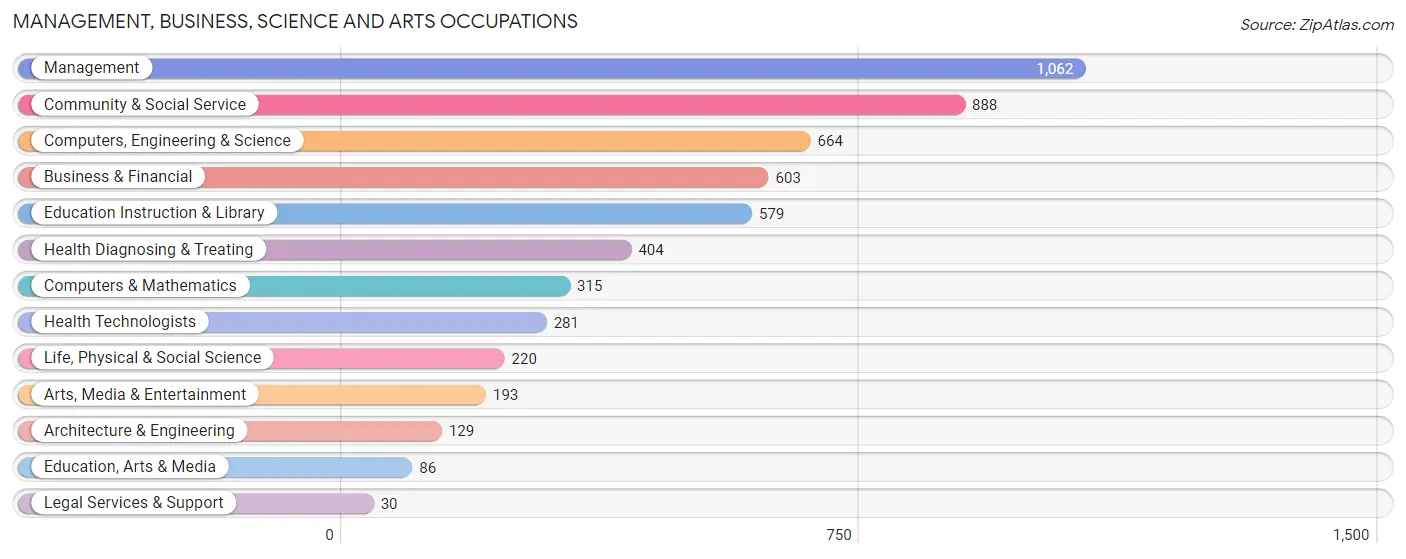
The most common Management, Business, Science and Arts occupations in Hopatcong borough are Management (1,062 | 12.4%), Community & Social Service (888 | 10.3%), Computers, Engineering & Science (664 | 7.7%), Business & Financial (603 | 7.0%), and Education Instruction & Library (579 | 6.8%).
Management, Business, Science and Arts Occupations by Sex
Within the Management, Business, Science and Arts occupations in Hopatcong borough, the most male-oriented occupations are Architecture & Engineering (88.4%), Computers & Mathematics (80.9%), and Arts, Media & Entertainment (80.3%), while the most female-oriented occupations are Education, Arts & Media (98.8%), Health Technologists (89.0%), and Health Diagnosing & Treating (83.9%).
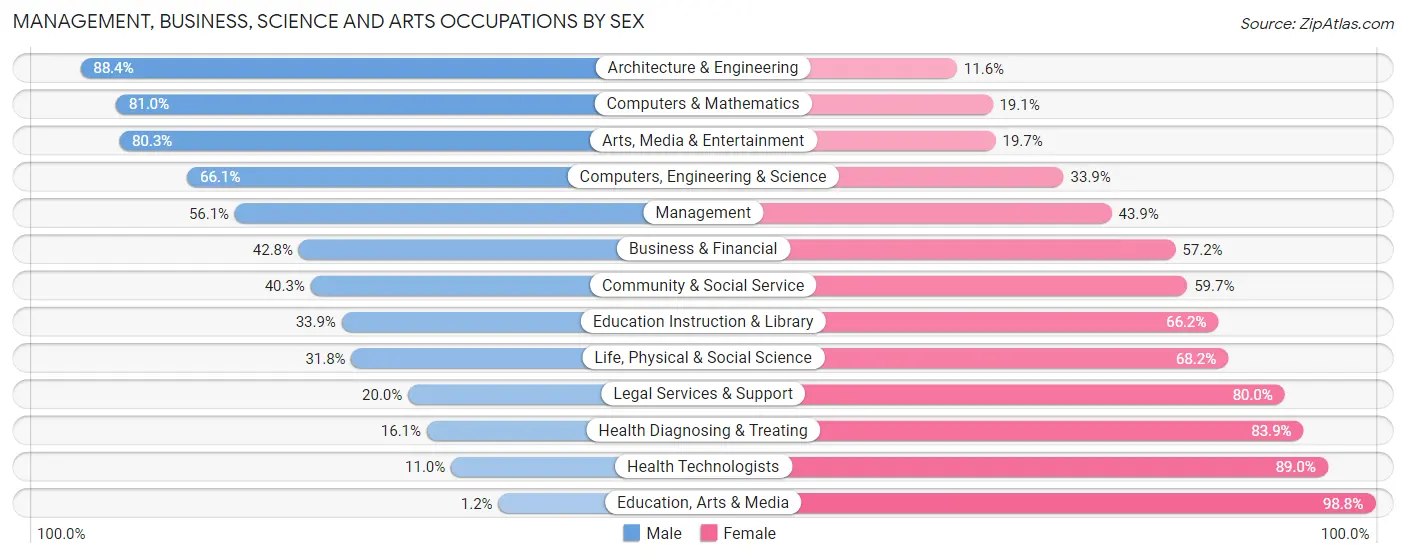
| Occupation | Male | Female |
| Management | 596 (56.1%) | 466 (43.9%) |
| Business & Financial | 258 (42.8%) | 345 (57.2%) |
| Computers, Engineering & Science | 439 (66.1%) | 225 (33.9%) |
| Computers & Mathematics | 255 (80.9%) | 60 (19.1%) |
| Architecture & Engineering | 114 (88.4%) | 15 (11.6%) |
| Life, Physical & Social Science | 70 (31.8%) | 150 (68.2%) |
| Community & Social Service | 358 (40.3%) | 530 (59.7%) |
| Education, Arts & Media | 1 (1.2%) | 85 (98.8%) |
| Legal Services & Support | 6 (20.0%) | 24 (80.0%) |
| Education Instruction & Library | 196 (33.9%) | 383 (66.1%) |
| Arts, Media & Entertainment | 155 (80.3%) | 38 (19.7%) |
| Health Diagnosing & Treating | 65 (16.1%) | 339 (83.9%) |
| Health Technologists | 31 (11.0%) | 250 (89.0%) |
| Total (Category) | 1,716 (47.4%) | 1,905 (52.6%) |
| Total (Overall) | 4,633 (54.0%) | 3,948 (46.0%) |
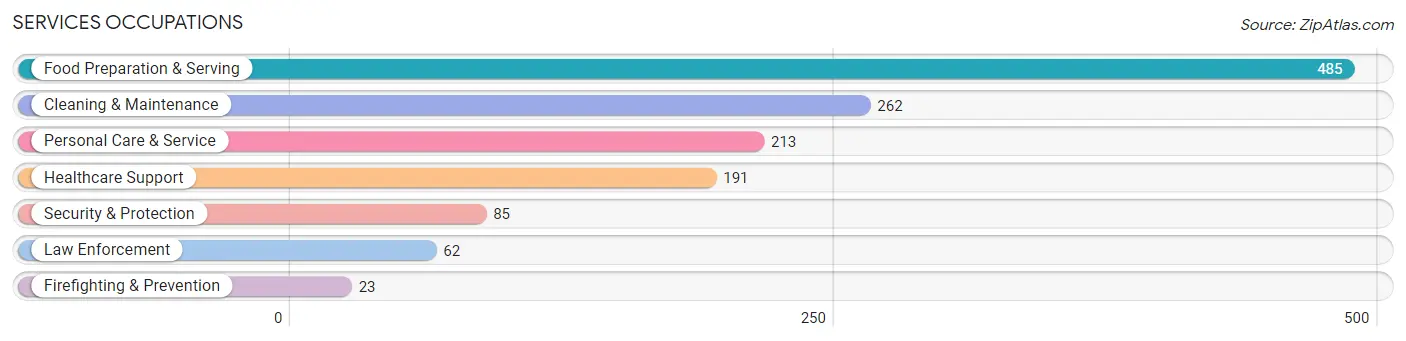
Services Occupations
The most common Services occupations in Hopatcong borough are Food Preparation & Serving (485 | 5.7%), Cleaning & Maintenance (262 | 3.0%), Personal Care & Service (213 | 2.5%), Healthcare Support (191 | 2.2%), and Security & Protection (85 | 1.0%).
Services Occupations by Sex
Within the Services occupations in Hopatcong borough, the most male-oriented occupations are Law Enforcement (90.3%), Cleaning & Maintenance (85.5%), and Security & Protection (74.1%), while the most female-oriented occupations are Healthcare Support (82.7%), Personal Care & Service (77.5%), and Firefighting & Prevention (69.6%).
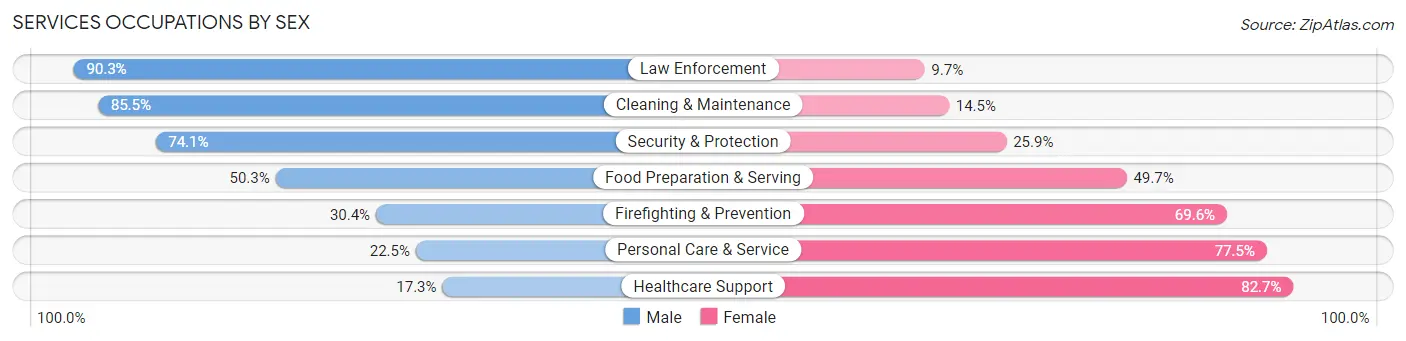
| Occupation | Male | Female |
| Healthcare Support | 33 (17.3%) | 158 (82.7%) |
| Security & Protection | 63 (74.1%) | 22 (25.9%) |
| Firefighting & Prevention | 7 (30.4%) | 16 (69.6%) |
| Law Enforcement | 56 (90.3%) | 6 (9.7%) |
| Food Preparation & Serving | 244 (50.3%) | 241 (49.7%) |
| Cleaning & Maintenance | 224 (85.5%) | 38 (14.5%) |
| Personal Care & Service | 48 (22.5%) | 165 (77.5%) |
| Total (Category) | 612 (49.5%) | 624 (50.5%) |
| Total (Overall) | 4,633 (54.0%) | 3,948 (46.0%) |
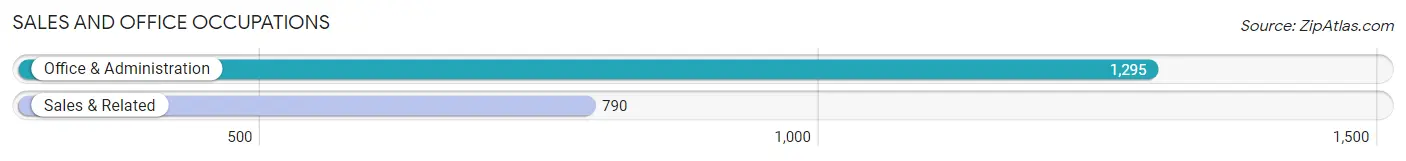
Sales and Office Occupations
The most common Sales and Office occupations in Hopatcong borough are Office & Administration (1,295 | 15.1%), and Sales & Related (790 | 9.2%).
Sales and Office Occupations by Sex
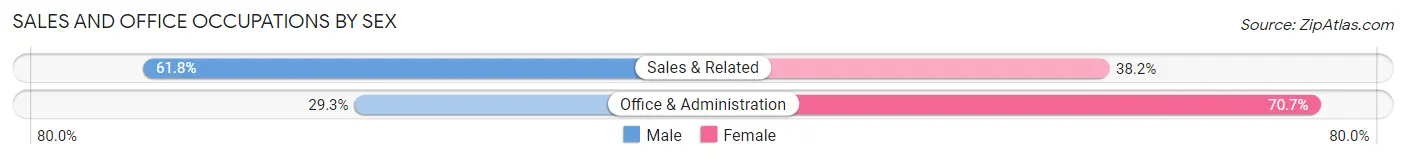
| Occupation | Male | Female |
| Sales & Related | 488 (61.8%) | 302 (38.2%) |
| Office & Administration | 379 (29.3%) | 916 (70.7%) |
| Total (Category) | 867 (41.6%) | 1,218 (58.4%) |
| Total (Overall) | 4,633 (54.0%) | 3,948 (46.0%) |
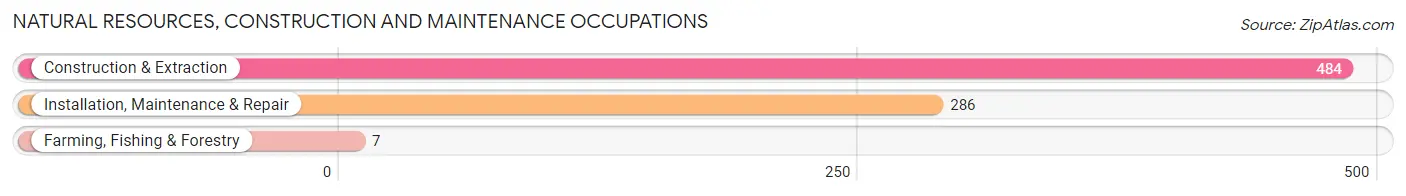
Natural Resources, Construction and Maintenance Occupations
The most common Natural Resources, Construction and Maintenance occupations in Hopatcong borough are Construction & Extraction (484 | 5.6%), Installation, Maintenance & Repair (286 | 3.3%), and Farming, Fishing & Forestry (7 | 0.1%).
Natural Resources, Construction and Maintenance Occupations by Sex
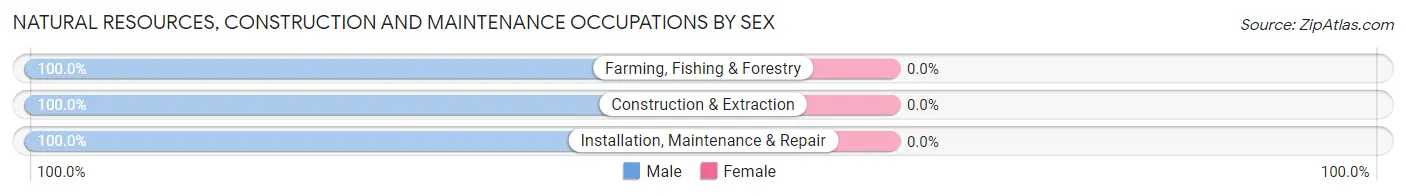
| Occupation | Male | Female |
| Farming, Fishing & Forestry | 7 (100.0%) | 0 (0.0%) |
| Construction & Extraction | 484 (100.0%) | 0 (0.0%) |
| Installation, Maintenance & Repair | 286 (100.0%) | 0 (0.0%) |
| Total (Category) | 777 (100.0%) | 0 (0.0%) |
| Total (Overall) | 4,633 (54.0%) | 3,948 (46.0%) |
Production, Transportation and Moving Occupations
The most common Production, Transportation and Moving occupations in Hopatcong borough are Production (366 | 4.3%), Transportation (333 | 3.9%), and Material Moving (163 | 1.9%).
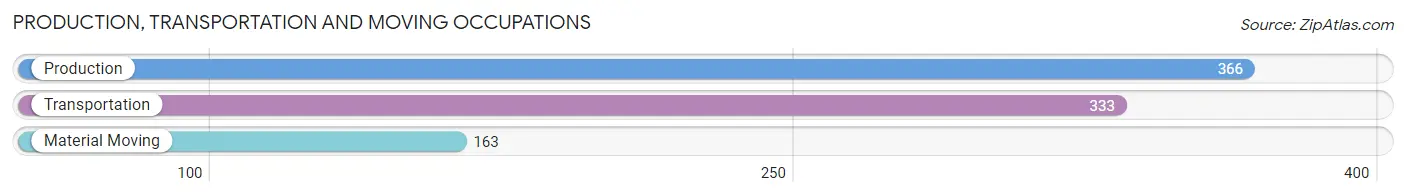
Production, Transportation and Moving Occupations by Sex
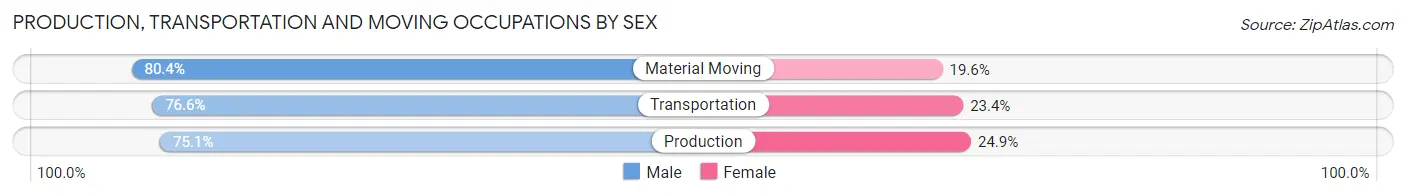
| Occupation | Male | Female |
| Production | 275 (75.1%) | 91 (24.9%) |
| Transportation | 255 (76.6%) | 78 (23.4%) |
| Material Moving | 131 (80.4%) | 32 (19.6%) |
| Total (Category) | 661 (76.7%) | 201 (23.3%) |
| Total (Overall) | 4,633 (54.0%) | 3,948 (46.0%) |
Employment Industries by Sex in Hopatcong borough
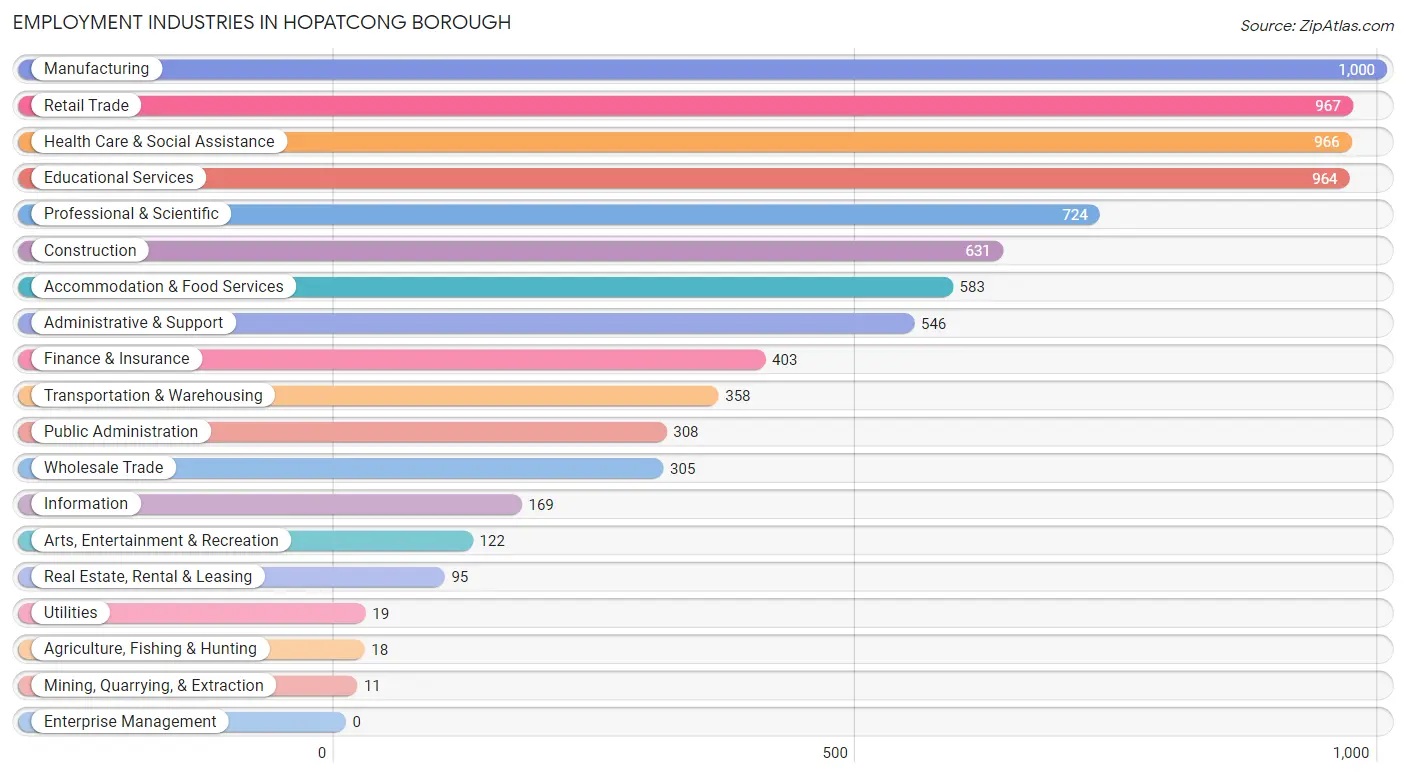
Employment Industries in Hopatcong borough
The major employment industries in Hopatcong borough include Manufacturing (1,000 | 11.7%), Retail Trade (967 | 11.3%), Health Care & Social Assistance (966 | 11.3%), Educational Services (964 | 11.2%), and Professional & Scientific (724 | 8.4%).
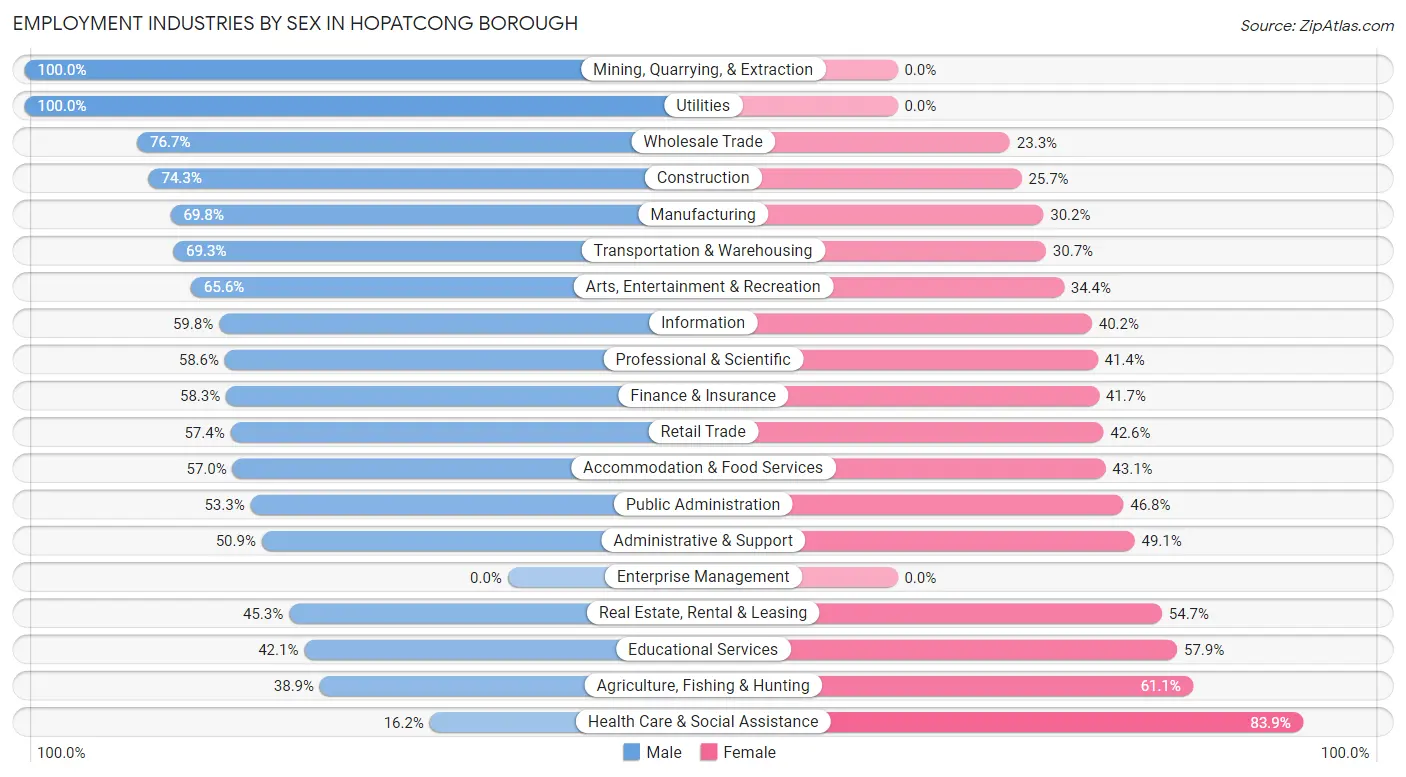
Employment Industries by Sex in Hopatcong borough
The Hopatcong borough industries that see more men than women are Mining, Quarrying, & Extraction (100.0%), Utilities (100.0%), and Wholesale Trade (76.7%), whereas the industries that tend to have a higher number of women are Health Care & Social Assistance (83.9%), Agriculture, Fishing & Hunting (61.1%), and Educational Services (57.9%).
| Industry | Male | Female |
| Agriculture, Fishing & Hunting | 7 (38.9%) | 11 (61.1%) |
| Mining, Quarrying, & Extraction | 11 (100.0%) | 0 (0.0%) |
| Construction | 469 (74.3%) | 162 (25.7%) |
| Manufacturing | 698 (69.8%) | 302 (30.2%) |
| Wholesale Trade | 234 (76.7%) | 71 (23.3%) |
| Retail Trade | 555 (57.4%) | 412 (42.6%) |
| Transportation & Warehousing | 248 (69.3%) | 110 (30.7%) |
| Utilities | 19 (100.0%) | 0 (0.0%) |
| Information | 101 (59.8%) | 68 (40.2%) |
| Finance & Insurance | 235 (58.3%) | 168 (41.7%) |
| Real Estate, Rental & Leasing | 43 (45.3%) | 52 (54.7%) |
| Professional & Scientific | 424 (58.6%) | 300 (41.4%) |
| Enterprise Management | 0 (0.0%) | 0 (0.0%) |
| Administrative & Support | 278 (50.9%) | 268 (49.1%) |
| Educational Services | 406 (42.1%) | 558 (57.9%) |
| Health Care & Social Assistance | 156 (16.2%) | 810 (83.9%) |
| Arts, Entertainment & Recreation | 80 (65.6%) | 42 (34.4%) |
| Accommodation & Food Services | 332 (57.0%) | 251 (43.0%) |
| Public Administration | 164 (53.2%) | 144 (46.8%) |
| Total | 4,633 (54.0%) | 3,948 (46.0%) |
Education in Hopatcong borough
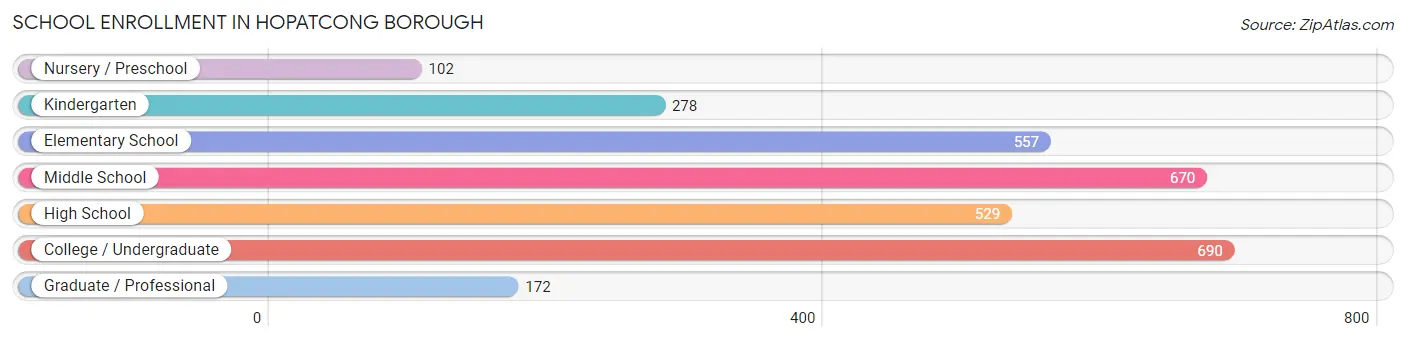
School Enrollment in Hopatcong borough
The most common levels of schooling among the 2,998 students in Hopatcong borough are college / undergraduate (690 | 23.0%), middle school (670 | 22.4%), and elementary school (557 | 18.6%).
| School Level | # Students | % Students |
| Nursery / Preschool | 102 | 3.4% |
| Kindergarten | 278 | 9.3% |
| Elementary School | 557 | 18.6% |
| Middle School | 670 | 22.4% |
| High School | 529 | 17.6% |
| College / Undergraduate | 690 | 23.0% |
| Graduate / Professional | 172 | 5.7% |
| Total | 2,998 | 100.0% |
School Enrollment by Age by Funding Source in Hopatcong borough
Out of a total of 2,998 students who are enrolled in schools in Hopatcong borough, 567 (18.9%) attend a private institution, while the remaining 2,431 (81.1%) are enrolled in public schools. The age group of 25 to 34 year olds has the highest likelihood of being enrolled in private schools, with 113 (42.5% in the age bracket) enrolled. Conversely, the age group of 18 to 19 year olds has the lowest likelihood of being enrolled in a private school, with 151 (94.4% in the age bracket) attending a public institution.
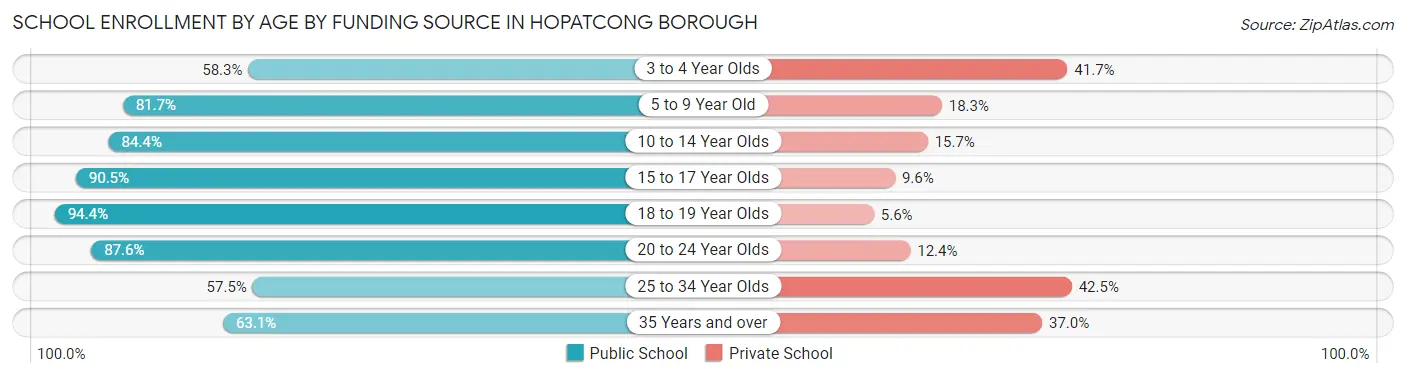
| Age Bracket | Public School | Private School |
| 3 to 4 Year Olds | 28 (58.3%) | 20 (41.7%) |
| 5 to 9 Year Old | 666 (81.7%) | 149 (18.3%) |
| 10 to 14 Year Olds | 690 (84.4%) | 128 (15.7%) |
| 15 to 17 Year Olds | 360 (90.4%) | 38 (9.6%) |
| 18 to 19 Year Olds | 151 (94.4%) | 9 (5.6%) |
| 20 to 24 Year Olds | 254 (87.6%) | 36 (12.4%) |
| 25 to 34 Year Olds | 153 (57.5%) | 113 (42.5%) |
| 35 Years and over | 128 (63.0%) | 75 (36.9%) |
| Total | 2,431 (81.1%) | 567 (18.9%) |
Educational Attainment by Field of Study in Hopatcong borough
Business (1,173 | 29.4%), engineering (371 | 9.3%), social sciences (358 | 9.0%), education (338 | 8.5%), and science & technology (287 | 7.2%) are the most common fields of study among 3,990 individuals in Hopatcong borough who have obtained a bachelor's degree or higher.
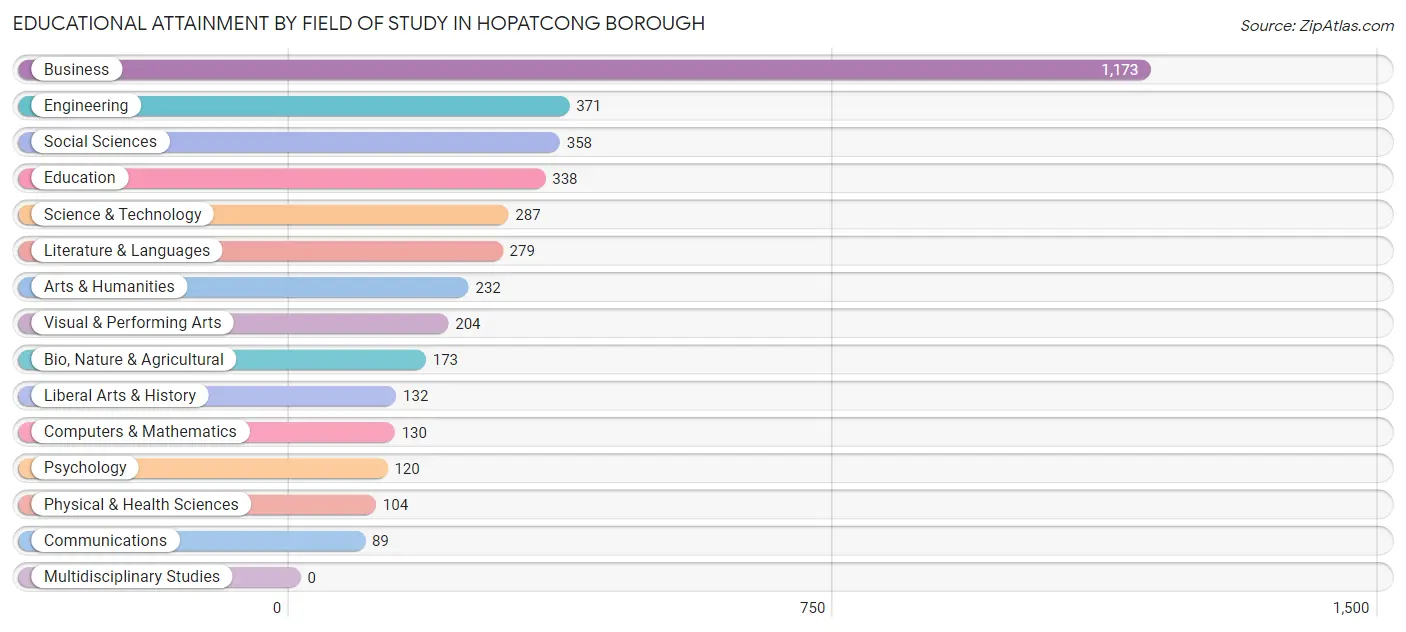
| Field of Study | # Graduates | % Graduates |
| Computers & Mathematics | 130 | 3.3% |
| Bio, Nature & Agricultural | 173 | 4.3% |
| Physical & Health Sciences | 104 | 2.6% |
| Psychology | 120 | 3.0% |
| Social Sciences | 358 | 9.0% |
| Engineering | 371 | 9.3% |
| Multidisciplinary Studies | 0 | 0.0% |
| Science & Technology | 287 | 7.2% |
| Business | 1,173 | 29.4% |
| Education | 338 | 8.5% |
| Literature & Languages | 279 | 7.0% |
| Liberal Arts & History | 132 | 3.3% |
| Visual & Performing Arts | 204 | 5.1% |
| Communications | 89 | 2.2% |
| Arts & Humanities | 232 | 5.8% |
| Total | 3,990 | 100.0% |
Transportation & Commute in Hopatcong borough
Vehicle Availability by Sex in Hopatcong borough
The most prevalent vehicle ownership categories in Hopatcong borough are males with 2 vehicles (1,796, accounting for 39.8%) and females with 2 vehicles (1,448, making up 46.8%).
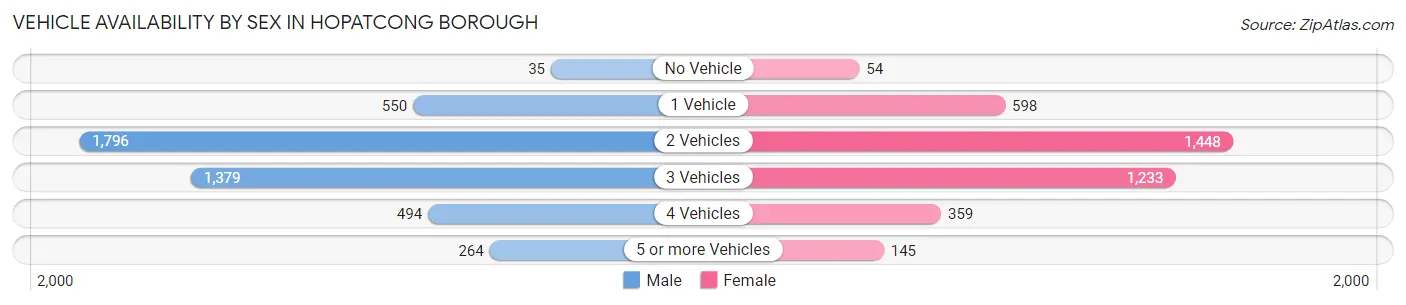
| Vehicles Available | Male | Female |
| No Vehicle | 35 (0.8%) | 54 (1.4%) |
| 1 Vehicle | 550 (12.2%) | 598 (15.6%) |
| 2 Vehicles | 1,796 (39.8%) | 1,448 (37.7%) |
| 3 Vehicles | 1,379 (30.5%) | 1,233 (32.1%) |
| 4 Vehicles | 494 (10.9%) | 359 (9.4%) |
| 5 or more Vehicles | 264 (5.8%) | 145 (3.8%) |
| Total | 4,518 (100.0%) | 3,837 (100.0%) |
Commute Time in Hopatcong borough
The most frequently occuring commute durations in Hopatcong borough are 60 to 89 minutes (1,164 commuters, 16.1%), 45 to 59 minutes (1,044 commuters, 14.4%), and 30 to 34 minutes (903 commuters, 12.4%).
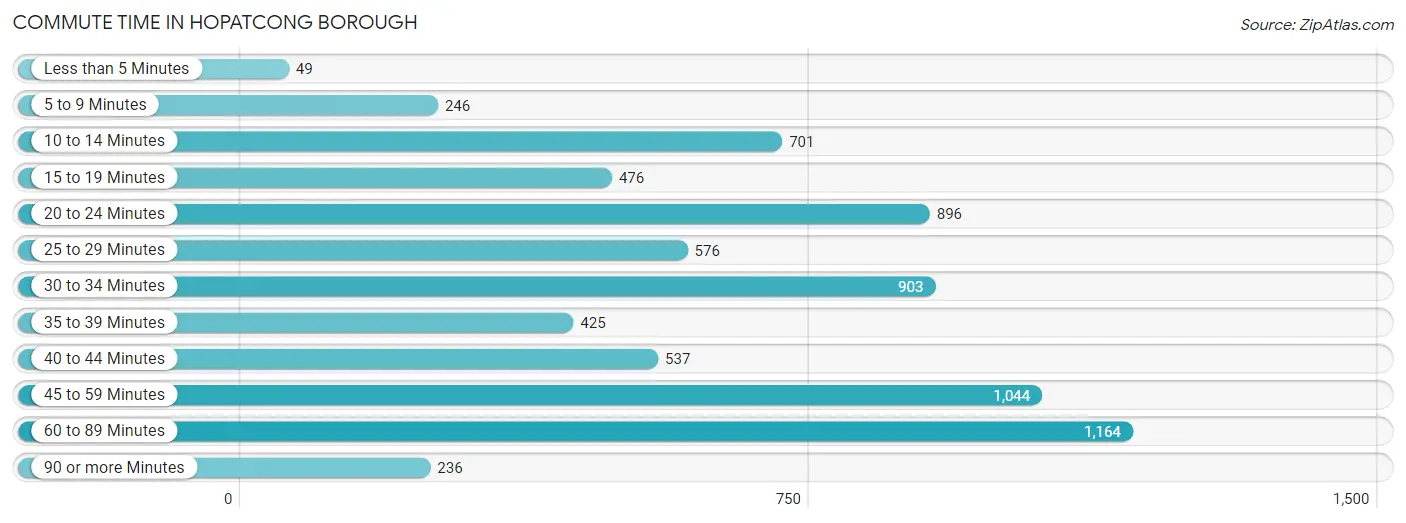
| Commute Time | # Commuters | % Commuters |
| Less than 5 Minutes | 49 | 0.7% |
| 5 to 9 Minutes | 246 | 3.4% |
| 10 to 14 Minutes | 701 | 9.7% |
| 15 to 19 Minutes | 476 | 6.6% |
| 20 to 24 Minutes | 896 | 12.3% |
| 25 to 29 Minutes | 576 | 7.9% |
| 30 to 34 Minutes | 903 | 12.4% |
| 35 to 39 Minutes | 425 | 5.9% |
| 40 to 44 Minutes | 537 | 7.4% |
| 45 to 59 Minutes | 1,044 | 14.4% |
| 60 to 89 Minutes | 1,164 | 16.1% |
| 90 or more Minutes | 236 | 3.3% |
Commute Time by Sex in Hopatcong borough
The most common commute times in Hopatcong borough are 60 to 89 minutes (588 commuters, 15.2%) for males and 60 to 89 minutes (576 commuters, 17.0%) for females.
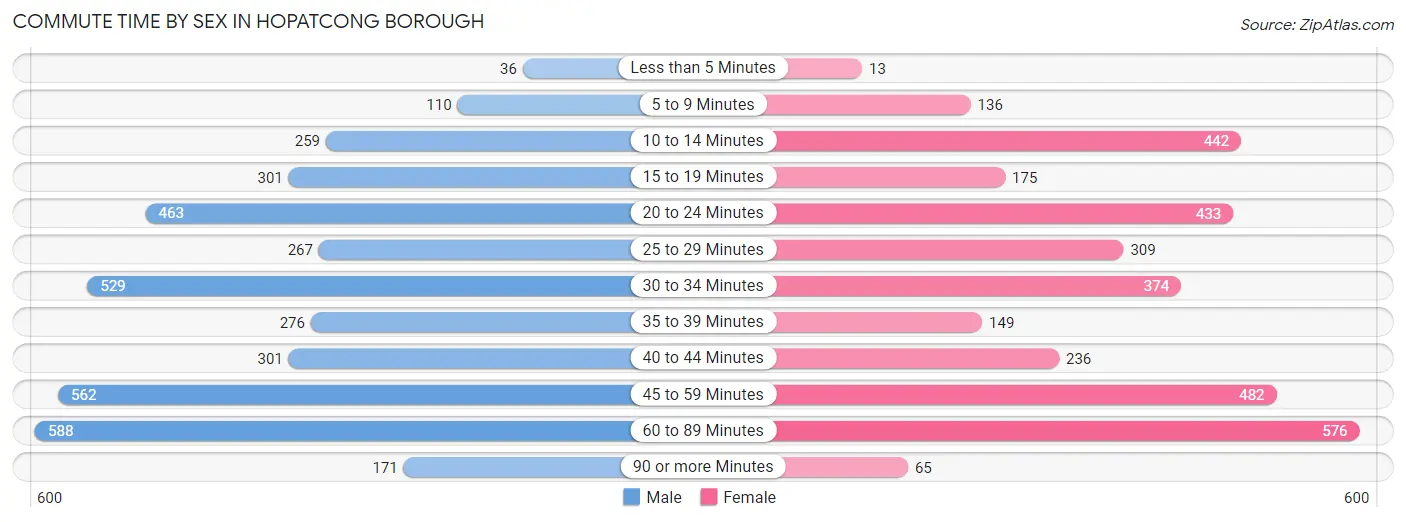
| Commute Time | Male | Female |
| Less than 5 Minutes | 36 (0.9%) | 13 (0.4%) |
| 5 to 9 Minutes | 110 (2.9%) | 136 (4.0%) |
| 10 to 14 Minutes | 259 (6.7%) | 442 (13.0%) |
| 15 to 19 Minutes | 301 (7.8%) | 175 (5.2%) |
| 20 to 24 Minutes | 463 (12.0%) | 433 (12.8%) |
| 25 to 29 Minutes | 267 (6.9%) | 309 (9.1%) |
| 30 to 34 Minutes | 529 (13.7%) | 374 (11.0%) |
| 35 to 39 Minutes | 276 (7.1%) | 149 (4.4%) |
| 40 to 44 Minutes | 301 (7.8%) | 236 (7.0%) |
| 45 to 59 Minutes | 562 (14.5%) | 482 (14.2%) |
| 60 to 89 Minutes | 588 (15.2%) | 576 (17.0%) |
| 90 or more Minutes | 171 (4.4%) | 65 (1.9%) |
Time of Departure to Work by Sex in Hopatcong borough
The most frequent times of departure to work in Hopatcong borough are 6:30 AM to 6:59 AM (540, 14.0%) for males and 7:30 AM to 7:59 AM (716, 21.1%) for females.
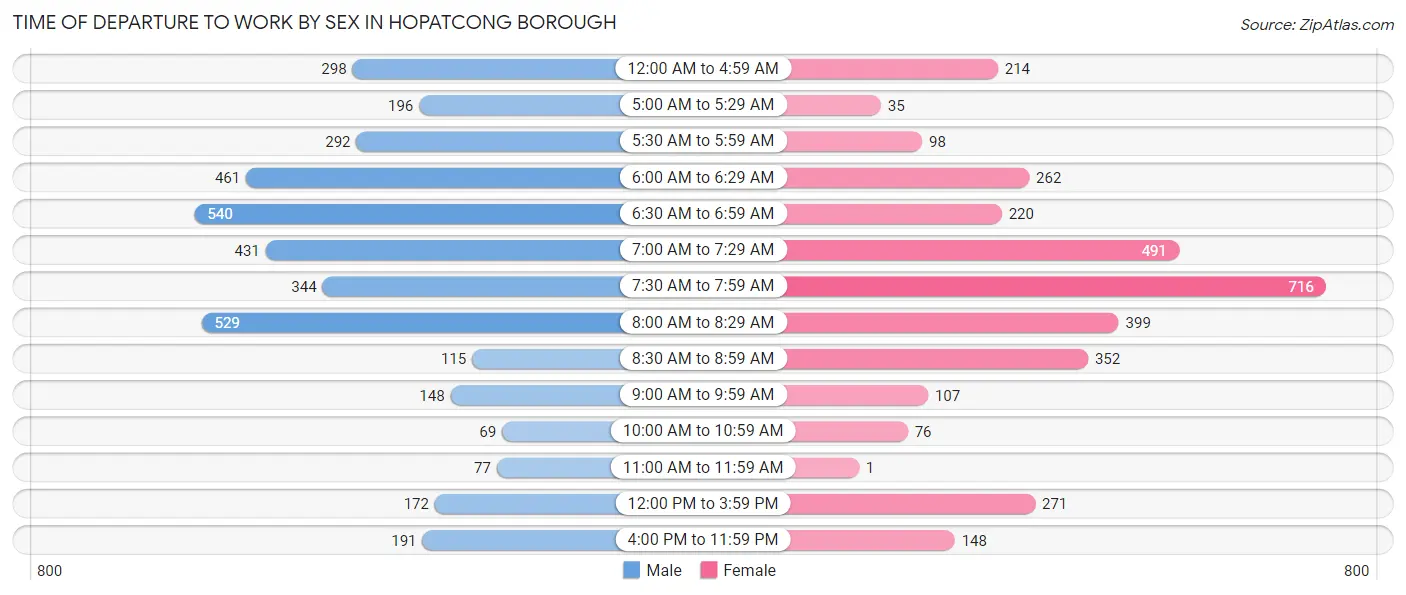
| Time of Departure | Male | Female |
| 12:00 AM to 4:59 AM | 298 (7.7%) | 214 (6.3%) |
| 5:00 AM to 5:29 AM | 196 (5.1%) | 35 (1.0%) |
| 5:30 AM to 5:59 AM | 292 (7.6%) | 98 (2.9%) |
| 6:00 AM to 6:29 AM | 461 (11.9%) | 262 (7.7%) |
| 6:30 AM to 6:59 AM | 540 (14.0%) | 220 (6.5%) |
| 7:00 AM to 7:29 AM | 431 (11.2%) | 491 (14.5%) |
| 7:30 AM to 7:59 AM | 344 (8.9%) | 716 (21.1%) |
| 8:00 AM to 8:29 AM | 529 (13.7%) | 399 (11.8%) |
| 8:30 AM to 8:59 AM | 115 (3.0%) | 352 (10.4%) |
| 9:00 AM to 9:59 AM | 148 (3.8%) | 107 (3.2%) |
| 10:00 AM to 10:59 AM | 69 (1.8%) | 76 (2.2%) |
| 11:00 AM to 11:59 AM | 77 (2.0%) | 1 (0.0%) |
| 12:00 PM to 3:59 PM | 172 (4.4%) | 271 (8.0%) |
| 4:00 PM to 11:59 PM | 191 (4.9%) | 148 (4.4%) |
| Total | 3,863 (100.0%) | 3,390 (100.0%) |
Housing Occupancy in Hopatcong borough
Occupancy by Ownership in Hopatcong borough
Of the total 5,756 dwellings in Hopatcong borough, owner-occupied units account for 5,043 (87.6%), while renter-occupied units make up 713 (12.4%).
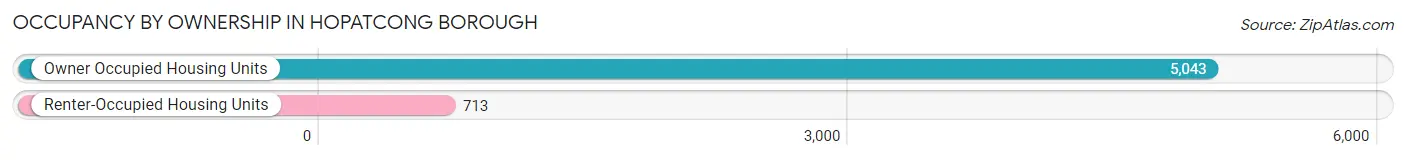
| Occupancy | # Housing Units | % Housing Units |
| Owner Occupied Housing Units | 5,043 | 87.6% |
| Renter-Occupied Housing Units | 713 | 12.4% |
| Total Occupied Housing Units | 5,756 | 100.0% |
Occupancy by Household Size in Hopatcong borough
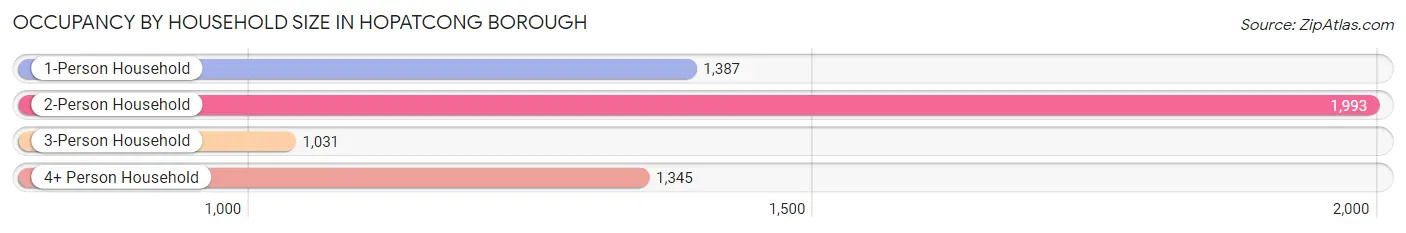
| Household Size | # Housing Units | % Housing Units |
| 1-Person Household | 1,387 | 24.1% |
| 2-Person Household | 1,993 | 34.6% |
| 3-Person Household | 1,031 | 17.9% |
| 4+ Person Household | 1,345 | 23.4% |
| Total Housing Units | 5,756 | 100.0% |
Occupancy by Ownership by Household Size in Hopatcong borough
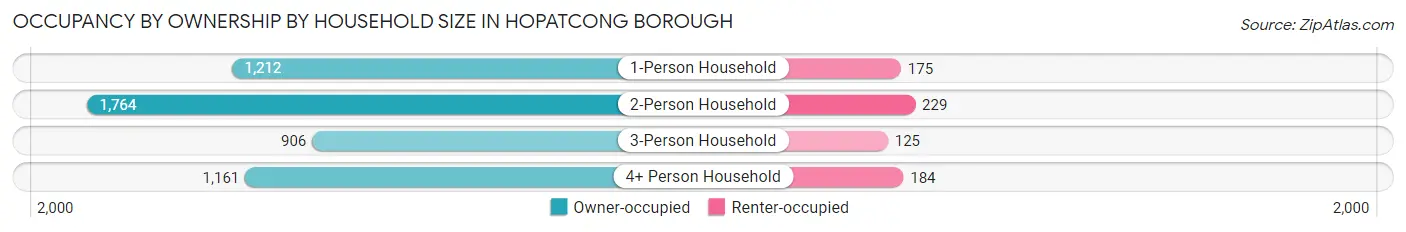
| Household Size | Owner-occupied | Renter-occupied |
| 1-Person Household | 1,212 (87.4%) | 175 (12.6%) |
| 2-Person Household | 1,764 (88.5%) | 229 (11.5%) |
| 3-Person Household | 906 (87.9%) | 125 (12.1%) |
| 4+ Person Household | 1,161 (86.3%) | 184 (13.7%) |
| Total Housing Units | 5,043 (87.6%) | 713 (12.4%) |
Occupancy by Educational Attainment in Hopatcong borough
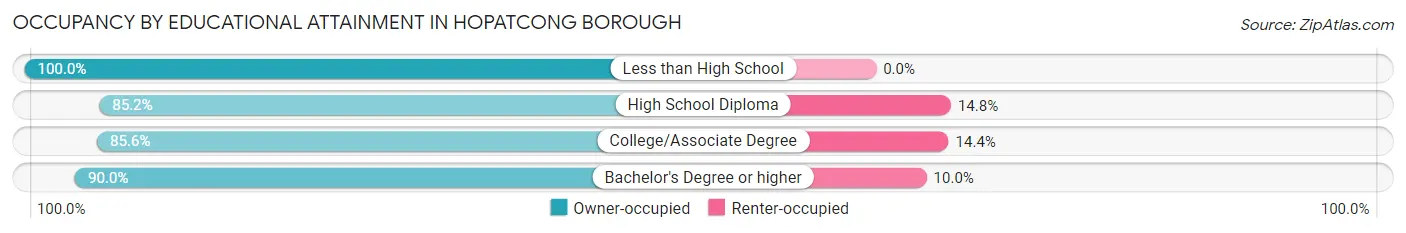
| Household Size | Owner-occupied | Renter-occupied |
| Less than High School | 168 (100.0%) | 0 (0.0%) |
| High School Diploma | 1,470 (85.2%) | 256 (14.8%) |
| College/Associate Degree | 1,382 (85.6%) | 232 (14.4%) |
| Bachelor's Degree or higher | 2,023 (90.0%) | 225 (10.0%) |
Occupancy by Age of Householder in Hopatcong borough
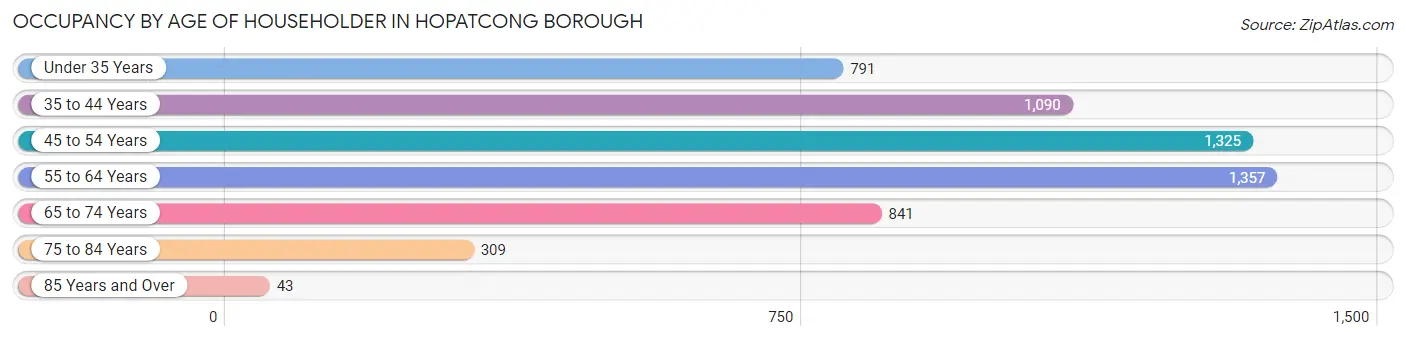
| Age Bracket | # Households | % Households |
| Under 35 Years | 791 | 13.7% |
| 35 to 44 Years | 1,090 | 18.9% |
| 45 to 54 Years | 1,325 | 23.0% |
| 55 to 64 Years | 1,357 | 23.6% |
| 65 to 74 Years | 841 | 14.6% |
| 75 to 84 Years | 309 | 5.4% |
| 85 Years and Over | 43 | 0.7% |
| Total | 5,756 | 100.0% |
Housing Finances in Hopatcong borough
Median Income by Occupancy in Hopatcong borough
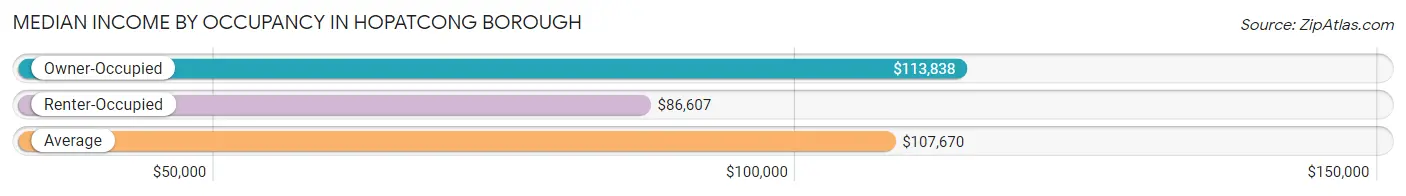
| Occupancy Type | # Households | Median Income |
| Owner-Occupied | 5,043 (87.6%) | $113,838 |
| Renter-Occupied | 713 (12.4%) | $86,607 |
| Average | 5,756 (100.0%) | $107,670 |
Occupancy by Householder Income Bracket in Hopatcong borough
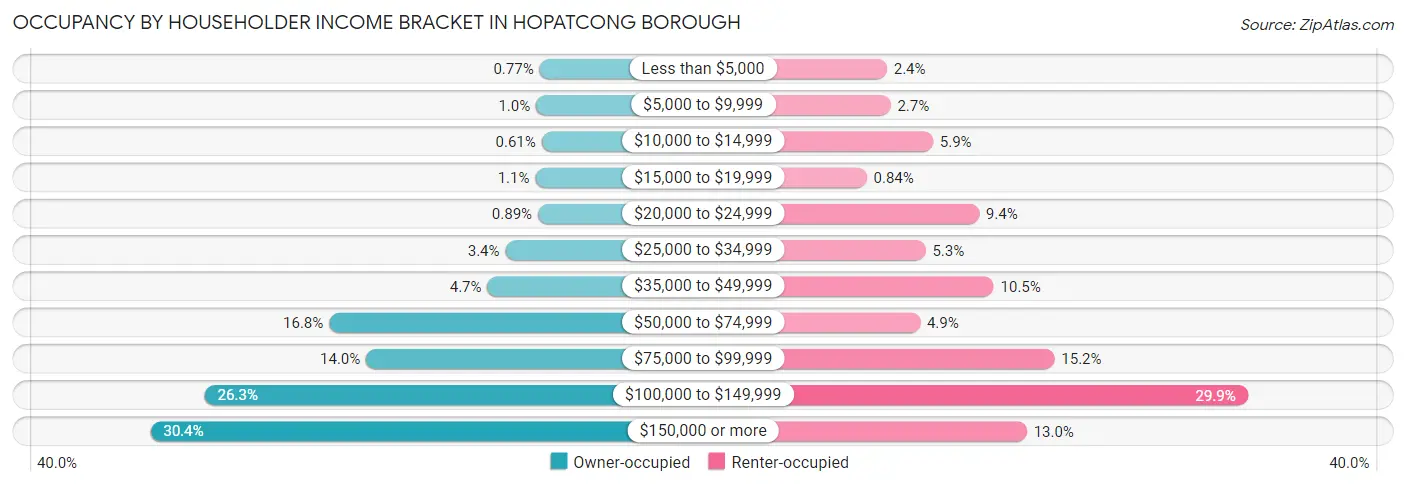
| Income Bracket | Owner-occupied | Renter-occupied |
| Less than $5,000 | 39 (0.8%) | 17 (2.4%) |
| $5,000 to $9,999 | 52 (1.0%) | 19 (2.7%) |
| $10,000 to $14,999 | 31 (0.6%) | 42 (5.9%) |
| $15,000 to $19,999 | 55 (1.1%) | 6 (0.8%) |
| $20,000 to $24,999 | 45 (0.9%) | 67 (9.4%) |
| $25,000 to $34,999 | 170 (3.4%) | 38 (5.3%) |
| $35,000 to $49,999 | 239 (4.7%) | 75 (10.5%) |
| $50,000 to $74,999 | 847 (16.8%) | 35 (4.9%) |
| $75,000 to $99,999 | 705 (14.0%) | 108 (15.1%) |
| $100,000 to $149,999 | 1,326 (26.3%) | 213 (29.9%) |
| $150,000 or more | 1,534 (30.4%) | 93 (13.0%) |
| Total | 5,043 (100.0%) | 713 (100.0%) |
Monthly Housing Cost Tiers in Hopatcong borough
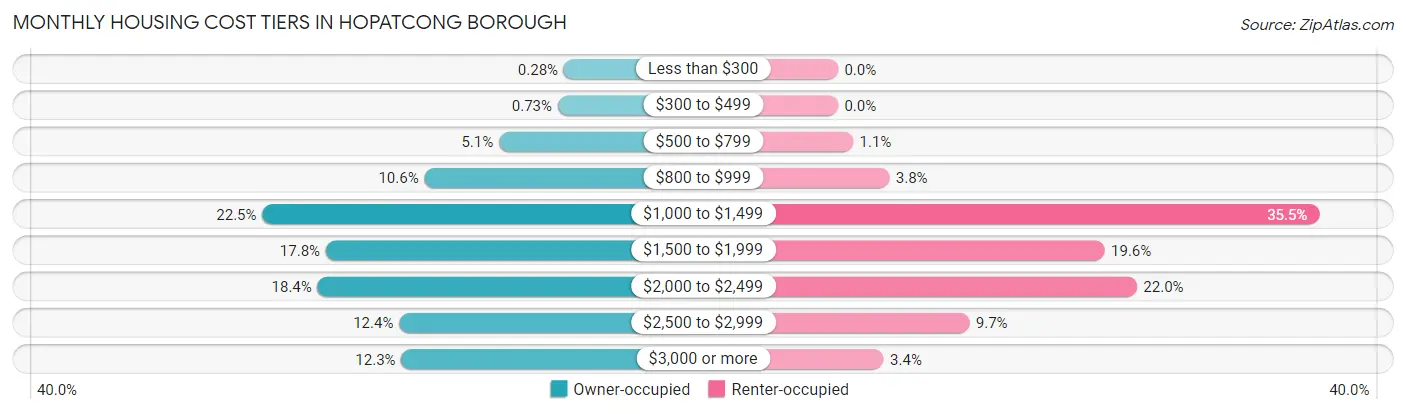
| Monthly Cost | Owner-occupied | Renter-occupied |
| Less than $300 | 14 (0.3%) | 0 (0.0%) |
| $300 to $499 | 37 (0.7%) | 0 (0.0%) |
| $500 to $799 | 255 (5.1%) | 8 (1.1%) |
| $800 to $999 | 532 (10.5%) | 27 (3.8%) |
| $1,000 to $1,499 | 1,134 (22.5%) | 253 (35.5%) |
| $1,500 to $1,999 | 898 (17.8%) | 140 (19.6%) |
| $2,000 to $2,499 | 929 (18.4%) | 157 (22.0%) |
| $2,500 to $2,999 | 626 (12.4%) | 69 (9.7%) |
| $3,000 or more | 618 (12.2%) | 24 (3.4%) |
| Total | 5,043 (100.0%) | 713 (100.0%) |
Physical Housing Characteristics in Hopatcong borough
Housing Structures in Hopatcong borough
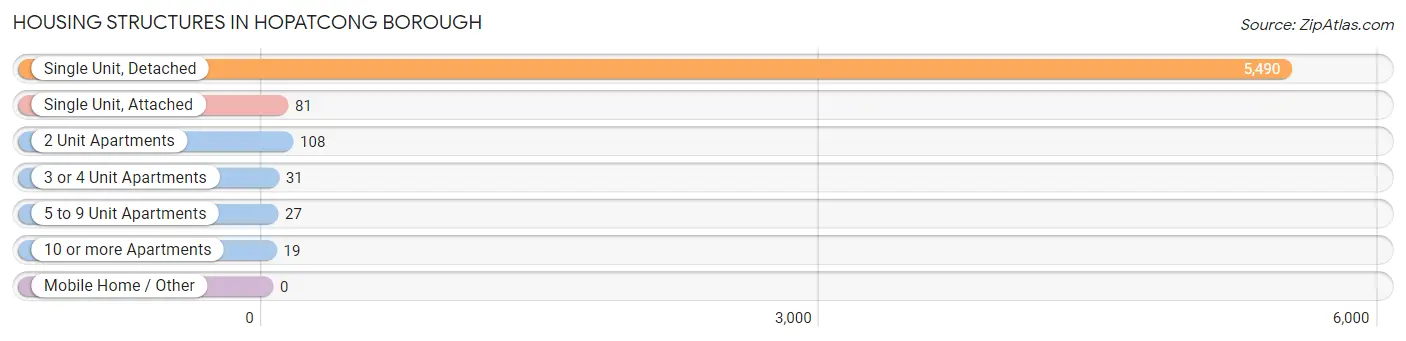
| Structure Type | # Housing Units | % Housing Units |
| Single Unit, Detached | 5,490 | 95.4% |
| Single Unit, Attached | 81 | 1.4% |
| 2 Unit Apartments | 108 | 1.9% |
| 3 or 4 Unit Apartments | 31 | 0.5% |
| 5 to 9 Unit Apartments | 27 | 0.5% |
| 10 or more Apartments | 19 | 0.3% |
| Mobile Home / Other | 0 | 0.0% |
| Total | 5,756 | 100.0% |
Housing Structures by Occupancy in Hopatcong borough
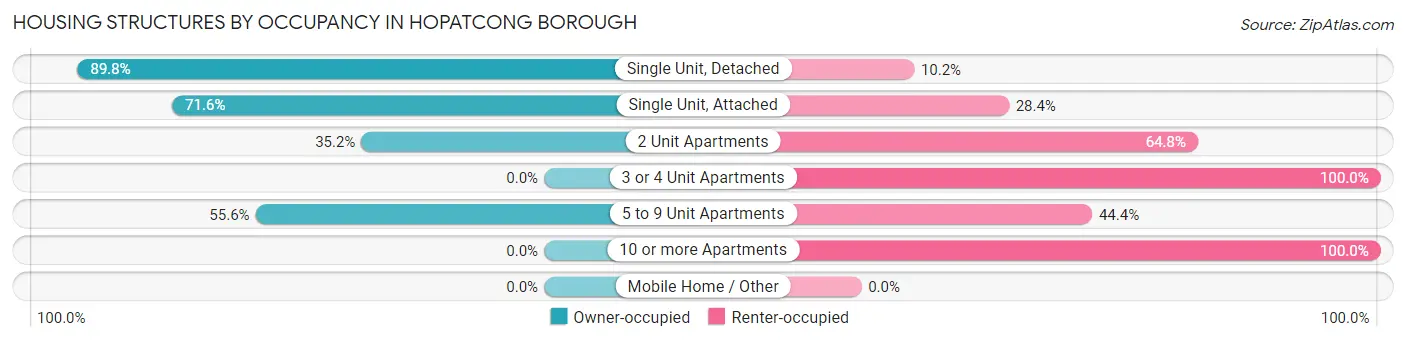
| Structure Type | Owner-occupied | Renter-occupied |
| Single Unit, Detached | 4,932 (89.8%) | 558 (10.2%) |
| Single Unit, Attached | 58 (71.6%) | 23 (28.4%) |
| 2 Unit Apartments | 38 (35.2%) | 70 (64.8%) |
| 3 or 4 Unit Apartments | 0 (0.0%) | 31 (100.0%) |
| 5 to 9 Unit Apartments | 15 (55.6%) | 12 (44.4%) |
| 10 or more Apartments | 0 (0.0%) | 19 (100.0%) |
| Mobile Home / Other | 0 (0.0%) | 0 (0.0%) |
| Total | 5,043 (87.6%) | 713 (12.4%) |
Housing Structures by Number of Rooms in Hopatcong borough
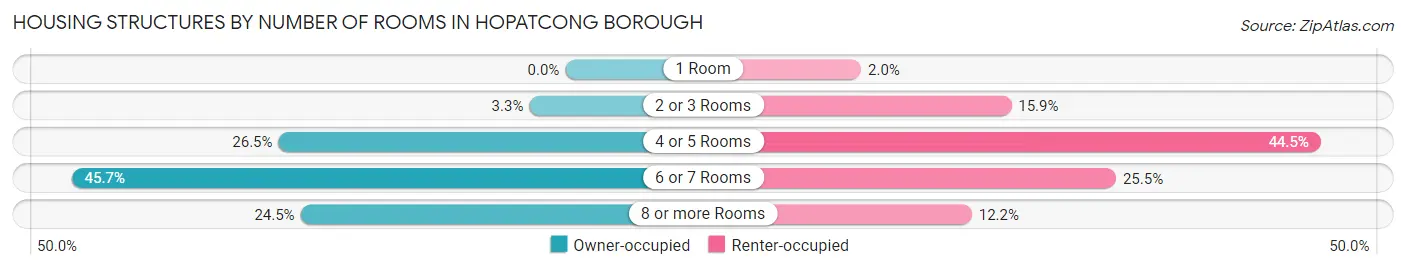
| Number of Rooms | Owner-occupied | Renter-occupied |
| 1 Room | 0 (0.0%) | 14 (2.0%) |
| 2 or 3 Rooms | 168 (3.3%) | 113 (15.9%) |
| 4 or 5 Rooms | 1,338 (26.5%) | 317 (44.5%) |
| 6 or 7 Rooms | 2,302 (45.7%) | 182 (25.5%) |
| 8 or more Rooms | 1,235 (24.5%) | 87 (12.2%) |
| Total | 5,043 (100.0%) | 713 (100.0%) |
Housing Structure by Heating Type in Hopatcong borough
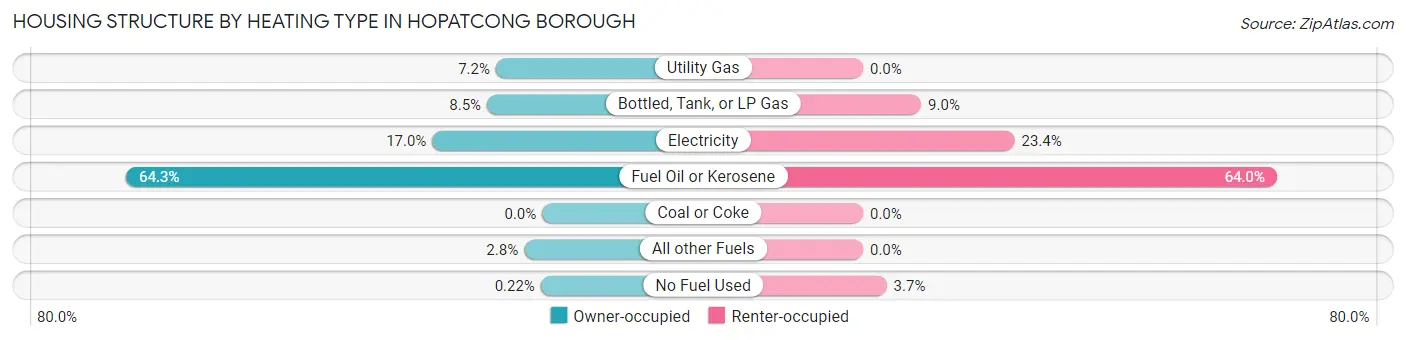
| Heating Type | Owner-occupied | Renter-occupied |
| Utility Gas | 361 (7.2%) | 0 (0.0%) |
| Bottled, Tank, or LP Gas | 430 (8.5%) | 64 (9.0%) |
| Electricity | 857 (17.0%) | 167 (23.4%) |
| Fuel Oil or Kerosene | 3,243 (64.3%) | 456 (64.0%) |
| Coal or Coke | 0 (0.0%) | 0 (0.0%) |
| All other Fuels | 141 (2.8%) | 0 (0.0%) |
| No Fuel Used | 11 (0.2%) | 26 (3.6%) |
| Total | 5,043 (100.0%) | 713 (100.0%) |
Household Vehicle Usage in Hopatcong borough
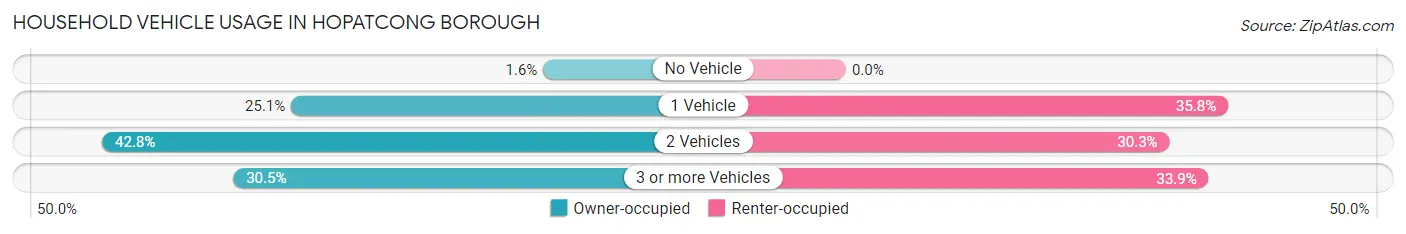
| Vehicles per Household | Owner-occupied | Renter-occupied |
| No Vehicle | 80 (1.6%) | 0 (0.0%) |
| 1 Vehicle | 1,267 (25.1%) | 255 (35.8%) |
| 2 Vehicles | 2,157 (42.8%) | 216 (30.3%) |
| 3 or more Vehicles | 1,539 (30.5%) | 242 (33.9%) |
| Total | 5,043 (100.0%) | 713 (100.0%) |
Real Estate & Mortgages in Hopatcong borough
Real Estate and Mortgage Overview in Hopatcong borough
| Characteristic | Without Mortgage | With Mortgage |
| Housing Units | 1,699 | 3,344 |
| Median Property Value | $292,300 | $281,000 |
| Median Household Income | $113,068 | $1,066 |
| Monthly Housing Costs | $1,055 | $618 |
| Real Estate Taxes | $8,010 | $18 |
Property Value by Mortgage Status in Hopatcong borough
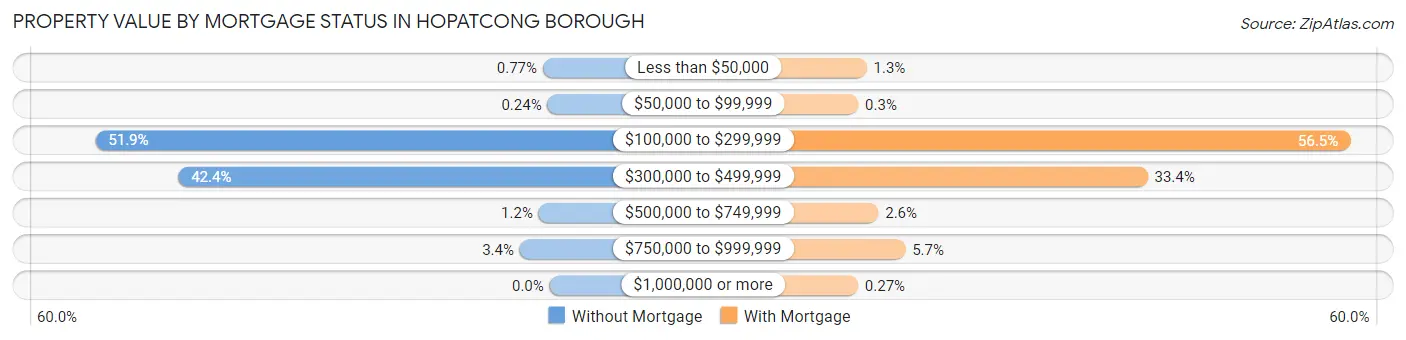
| Property Value | Without Mortgage | With Mortgage |
| Less than $50,000 | 13 (0.8%) | 42 (1.3%) |
| $50,000 to $99,999 | 4 (0.2%) | 10 (0.3%) |
| $100,000 to $299,999 | 882 (51.9%) | 1,890 (56.5%) |
| $300,000 to $499,999 | 721 (42.4%) | 1,116 (33.4%) |
| $500,000 to $749,999 | 21 (1.2%) | 87 (2.6%) |
| $750,000 to $999,999 | 58 (3.4%) | 190 (5.7%) |
| $1,000,000 or more | 0 (0.0%) | 9 (0.3%) |
| Total | 1,699 (100.0%) | 3,344 (100.0%) |
Household Income by Mortgage Status in Hopatcong borough
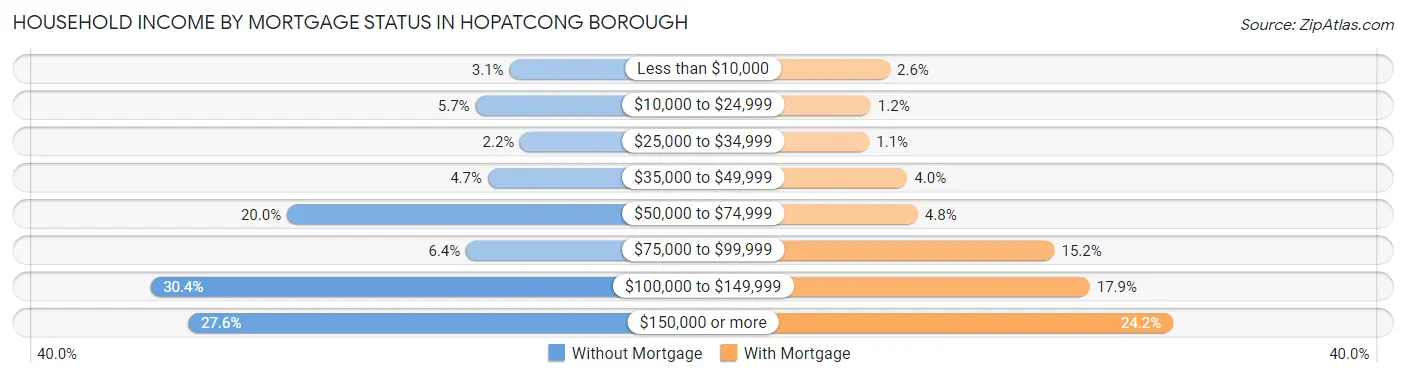
| Household Income | Without Mortgage | With Mortgage |
| Less than $10,000 | 52 (3.1%) | 88 (2.6%) |
| $10,000 to $24,999 | 96 (5.7%) | 39 (1.2%) |
| $25,000 to $34,999 | 38 (2.2%) | 35 (1.1%) |
| $35,000 to $49,999 | 80 (4.7%) | 132 (4.0%) |
| $50,000 to $74,999 | 340 (20.0%) | 159 (4.8%) |
| $75,000 to $99,999 | 108 (6.4%) | 507 (15.2%) |
| $100,000 to $149,999 | 517 (30.4%) | 597 (17.8%) |
| $150,000 or more | 468 (27.6%) | 809 (24.2%) |
| Total | 1,699 (100.0%) | 3,344 (100.0%) |
Property Value to Household Income Ratio in Hopatcong borough
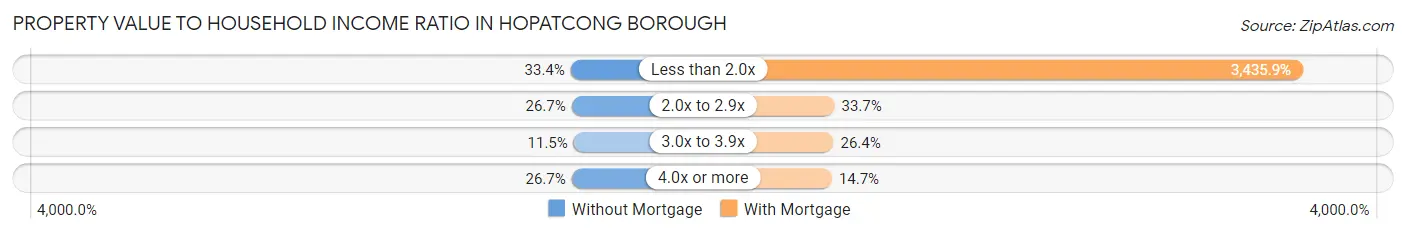
| Value-to-Income Ratio | Without Mortgage | With Mortgage |
| Less than 2.0x | 567 (33.4%) | 114,896 (3,435.9%) |
| 2.0x to 2.9x | 454 (26.7%) | 1,126 (33.7%) |
| 3.0x to 3.9x | 196 (11.5%) | 883 (26.4%) |
| 4.0x or more | 453 (26.7%) | 491 (14.7%) |
| Total | 1,699 (100.0%) | 3,344 (100.0%) |
Real Estate Taxes by Mortgage Status in Hopatcong borough
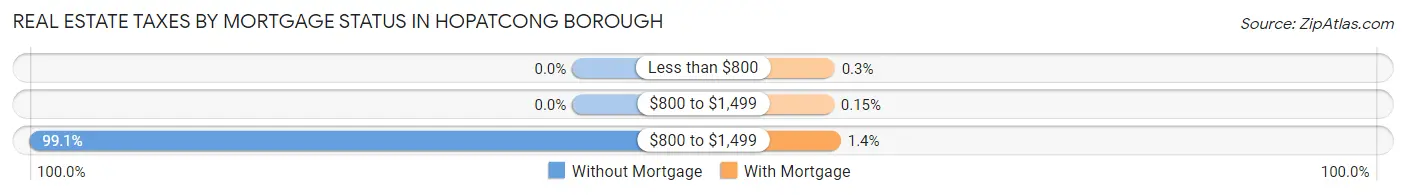
| Property Taxes | Without Mortgage | With Mortgage |
| Less than $800 | 0 (0.0%) | 10 (0.3%) |
| $800 to $1,499 | 0 (0.0%) | 5 (0.2%) |
| $800 to $1,499 | 1,684 (99.1%) | 47 (1.4%) |
| Total | 1,699 (100.0%) | 3,344 (100.0%) |
Health & Disability in Hopatcong borough
Health Insurance Coverage by Age in Hopatcong borough
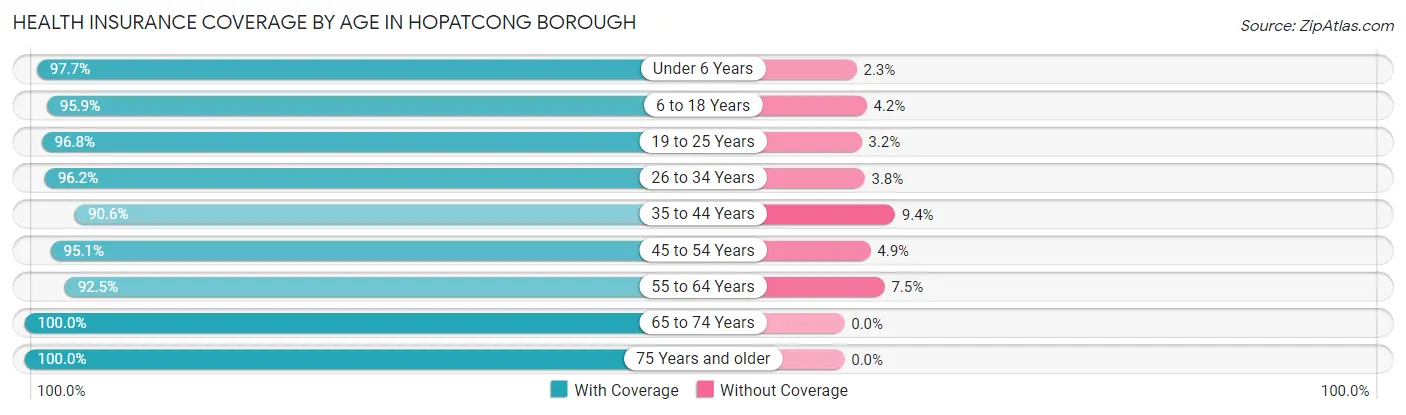
| Age Bracket | With Coverage | Without Coverage |
| Under 6 Years | 859 (97.7%) | 20 (2.3%) |
| 6 to 18 Years | 1,802 (95.9%) | 78 (4.2%) |
| 19 to 25 Years | 1,031 (96.8%) | 34 (3.2%) |
| 26 to 34 Years | 1,962 (96.2%) | 77 (3.8%) |
| 35 to 44 Years | 1,807 (90.6%) | 188 (9.4%) |
| 45 to 54 Years | 2,210 (95.1%) | 113 (4.9%) |
| 55 to 64 Years | 2,138 (92.5%) | 173 (7.5%) |
| 65 to 74 Years | 1,306 (100.0%) | 0 (0.0%) |
| 75 Years and older | 613 (100.0%) | 0 (0.0%) |
| Total | 13,728 (95.3%) | 683 (4.7%) |
Health Insurance Coverage by Citizenship Status in Hopatcong borough
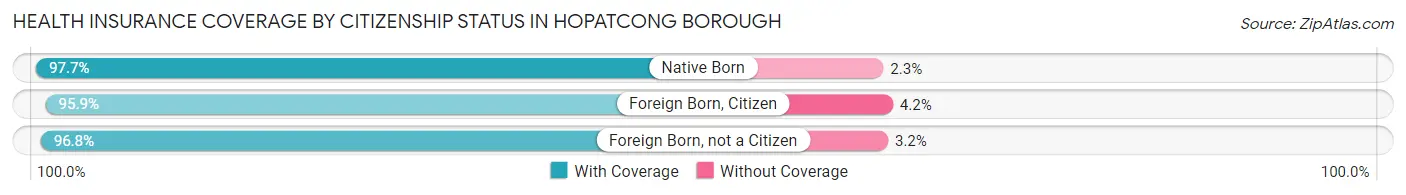
| Citizenship Status | With Coverage | Without Coverage |
| Native Born | 859 (97.7%) | 20 (2.3%) |
| Foreign Born, Citizen | 1,802 (95.9%) | 78 (4.2%) |
| Foreign Born, not a Citizen | 1,031 (96.8%) | 34 (3.2%) |
Health Insurance Coverage by Household Income in Hopatcong borough
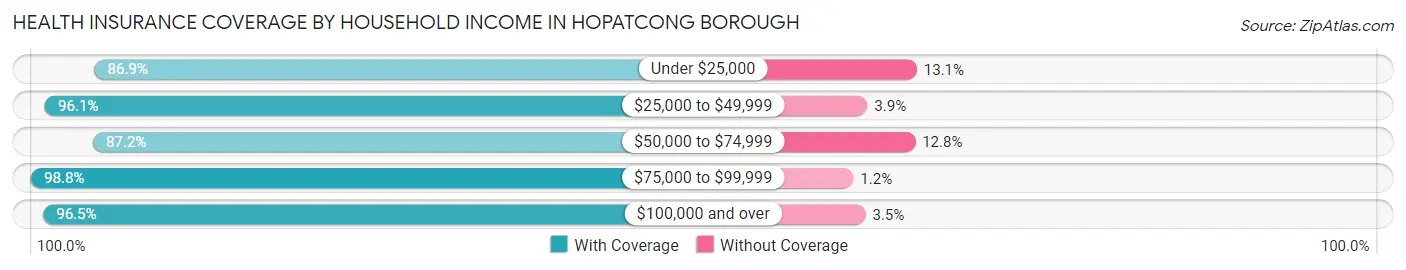
| Household Income | With Coverage | Without Coverage |
| Under $25,000 | 503 (86.9%) | 76 (13.1%) |
| $25,000 to $49,999 | 1,045 (96.1%) | 42 (3.9%) |
| $50,000 to $74,999 | 1,449 (87.2%) | 213 (12.8%) |
| $75,000 to $99,999 | 1,832 (98.8%) | 23 (1.2%) |
| $100,000 and over | 8,864 (96.5%) | 322 (3.5%) |
Public vs Private Health Insurance Coverage by Age in Hopatcong borough
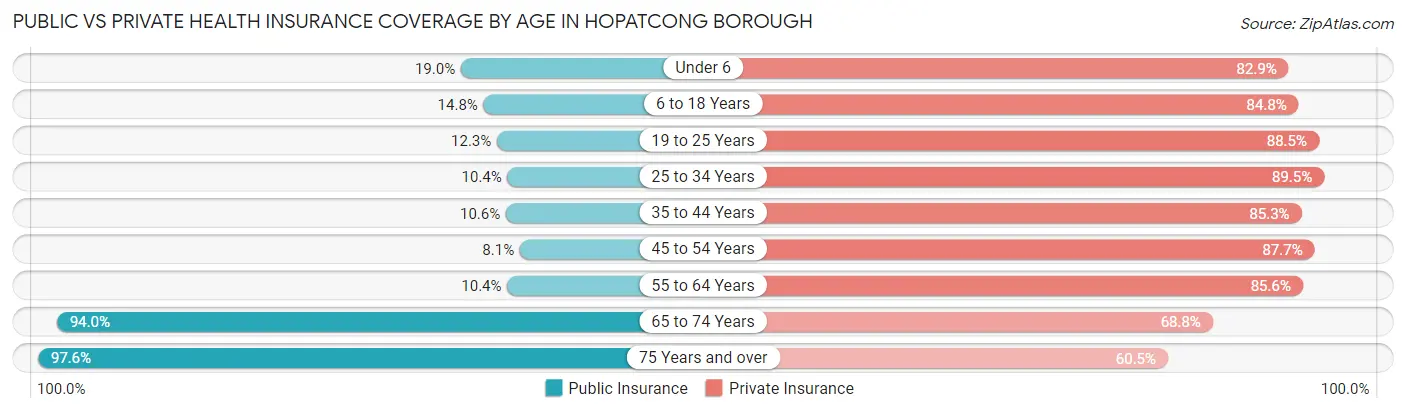
| Age Bracket | Public Insurance | Private Insurance |
| Under 6 | 167 (19.0%) | 729 (82.9%) |
| 6 to 18 Years | 278 (14.8%) | 1,594 (84.8%) |
| 19 to 25 Years | 131 (12.3%) | 943 (88.5%) |
| 25 to 34 Years | 211 (10.3%) | 1,825 (89.5%) |
| 35 to 44 Years | 212 (10.6%) | 1,702 (85.3%) |
| 45 to 54 Years | 187 (8.1%) | 2,038 (87.7%) |
| 55 to 64 Years | 240 (10.4%) | 1,977 (85.6%) |
| 65 to 74 Years | 1,228 (94.0%) | 899 (68.8%) |
| 75 Years and over | 598 (97.6%) | 371 (60.5%) |
| Total | 3,252 (22.6%) | 12,078 (83.8%) |
Disability Status by Sex by Age in Hopatcong borough
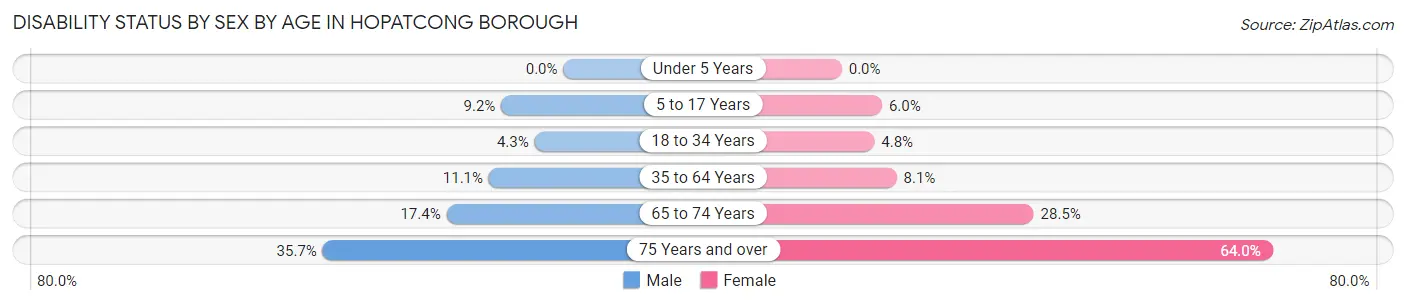
| Age Bracket | Male | Female |
| Under 5 Years | 0 (0.0%) | 0 (0.0%) |
| 5 to 17 Years | 95 (9.2%) | 63 (6.0%) |
| 18 to 34 Years | 70 (4.3%) | 75 (4.8%) |
| 35 to 64 Years | 376 (11.1%) | 263 (8.1%) |
| 65 to 74 Years | 106 (17.3%) | 198 (28.5%) |
| 75 Years and over | 109 (35.7%) | 197 (64.0%) |
Disability Class by Sex by Age in Hopatcong borough
Disability Class: Hearing Difficulty
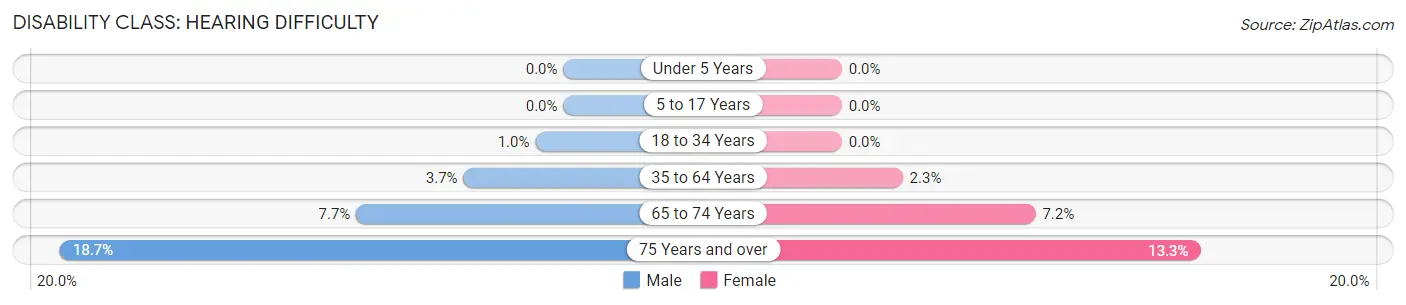
| Age Bracket | Male | Female |
| Under 5 Years | 0 (0.0%) | 0 (0.0%) |
| 5 to 17 Years | 0 (0.0%) | 0 (0.0%) |
| 18 to 34 Years | 17 (1.0%) | 0 (0.0%) |
| 35 to 64 Years | 126 (3.7%) | 73 (2.3%) |
| 65 to 74 Years | 47 (7.7%) | 50 (7.2%) |
| 75 Years and over | 57 (18.7%) | 41 (13.3%) |
Disability Class: Vision Difficulty
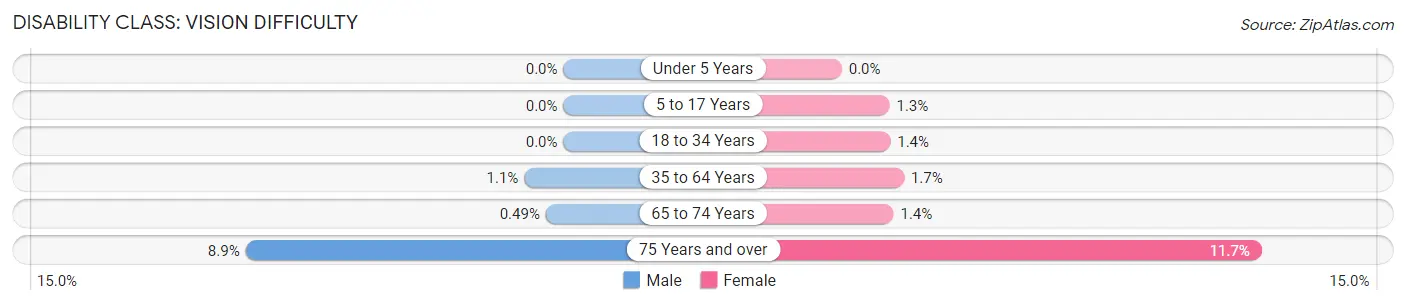
| Age Bracket | Male | Female |
| Under 5 Years | 0 (0.0%) | 0 (0.0%) |
| 5 to 17 Years | 0 (0.0%) | 14 (1.3%) |
| 18 to 34 Years | 0 (0.0%) | 21 (1.3%) |
| 35 to 64 Years | 37 (1.1%) | 56 (1.7%) |
| 65 to 74 Years | 3 (0.5%) | 10 (1.4%) |
| 75 Years and over | 27 (8.8%) | 36 (11.7%) |
Disability Class: Cognitive Difficulty
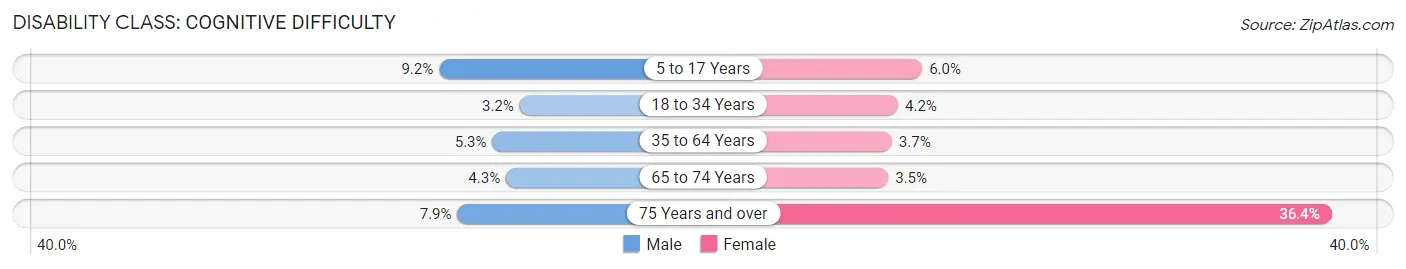
| Age Bracket | Male | Female |
| 5 to 17 Years | 95 (9.2%) | 63 (6.0%) |
| 18 to 34 Years | 53 (3.2%) | 65 (4.2%) |
| 35 to 64 Years | 179 (5.3%) | 120 (3.7%) |
| 65 to 74 Years | 26 (4.3%) | 24 (3.5%) |
| 75 Years and over | 24 (7.9%) | 112 (36.4%) |
Disability Class: Ambulatory Difficulty
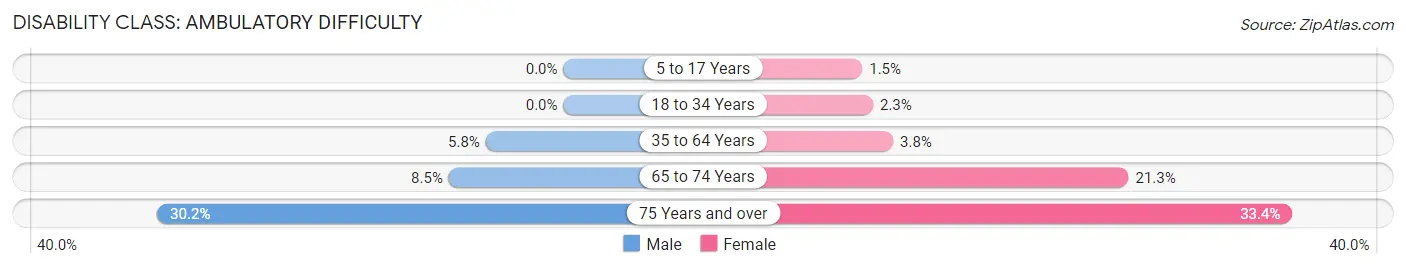
| Age Bracket | Male | Female |
| 5 to 17 Years | 0 (0.0%) | 16 (1.5%) |
| 18 to 34 Years | 0 (0.0%) | 36 (2.3%) |
| 35 to 64 Years | 196 (5.8%) | 123 (3.8%) |
| 65 to 74 Years | 52 (8.5%) | 148 (21.3%) |
| 75 Years and over | 92 (30.2%) | 103 (33.4%) |
Disability Class: Self-Care Difficulty
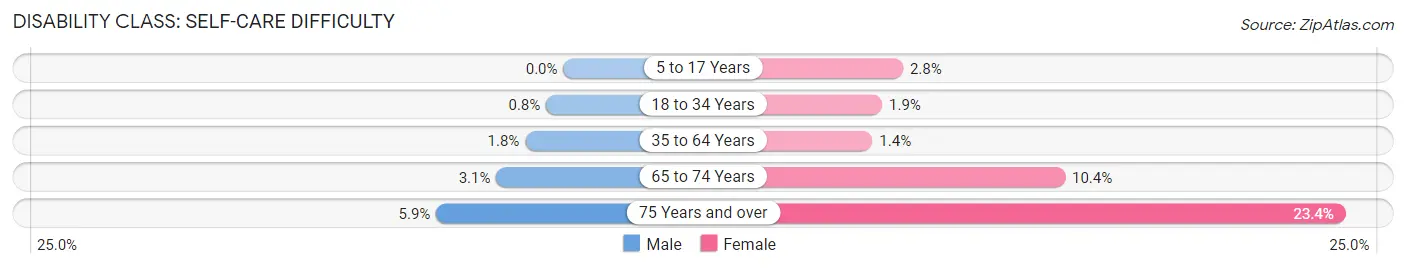
| Age Bracket | Male | Female |
| 5 to 17 Years | 0 (0.0%) | 30 (2.8%) |
| 18 to 34 Years | 13 (0.8%) | 29 (1.9%) |
| 35 to 64 Years | 60 (1.8%) | 46 (1.4%) |
| 65 to 74 Years | 19 (3.1%) | 72 (10.4%) |
| 75 Years and over | 18 (5.9%) | 72 (23.4%) |
Technology Access in Hopatcong borough
Computing Device Access in Hopatcong borough
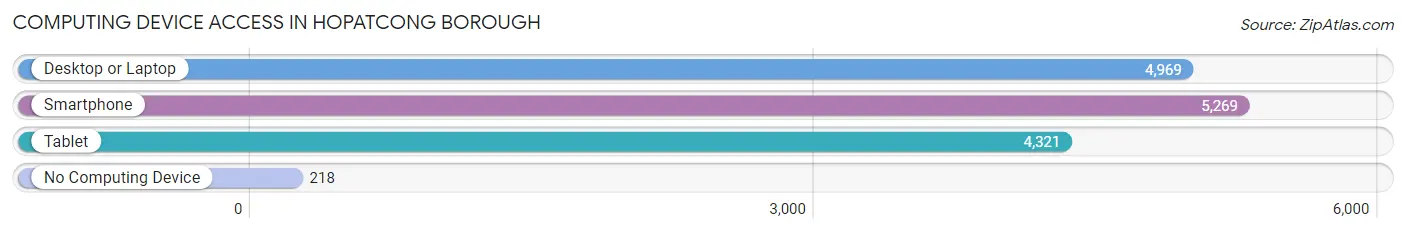
| Device Type | # Households | % Households |
| Desktop or Laptop | 4,969 | 86.3% |
| Smartphone | 5,269 | 91.5% |
| Tablet | 4,321 | 75.1% |
| No Computing Device | 218 | 3.8% |
| Total | 5,756 | 100.0% |
Internet Access in Hopatcong borough
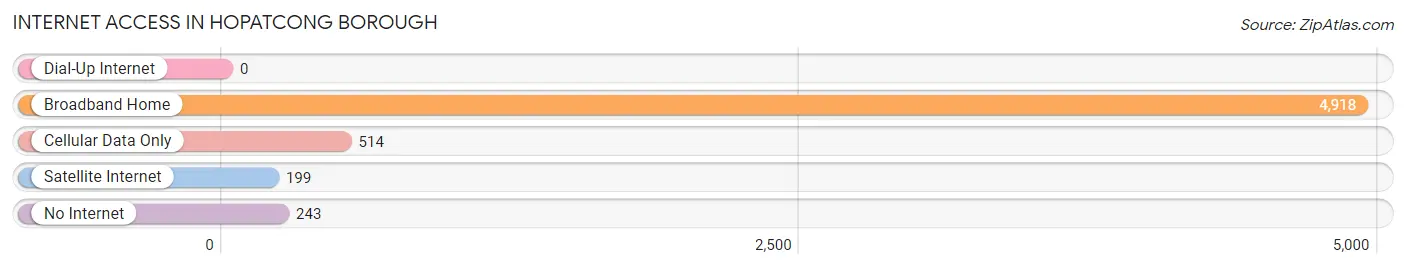
| Internet Type | # Households | % Households |
| Dial-Up Internet | 0 | 0.0% |
| Broadband Home | 4,918 | 85.4% |
| Cellular Data Only | 514 | 8.9% |
| Satellite Internet | 199 | 3.5% |
| No Internet | 243 | 4.2% |
| Total | 5,756 | 100.0% |
Hopatcong borough Summary
Hopatcong Borough is a borough located in Sussex County, New Jersey, United States. As of the 2010 United States Census, the borough's population was 15,147, reflecting an increase of 1,307 (+9.5%) from the 13,840 counted in the 2000 Census, which had in turn increased by 1,976 (+16.7%) from the 11,864 counted in the 1990 Census.
History
The area that is now Hopatcong was originally inhabited by the Lenni Lenape Native Americans. The area was first settled by Europeans in the early 18th century. The area was originally known as "Hoppatcong", a name derived from the Lenni Lenape word "Hoppecon", meaning "pipe stone".
The area was part of the Township of Roxbury, which was created in 1740. In 1852, the area was separated from Roxbury and incorporated as the Township of Hopatcong. In 1918, the Township of Hopatcong was incorporated as a borough.
Geography
Hopatcong Borough is located in the northwest corner of Sussex County, New Jersey. It is bordered by the townships of Byram, Jefferson, and Sparta. The borough is located on the shores of Lake Hopatcong, the largest lake in New Jersey.
The borough has a total area of 8.3 square miles, of which 7.9 square miles is land and 0.4 square miles (4.90%) is water.
Economy
The economy of Hopatcong Borough is largely based on tourism and recreation. The borough is home to Lake Hopatcong, the largest lake in New Jersey, which attracts visitors from all over the state and beyond. The lake is a popular destination for fishing, boating, swimming, and other recreational activities.
The borough is also home to several small businesses, including restaurants, retail stores, and professional services.
Demographics
As of the 2010 United States Census, there were 15,147 people, 6,093 households, and 4,072 families residing in the borough. The population density was 1,912.3 per square mile (737.3/km2). There were 6,541 housing units at an average density of 825.2 per square mile (318.9/km2). The racial makeup of the borough was 90.2% White, 2.3% African American, 0.2% Native American, 3.2% Asian, 0.0% Pacific Islander, 2.2% from other races, and 1.9% from two or more races. Hispanic or Latino of any race were 8.2% of the population.
There were 6,093 households, out of which 28.2% had children under the age of 18 living with them, 51.2% were married couples living together, 10.7% had a female householder with no husband present, and 33.2% were non-families. 27.2% of all households were made up of individuals, and 11.2% had someone living alone who was 65 years of age or older. The average household size was 2.48 and the average family size was 3.04.
In the borough, the population was spread out, with 22.2% under the age of 18, 7.2% from 18 to 24, 28.2% from 25 to 44, 27.2% from 45 to 64, and 15.2% who were 65 years of age or older. The median age was 40.2 years. For every 100 females, there were 94.2 males. For every 100 females ages 18 and older there were 91.2 males.
The median income for a household in the borough was $62,917, and the median income for a family was $76,917. Males had a median income of $51,917 versus $41,917 for females. The per capita income for the borough was $30,917. About 4.2% of families and 5.7% of the population were below the poverty line, including 6.7% of those under age 18 and 5.2% of those age 65 or over.
Common Questions
What is Per Capita Income in Hopatcong borough?
Per Capita income in Hopatcong borough is $52,157.
What is the Median Family Income in Hopatcong borough?
Median Family Income in Hopatcong borough is $123,706.
What is the Median Household income in Hopatcong borough?
Median Household Income in Hopatcong borough is $107,670.
What is Income or Wage Gap in Hopatcong borough?
Income or Wage Gap in Hopatcong borough is 11.3%.
Women in Hopatcong borough earn 88.7 cents for every dollar earned by a man.
What is Family Income Deficit in Hopatcong borough?
Family Income Deficit in Hopatcong borough is $12,770.
Families that are below poverty line in Hopatcong borough earn $12,770 less on average than the poverty threshold level.
What is Inequality or Gini Index in Hopatcong borough?
Inequality or Gini Index in Hopatcong borough is 0.38.
What is the Total Population of Hopatcong borough?
Total Population of Hopatcong borough is 14,411.
What is the Total Male Population of Hopatcong borough?
Total Male Population of Hopatcong borough is 7,288.
What is the Total Female Population of Hopatcong borough?
Total Female Population of Hopatcong borough is 7,123.
What is the Ratio of Males per 100 Females in Hopatcong borough?
There are 102.32 Males per 100 Females in Hopatcong borough.
What is the Ratio of Females per 100 Males in Hopatcong borough?
There are 97.74 Females per 100 Males in Hopatcong borough.
What is the Median Population Age in Hopatcong borough?
Median Population Age in Hopatcong borough is 41.5 Years.
What is the Average Family Size in Hopatcong borough
Average Family Size in Hopatcong borough is 3.0 People.
What is the Average Household Size in Hopatcong borough
Average Household Size in Hopatcong borough is 2.5 People.
How Large is the Labor Force in Hopatcong borough?
There are 8,857 People in the Labor Forcein in Hopatcong borough.
What is the Percentage of People in the Labor Force in Hopatcong borough?
74.2% of People are in the Labor Force in Hopatcong borough.
What is the Unemployment Rate in Hopatcong borough?
Unemployment Rate in Hopatcong borough is 3.1%.