Mountain Lake, NJ Map & Demographics
Mountain Lake Map
Mountain Lake Overview
$54,165
PER CAPITA INCOME
$94,826
AVG FAMILY INCOME
$93,690
AVG HOUSEHOLD INCOME
40.0%
WAGE / INCOME GAP [ % ]
60.0¢/ $1
WAGE / INCOME GAP [ $ ]
0.34
INEQUALITY / GINI INDEX
543
TOTAL POPULATION
253
MALE POPULATION
290
FEMALE POPULATION
87.24
MALES / 100 FEMALES
114.62
FEMALES / 100 MALES
55.6
MEDIAN AGE
2.7
AVG FAMILY SIZE
2.3
AVG HOUSEHOLD SIZE
407
LABOR FORCE [ PEOPLE ]
79.6%
PERCENT IN LABOR FORCE
1.5%
UNEMPLOYMENT RATE
Income in Mountain Lake
Income Overview in Mountain Lake
Per Capita Income in Mountain Lake is $54,165, while median incomes of families and households are $94,826 and $93,690 respectively.
| Characteristic | Number | Measure |
| Per Capita Income | 543 | $54,165 |
| Median Family Income | 167 | $94,826 |
| Mean Family Income | 167 | $136,461 |
| Median Household Income | 232 | $93,690 |
| Mean Household Income | 232 | $118,272 |
| Income Deficit | 167 | $0 |
| Wage / Income Gap (%) | 543 | 40.00% |
| Wage / Income Gap ($) | 543 | 60.00¢ per $1 |
| Gini / Inequality Index | 543 | 0.34 |
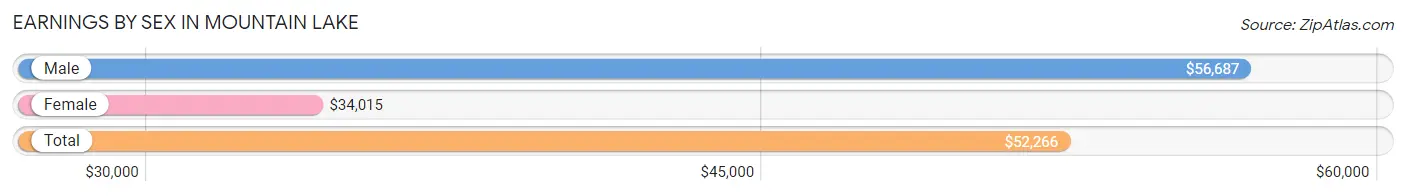
Earnings by Sex in Mountain Lake
Average Earnings in Mountain Lake are $52,266, $56,687 for men and $34,015 for women, a difference of 40.0%.
| Sex | Number | Average Earnings |
| Male | 183 (45.6%) | $56,687 |
| Female | 218 (54.4%) | $34,015 |
| Total | 401 (100.0%) | $52,266 |
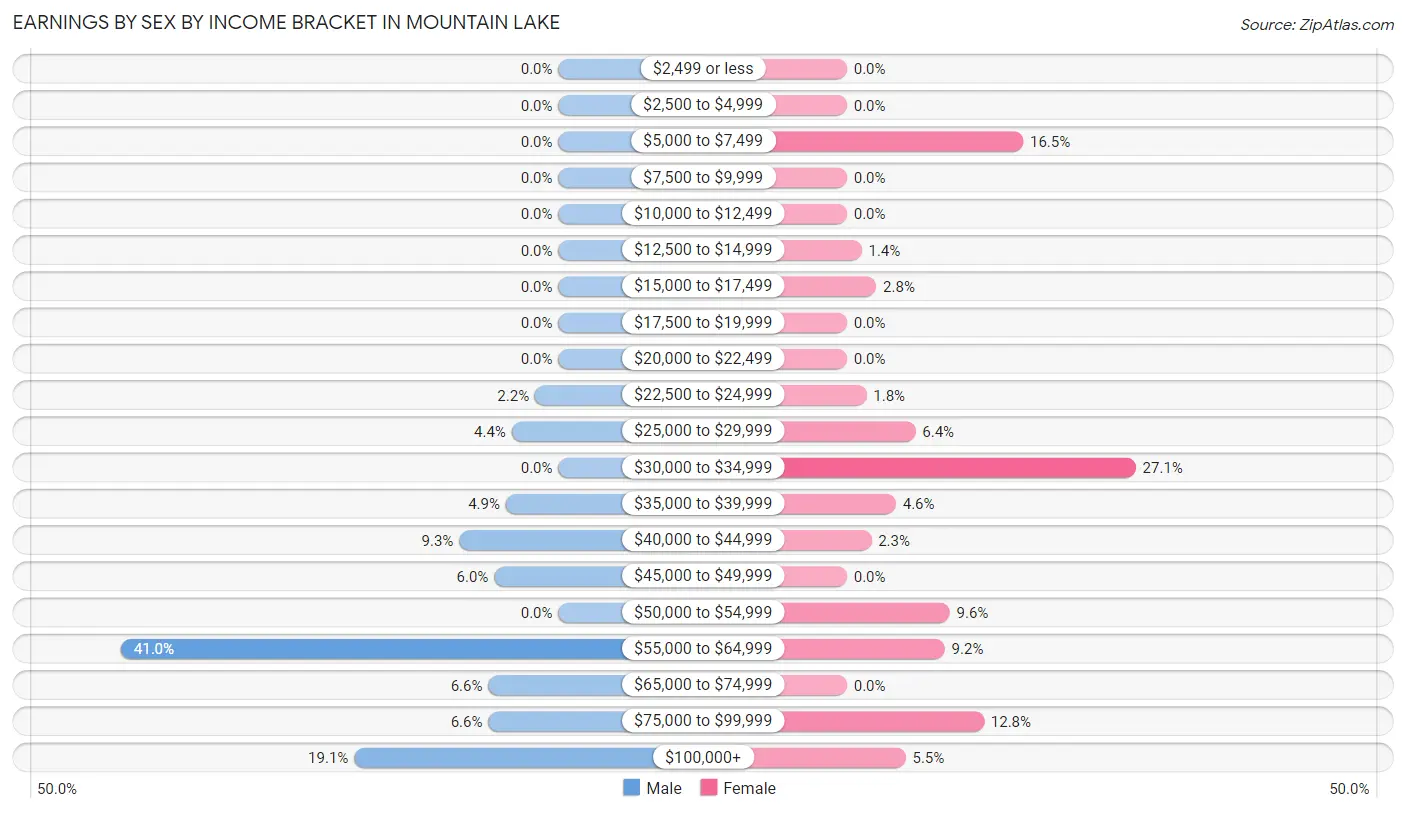
Earnings by Sex by Income Bracket in Mountain Lake
The most common earnings brackets in Mountain Lake are $55,000 to $64,999 for men (75 | 41.0%) and $30,000 to $34,999 for women (59 | 27.1%).
| Income | Male | Female |
| $2,499 or less | 0 (0.0%) | 0 (0.0%) |
| $2,500 to $4,999 | 0 (0.0%) | 0 (0.0%) |
| $5,000 to $7,499 | 0 (0.0%) | 36 (16.5%) |
| $7,500 to $9,999 | 0 (0.0%) | 0 (0.0%) |
| $10,000 to $12,499 | 0 (0.0%) | 0 (0.0%) |
| $12,500 to $14,999 | 0 (0.0%) | 3 (1.4%) |
| $15,000 to $17,499 | 0 (0.0%) | 6 (2.8%) |
| $17,500 to $19,999 | 0 (0.0%) | 0 (0.0%) |
| $20,000 to $22,499 | 0 (0.0%) | 0 (0.0%) |
| $22,500 to $24,999 | 4 (2.2%) | 4 (1.8%) |
| $25,000 to $29,999 | 8 (4.4%) | 14 (6.4%) |
| $30,000 to $34,999 | 0 (0.0%) | 59 (27.1%) |
| $35,000 to $39,999 | 9 (4.9%) | 10 (4.6%) |
| $40,000 to $44,999 | 17 (9.3%) | 5 (2.3%) |
| $45,000 to $49,999 | 11 (6.0%) | 0 (0.0%) |
| $50,000 to $54,999 | 0 (0.0%) | 21 (9.6%) |
| $55,000 to $64,999 | 75 (41.0%) | 20 (9.2%) |
| $65,000 to $74,999 | 12 (6.6%) | 0 (0.0%) |
| $75,000 to $99,999 | 12 (6.6%) | 28 (12.8%) |
| $100,000+ | 35 (19.1%) | 12 (5.5%) |
| Total | 183 (100.0%) | 218 (100.0%) |
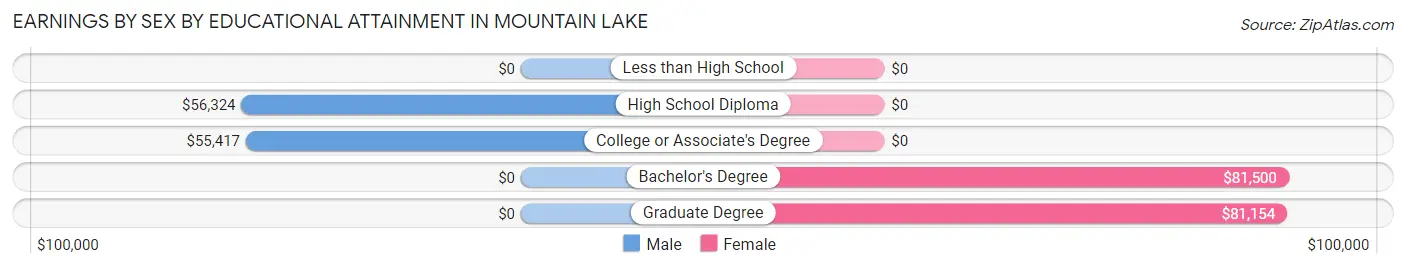
Earnings by Sex by Educational Attainment in Mountain Lake
Average earnings in Mountain Lake are $56,607 for men and $35,375 for women, a difference of 37.5%. Men with an educational attainment of high school diploma enjoy the highest average annual earnings of $56,324, while those with college or associate's degree education earn the least with $55,417. Women with an educational attainment of bachelor's degree earn the most with the average annual earnings of $81,500, while those with graduate degree education have the smallest earnings of $81,154.
| Educational Attainment | Male Income | Female Income |
| Less than High School | - | - |
| High School Diploma | $56,324 | $0 |
| College or Associate's Degree | $55,417 | $0 |
| Bachelor's Degree | - | - |
| Graduate Degree | - | - |
| Total | $56,607 | $35,375 |
Family Income in Mountain Lake
Family Income Brackets in Mountain Lake
According to the Mountain Lake family income data, there are 58 families falling into the $75,000 to $99,999 income range, which is the most common income bracket and makes up 34.7% of all families.
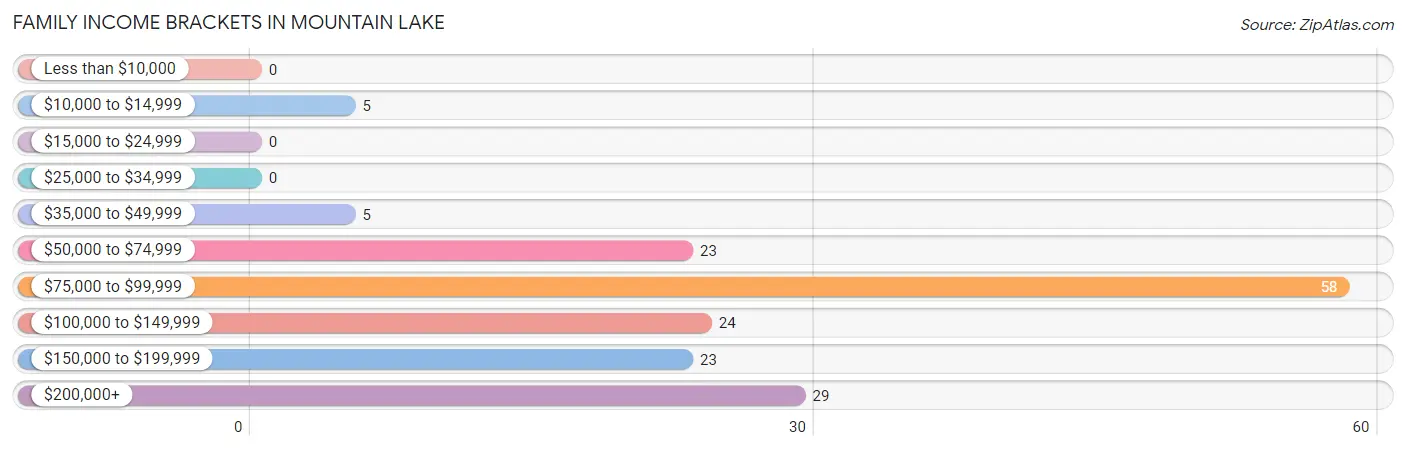
| Income Bracket | # Families | % Families |
| Less than $10,000 | 0 | 0.0% |
| $10,000 to $14,999 | 5 | 3.0% |
| $15,000 to $24,999 | 0 | 0.0% |
| $25,000 to $34,999 | 0 | 0.0% |
| $35,000 to $49,999 | 5 | 3.0% |
| $50,000 to $74,999 | 23 | 13.8% |
| $75,000 to $99,999 | 58 | 34.7% |
| $100,000 to $149,999 | 24 | 14.4% |
| $150,000 to $199,999 | 23 | 13.8% |
| $200,000+ | 29 | 17.4% |
Family Income by Famaliy Size in Mountain Lake
2-person families (120 | 71.9%) account for the highest median family income in Mountain Lake with $94,375 per family, while 2-person families (120 | 71.9%) have the highest median income of $47,188 per family member.
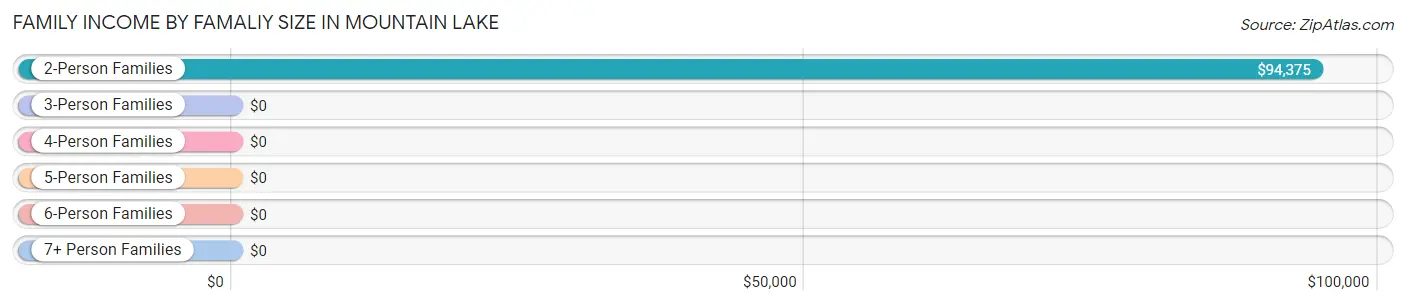
| Income Bracket | # Families | Median Income |
| 2-Person Families | 120 (71.9%) | $94,375 |
| 3-Person Families | 31 (18.6%) | $0 |
| 4-Person Families | 6 (3.6%) | $0 |
| 5-Person Families | 10 (6.0%) | $0 |
| 6-Person Families | 0 (0.0%) | $0 |
| 7+ Person Families | 0 (0.0%) | $0 |
| Total | 167 (100.0%) | $94,826 |
Family Income by Number of Earners in Mountain Lake
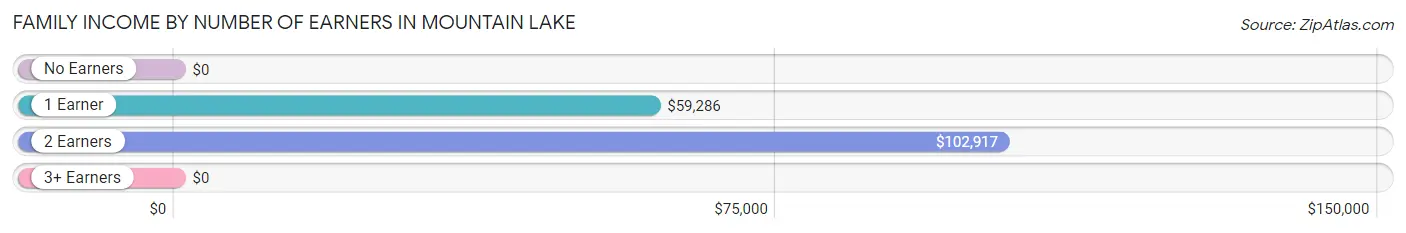
| Number of Earners | # Families | Median Income |
| No Earners | 12 (7.2%) | $0 |
| 1 Earner | 32 (19.2%) | $59,286 |
| 2 Earners | 109 (65.3%) | $102,917 |
| 3+ Earners | 14 (8.4%) | $0 |
| Total | 167 (100.0%) | $94,826 |
Household Income in Mountain Lake
Household Income Brackets in Mountain Lake
With 69 households falling in the category, the $75,000 to $99,999 income range is the most frequent in Mountain Lake, accounting for 29.7% of all households.
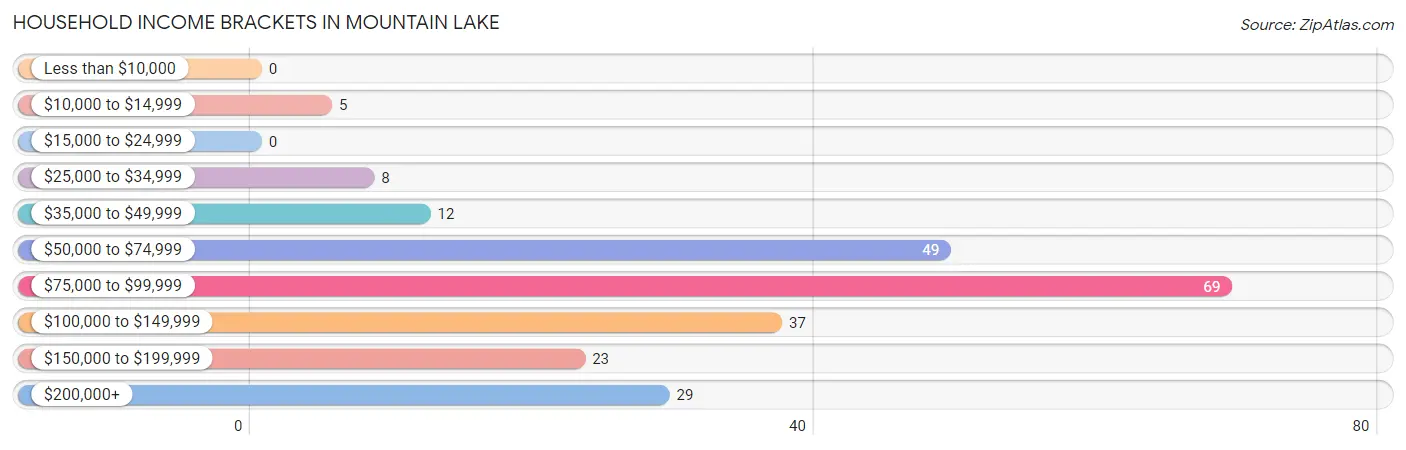
| Income Bracket | # Households | % Households |
| Less than $10,000 | 0 | 0.0% |
| $10,000 to $14,999 | 5 | 2.2% |
| $15,000 to $24,999 | 0 | 0.0% |
| $25,000 to $34,999 | 8 | 3.4% |
| $35,000 to $49,999 | 12 | 5.2% |
| $50,000 to $74,999 | 49 | 21.1% |
| $75,000 to $99,999 | 69 | 29.7% |
| $100,000 to $149,999 | 37 | 15.9% |
| $150,000 to $199,999 | 23 | 9.9% |
| $200,000+ | 29 | 12.5% |
Household Income by Householder Age in Mountain Lake
The median household income in Mountain Lake is $93,690, with the highest median household income of $123,929 found in the 25 to 44 years age bracket for the primary householder. A total of 42 households (18.1%) fall into this category.
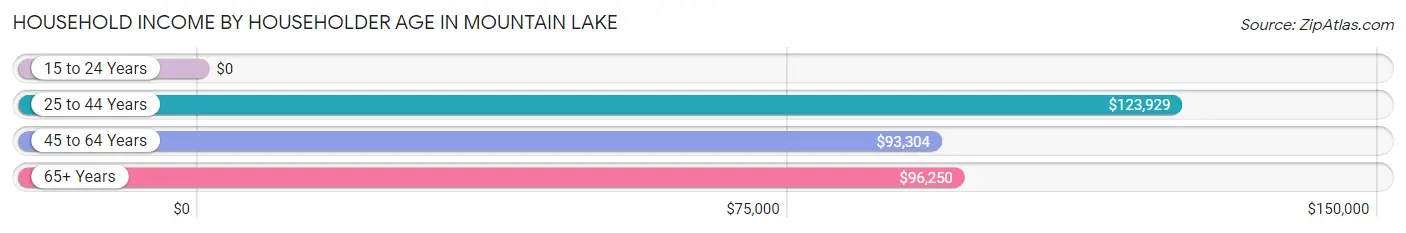
| Income Bracket | # Households | Median Income |
| 15 to 24 Years | 0 (0.0%) | $0 |
| 25 to 44 Years | 42 (18.1%) | $123,929 |
| 45 to 64 Years | 135 (58.2%) | $93,304 |
| 65+ Years | 55 (23.7%) | $96,250 |
| Total | 232 (100.0%) | $93,690 |
Poverty in Mountain Lake
Income Below Poverty by Sex and Age in Mountain Lake
With 5.5% poverty level for males and 5.2% for females among the residents of Mountain Lake, 45 to 54 year old males and 45 to 54 year old females are the most vulnerable to poverty, with 5 males (10.9%) and 10 females (20.0%) in their respective age groups living below the poverty level.
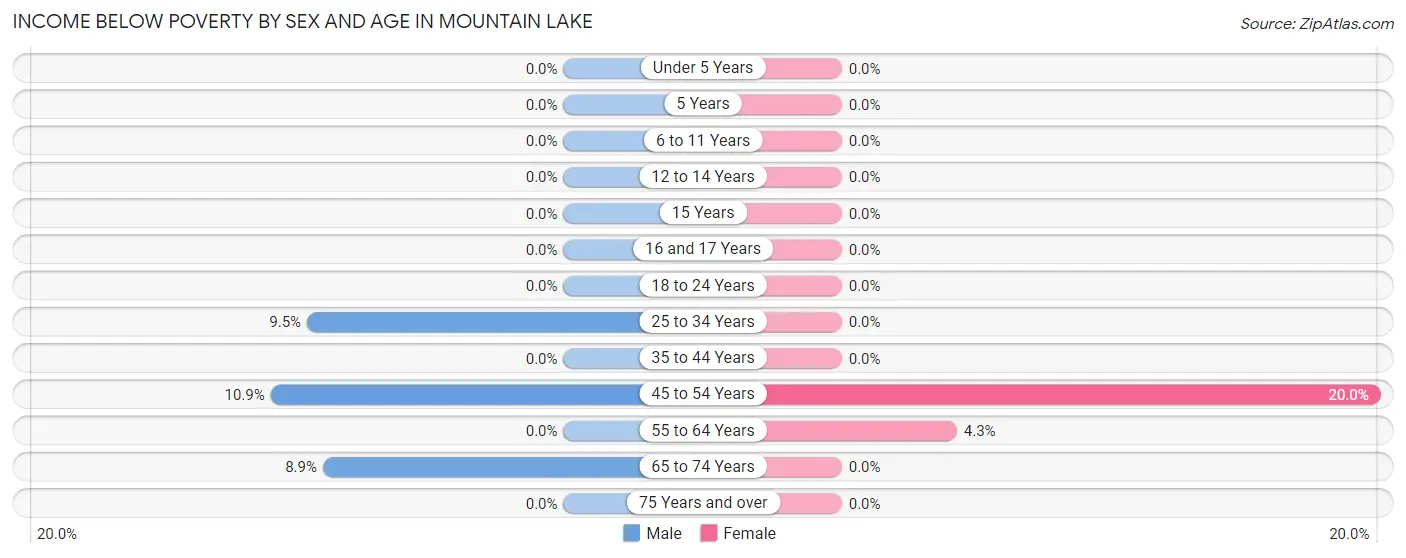
| Age Bracket | Male | Female |
| Under 5 Years | 0 (0.0%) | 0 (0.0%) |
| 5 Years | 0 (0.0%) | 0 (0.0%) |
| 6 to 11 Years | 0 (0.0%) | 0 (0.0%) |
| 12 to 14 Years | 0 (0.0%) | 0 (0.0%) |
| 15 Years | 0 (0.0%) | 0 (0.0%) |
| 16 and 17 Years | 0 (0.0%) | 0 (0.0%) |
| 18 to 24 Years | 0 (0.0%) | 0 (0.0%) |
| 25 to 34 Years | 4 (9.5%) | 0 (0.0%) |
| 35 to 44 Years | 0 (0.0%) | 0 (0.0%) |
| 45 to 54 Years | 5 (10.9%) | 10 (20.0%) |
| 55 to 64 Years | 0 (0.0%) | 5 (4.3%) |
| 65 to 74 Years | 5 (8.9%) | 0 (0.0%) |
| 75 Years and over | 0 (0.0%) | 0 (0.0%) |
| Total | 14 (5.5%) | 15 (5.2%) |
Income Above Poverty by Sex and Age in Mountain Lake
According to the poverty statistics in Mountain Lake, males aged 5 years and females aged 12 to 14 years are the age groups that are most secure financially, with 100.0% of males and 100.0% of females in these age groups living above the poverty line.
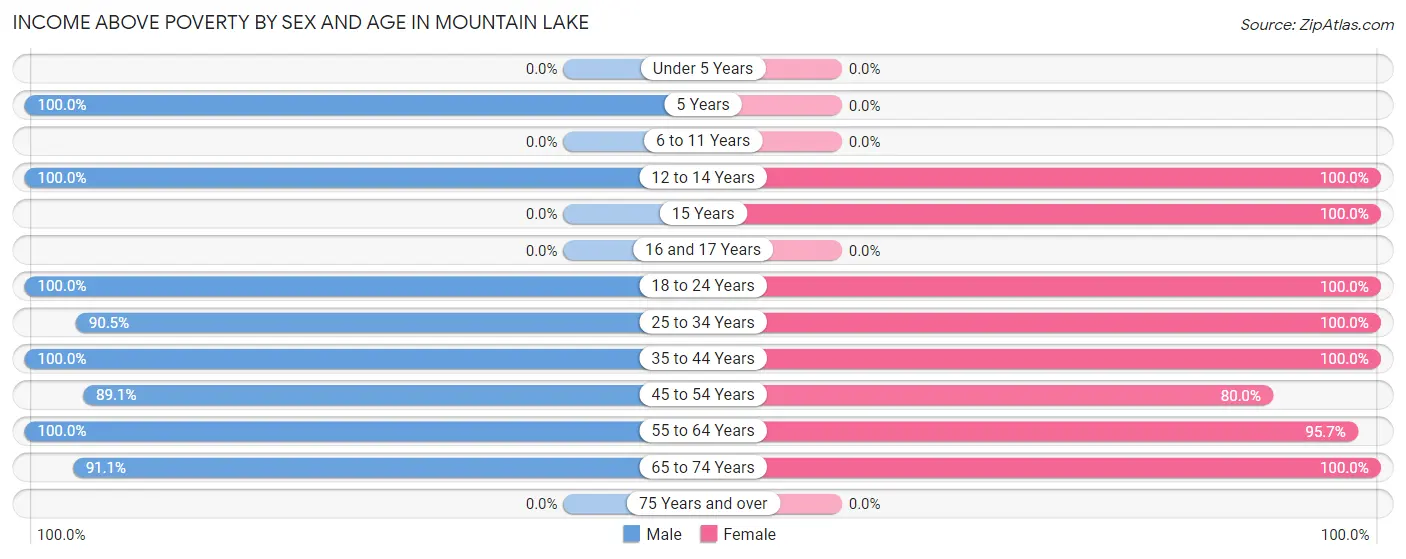
| Age Bracket | Male | Female |
| Under 5 Years | 0 (0.0%) | 0 (0.0%) |
| 5 Years | 6 (100.0%) | 0 (0.0%) |
| 6 to 11 Years | 0 (0.0%) | 0 (0.0%) |
| 12 to 14 Years | 6 (100.0%) | 7 (100.0%) |
| 15 Years | 0 (0.0%) | 13 (100.0%) |
| 16 and 17 Years | 0 (0.0%) | 0 (0.0%) |
| 18 to 24 Years | 4 (100.0%) | 29 (100.0%) |
| 25 to 34 Years | 38 (90.5%) | 28 (100.0%) |
| 35 to 44 Years | 11 (100.0%) | 12 (100.0%) |
| 45 to 54 Years | 41 (89.1%) | 40 (80.0%) |
| 55 to 64 Years | 82 (100.0%) | 112 (95.7%) |
| 65 to 74 Years | 51 (91.1%) | 34 (100.0%) |
| 75 Years and over | 0 (0.0%) | 0 (0.0%) |
| Total | 239 (94.5%) | 275 (94.8%) |
Income Below Poverty Among Married-Couple Families in Mountain Lake
The poverty statistics for married-couple families in Mountain Lake show that 3.2% or 5 of the total 156 families live below the poverty line. Families with no children have the highest poverty rate of 3.8%, comprising of 5 families. On the other hand, families with 1 or 2 children have the lowest poverty rate of 0.0%, which includes 0 families.
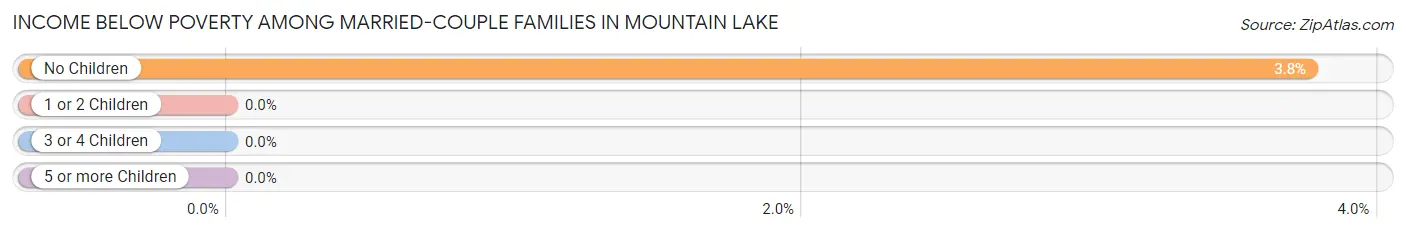
| Children | Above Poverty | Below Poverty |
| No Children | 128 (96.2%) | 5 (3.8%) |
| 1 or 2 Children | 23 (100.0%) | 0 (0.0%) |
| 3 or 4 Children | 0 (0.0%) | 0 (0.0%) |
| 5 or more Children | 0 (0.0%) | 0 (0.0%) |
| Total | 151 (96.8%) | 5 (3.2%) |
Income Below Poverty Among Single-Parent Households in Mountain Lake
| Children | Single Father | Single Mother |
| No Children | 0 (0.0%) | 0 (0.0%) |
| 1 or 2 Children | 0 (0.0%) | 0 (0.0%) |
| 3 or 4 Children | 0 (0.0%) | 0 (0.0%) |
| 5 or more Children | 0 (0.0%) | 0 (0.0%) |
| Total | 0 (0.0%) | 0 (0.0%) |
Income Below Poverty Among Married-Couple vs Single-Parent Households in Mountain Lake
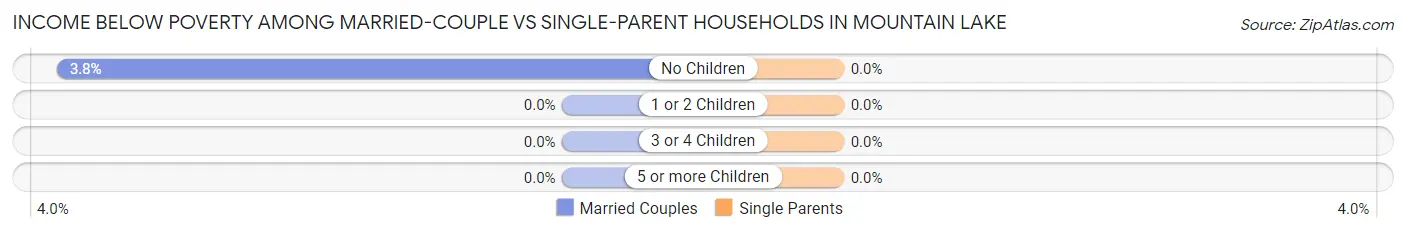
| Children | Married-Couple Families | Single-Parent Households |
| No Children | 5 (3.8%) | 0 (0.0%) |
| 1 or 2 Children | 0 (0.0%) | 0 (0.0%) |
| 3 or 4 Children | 0 (0.0%) | 0 (0.0%) |
| 5 or more Children | 0 (0.0%) | 0 (0.0%) |
| Total | 5 (3.2%) | 0 (0.0%) |
Race in Mountain Lake
The most populous races in Mountain Lake are White / Caucasian (481 | 88.6%), Two or more Races (58 | 10.7%), and Hispanic or Latino (54 | 9.9%).
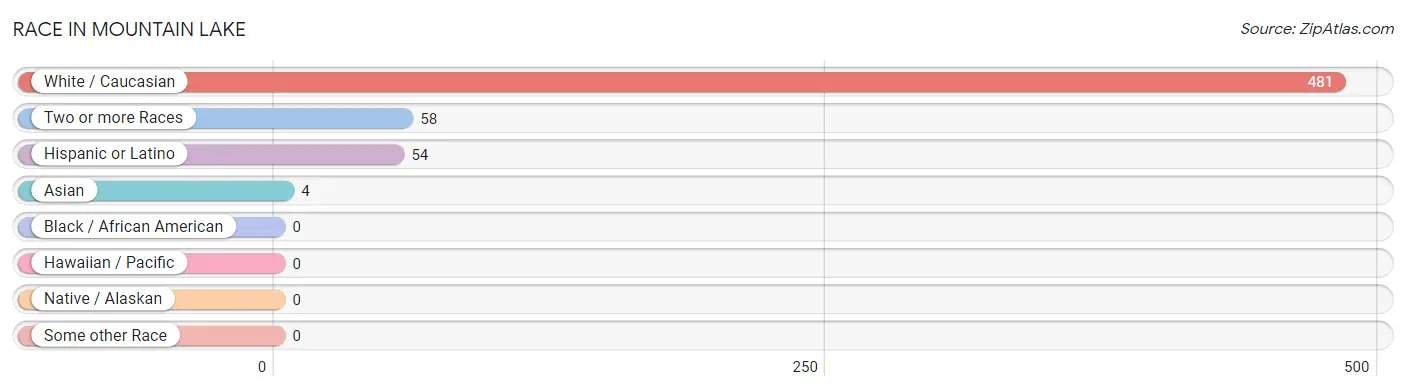
| Race | # Population | % Population |
| Asian | 4 | 0.7% |
| Black / African American | 0 | 0.0% |
| Hawaiian / Pacific | 0 | 0.0% |
| Hispanic or Latino | 54 | 9.9% |
| Native / Alaskan | 0 | 0.0% |
| White / Caucasian | 481 | 88.6% |
| Two or more Races | 58 | 10.7% |
| Some other Race | 0 | 0.0% |
| Total | 543 | 100.0% |
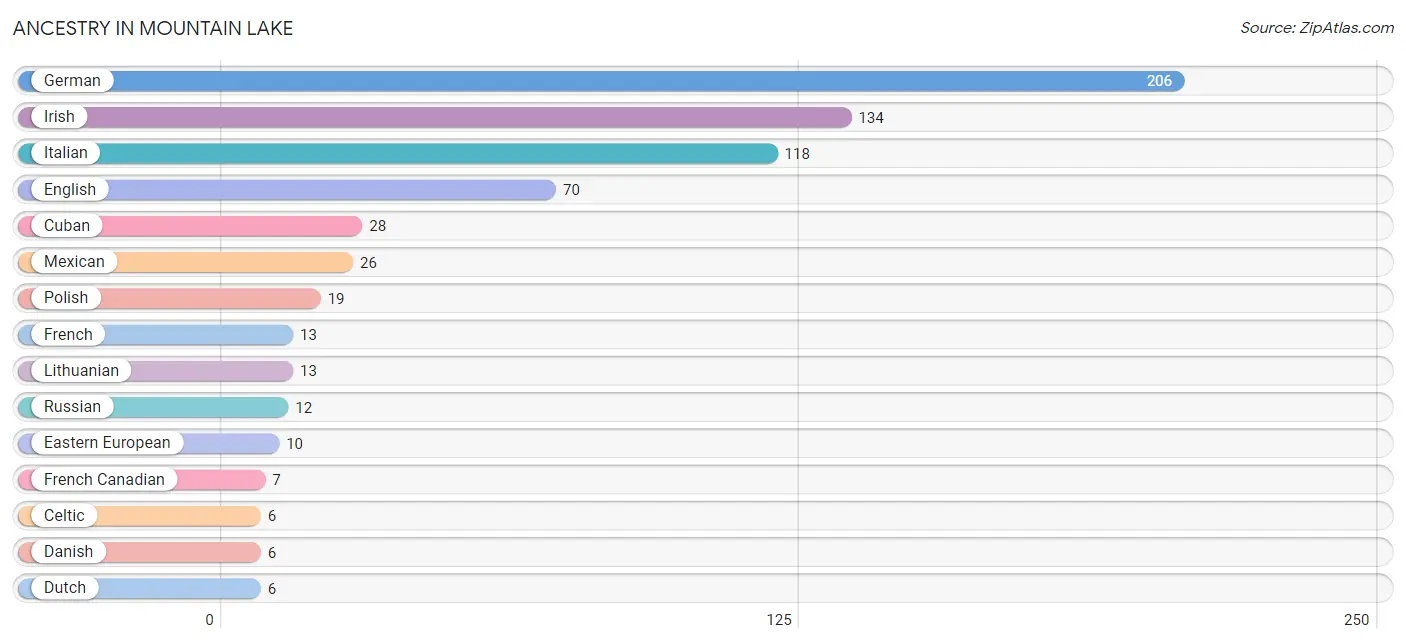
Ancestry in Mountain Lake
The most populous ancestries reported in Mountain Lake are German (206 | 37.9%), Irish (134 | 24.7%), Italian (118 | 21.7%), English (70 | 12.9%), and Cuban (28 | 5.2%), together accounting for 102.4% of all Mountain Lake residents.
| Ancestry | # Population | % Population |
| American | 3 | 0.5% |
| British | 4 | 0.7% |
| Burmese | 4 | 0.7% |
| Celtic | 6 | 1.1% |
| Cuban | 28 | 5.2% |
| Danish | 6 | 1.1% |
| Dutch | 6 | 1.1% |
| Eastern European | 10 | 1.8% |
| English | 70 | 12.9% |
| French | 13 | 2.4% |
| French Canadian | 7 | 1.3% |
| German | 206 | 37.9% |
| Hungarian | 3 | 0.5% |
| Irish | 134 | 24.7% |
| Italian | 118 | 21.7% |
| Lithuanian | 13 | 2.4% |
| Mexican | 26 | 4.8% |
| Norwegian | 3 | 0.5% |
| Polish | 19 | 3.5% |
| Russian | 12 | 2.2% |
| Scottish | 5 | 0.9% |
| Ukrainian | 3 | 0.5% | View All 22 Rows |
Immigrants in Mountain Lake
The most numerous immigrant groups reported in Mountain Lake came from Latin America (36 | 6.6%), Central America (26 | 4.8%), Mexico (26 | 4.8%), Caribbean (10 | 1.8%), and Cuba (10 | 1.8%), together accounting for 19.9% of all Mountain Lake residents.
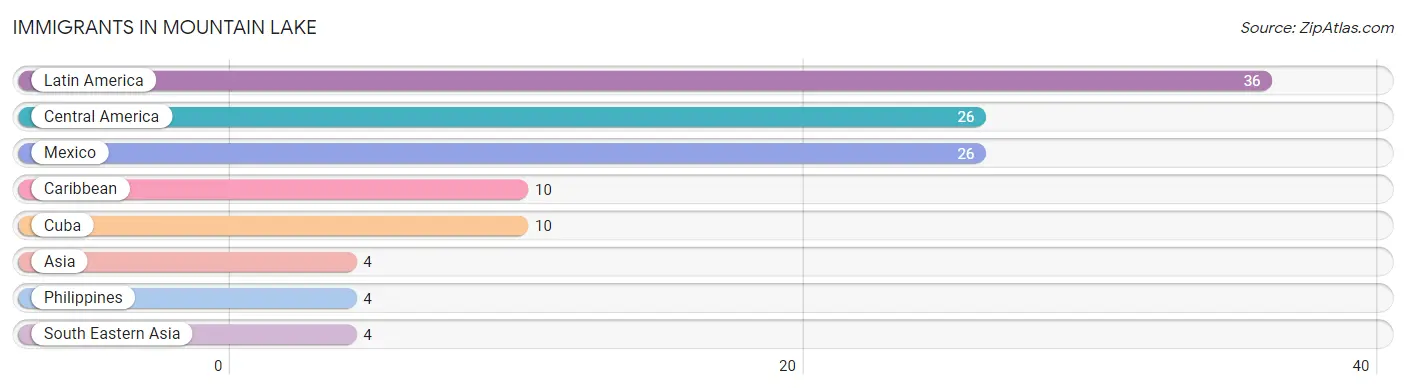
| Immigration Origin | # Population | % Population |
| Asia | 4 | 0.7% |
| Caribbean | 10 | 1.8% |
| Central America | 26 | 4.8% |
| Cuba | 10 | 1.8% |
| Latin America | 36 | 6.6% |
| Mexico | 26 | 4.8% |
| Philippines | 4 | 0.7% |
| South Eastern Asia | 4 | 0.7% | View All 8 Rows |
Sex and Age in Mountain Lake
Sex and Age in Mountain Lake
The most populous age groups in Mountain Lake are 55 to 59 Years (58 | 22.9%) for men and 55 to 59 Years (92 | 31.7%) for women.
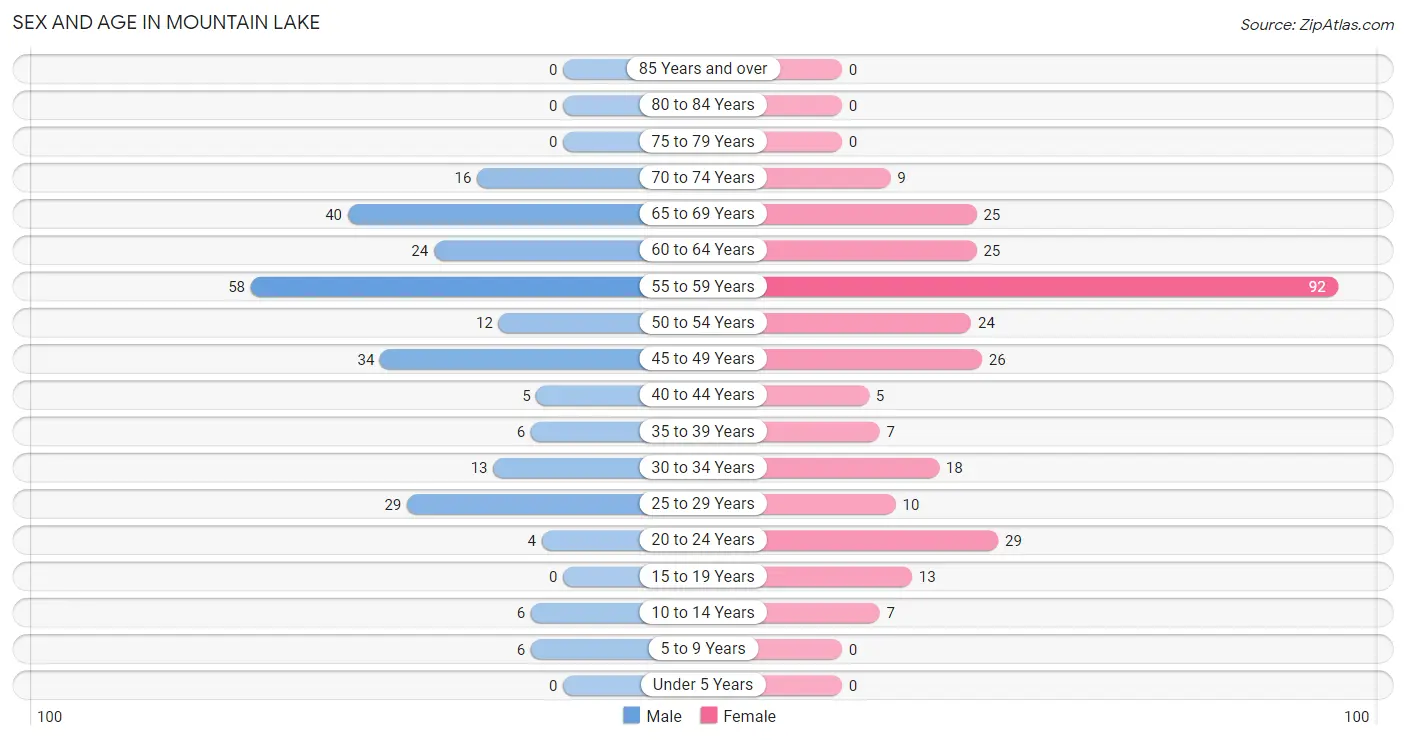
| Age Bracket | Male | Female |
| Under 5 Years | 0 (0.0%) | 0 (0.0%) |
| 5 to 9 Years | 6 (2.4%) | 0 (0.0%) |
| 10 to 14 Years | 6 (2.4%) | 7 (2.4%) |
| 15 to 19 Years | 0 (0.0%) | 13 (4.5%) |
| 20 to 24 Years | 4 (1.6%) | 29 (10.0%) |
| 25 to 29 Years | 29 (11.5%) | 10 (3.5%) |
| 30 to 34 Years | 13 (5.1%) | 18 (6.2%) |
| 35 to 39 Years | 6 (2.4%) | 7 (2.4%) |
| 40 to 44 Years | 5 (2.0%) | 5 (1.7%) |
| 45 to 49 Years | 34 (13.4%) | 26 (9.0%) |
| 50 to 54 Years | 12 (4.7%) | 24 (8.3%) |
| 55 to 59 Years | 58 (22.9%) | 92 (31.7%) |
| 60 to 64 Years | 24 (9.5%) | 25 (8.6%) |
| 65 to 69 Years | 40 (15.8%) | 25 (8.6%) |
| 70 to 74 Years | 16 (6.3%) | 9 (3.1%) |
| 75 to 79 Years | 0 (0.0%) | 0 (0.0%) |
| 80 to 84 Years | 0 (0.0%) | 0 (0.0%) |
| 85 Years and over | 0 (0.0%) | 0 (0.0%) |
| Total | 253 (100.0%) | 290 (100.0%) |
Families and Households in Mountain Lake
Median Family Size in Mountain Lake
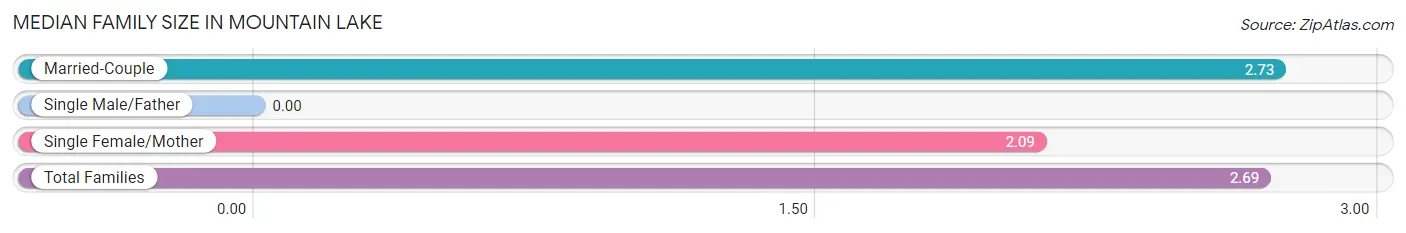
| Family Type | # Families | Family Size |
| Married-Couple | 156 (93.4%) | 2.73 |
| Single Male/Father | 0 (0.0%) | - |
| Single Female/Mother | 11 (6.6%) | 2.09 |
| Total Families | 167 (100.0%) | 2.69 |
Median Household Size in Mountain Lake
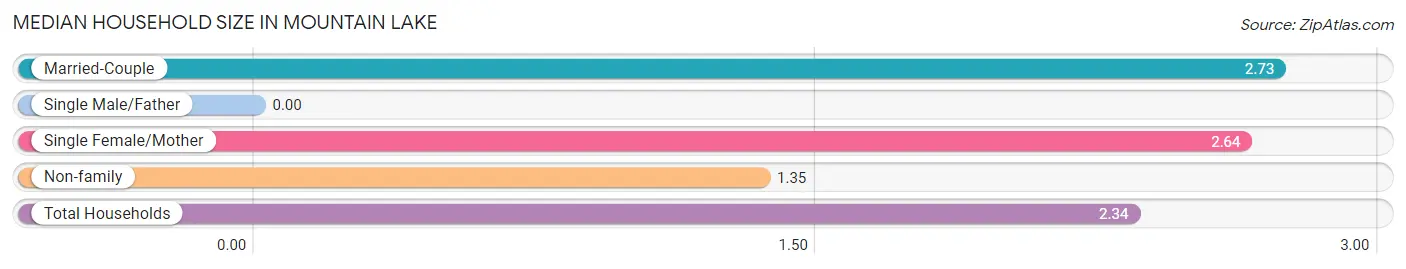
| Household Type | # Households | Household Size |
| Married-Couple | 156 (67.2%) | 2.73 |
| Single Male/Father | 0 (0.0%) | - |
| Single Female/Mother | 11 (4.7%) | 2.64 |
| Non-family | 65 (28.0%) | 1.35 |
| Total Households | 232 (100.0%) | 2.34 |
Household Size by Marriage Status in Mountain Lake
Out of a total of 232 households in Mountain Lake, 167 (72.0%) are family households, while 65 (28.0%) are nonfamily households. The most numerous type of family households are 2-person households, comprising 115, and the most common type of nonfamily households are 1-person households, comprising 60.
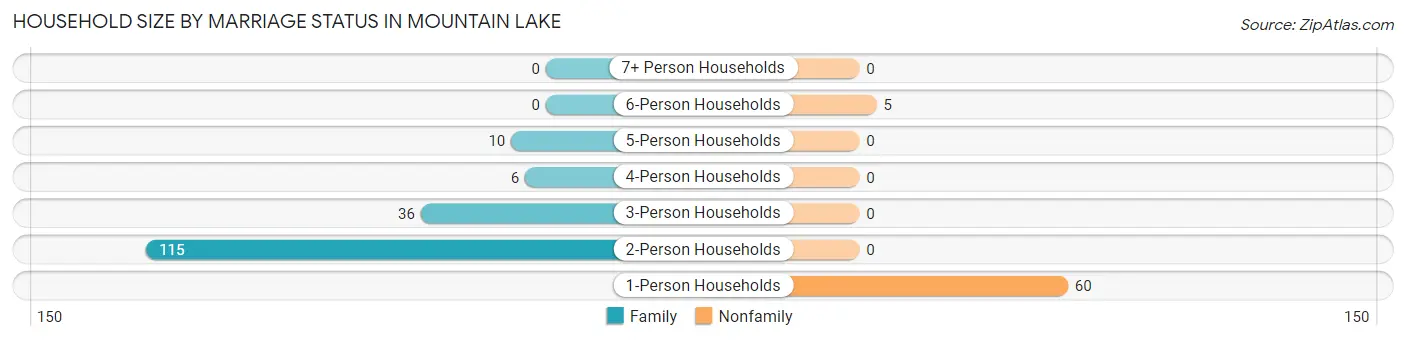
| Household Size | Family Households | Nonfamily Households |
| 1-Person Households | - | 60 (25.9%) |
| 2-Person Households | 115 (49.6%) | 0 (0.0%) |
| 3-Person Households | 36 (15.5%) | 0 (0.0%) |
| 4-Person Households | 6 (2.6%) | 0 (0.0%) |
| 5-Person Households | 10 (4.3%) | 0 (0.0%) |
| 6-Person Households | 0 (0.0%) | 5 (2.2%) |
| 7+ Person Households | 0 (0.0%) | 0 (0.0%) |
| Total | 167 (72.0%) | 65 (28.0%) |
Female Fertility in Mountain Lake
Fertility by Age in Mountain Lake
| Age Bracket | Women with Births | Births / 1,000 Women |
| 15 to 19 years | 0 (0.0%) | 0.0 |
| 20 to 34 years | 0 (0.0%) | 0.0 |
| 35 to 50 years | 0 (0.0%) | 0.0 |
| Total | 0 (0.0%) | 0.0 |
Fertility by Age by Marriage Status in Mountain Lake
| Age Bracket | Married | Unmarried |
| 15 to 19 years | 0 (0.0%) | 0 (0.0%) |
| 20 to 34 years | 0 (0.0%) | 0 (0.0%) |
| 35 to 50 years | 0 (0.0%) | 0 (0.0%) |
| Total | 0 (0.0%) | 0 (0.0%) |
Fertility by Education in Mountain Lake
| Educational Attainment | Women with Births | Births / 1,000 Women |
| Less than High School | 0 (0.0%) | 0.0 |
| High School Diploma | 0 (0.0%) | 0.0 |
| College or Associate's Degree | 0 (0.0%) | 0.0 |
| Bachelor's Degree | 0 (0.0%) | 0.0 |
| Graduate Degree | 0 (0.0%) | 0.0 |
| Total | 0 (0.0%) | 0.0 |
Fertility by Education by Marriage Status in Mountain Lake
| Educational Attainment | Married | Unmarried |
| Less than High School | 0 (0.0%) | 0 (0.0%) |
| High School Diploma | 0 (0.0%) | 0 (0.0%) |
| College or Associate's Degree | 0 (0.0%) | 0 (0.0%) |
| Bachelor's Degree | 0 (0.0%) | 0 (0.0%) |
| Graduate Degree | 0 (0.0%) | 0 (0.0%) |
| Total | 0 (0.0%) | 0 (0.0%) |
Employment Characteristics in Mountain Lake
Employment by Class of Employer in Mountain Lake
Among the 393 employed individuals in Mountain Lake, private company employees (283 | 72.0%), local government employees (63 | 16.0%), and not-for-profit organizations (22 | 5.6%) make up the most common classes of employment.
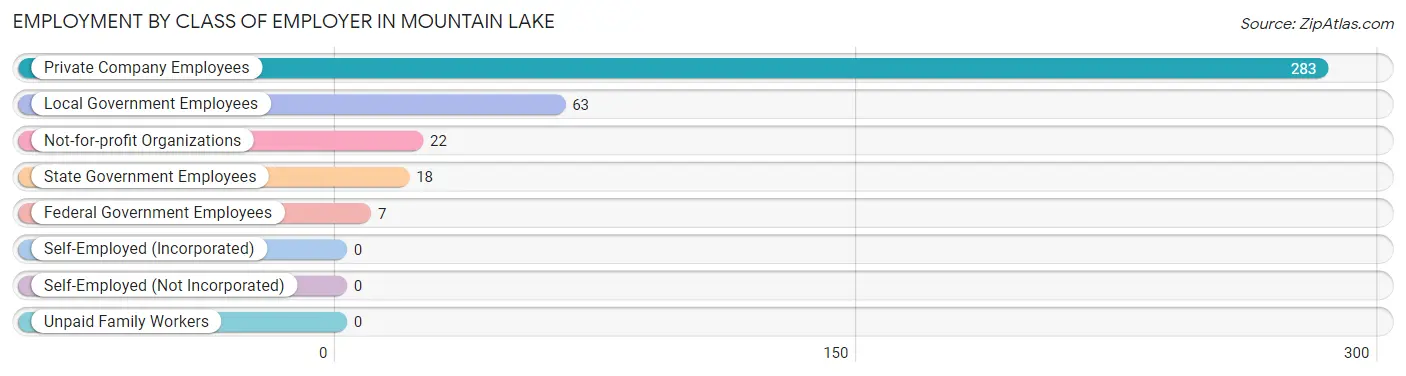
| Employer Class | # Employees | % Employees |
| Private Company Employees | 283 | 72.0% |
| Self-Employed (Incorporated) | 0 | 0.0% |
| Self-Employed (Not Incorporated) | 0 | 0.0% |
| Not-for-profit Organizations | 22 | 5.6% |
| Local Government Employees | 63 | 16.0% |
| State Government Employees | 18 | 4.6% |
| Federal Government Employees | 7 | 1.8% |
| Unpaid Family Workers | 0 | 0.0% |
| Total | 393 | 100.0% |
Employment Status by Age in Mountain Lake
According to the labor force statistics for Mountain Lake, out of the total population over 16 years of age (511), 79.6% or 407 individuals are in the labor force, with 1.5% or 6 of them unemployed. The age group with the highest labor force participation rate is 20 to 24 years, with 100.0% or 33 individuals in the labor force. Within the labor force, the 25 to 29 years age range has the highest percentage of unemployed individuals, with 7.7% or 3 of them being unemployed.
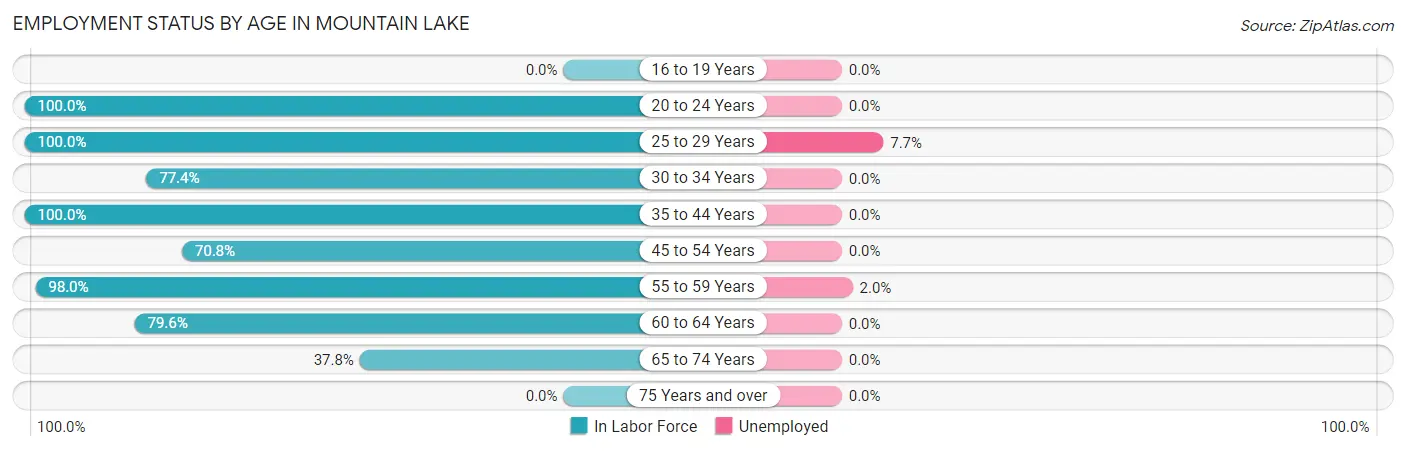
| Age Bracket | In Labor Force | Unemployed |
| 16 to 19 Years | 0 (0.0%) | 0 (0.0%) |
| 20 to 24 Years | 33 (100.0%) | 0 (0.0%) |
| 25 to 29 Years | 39 (100.0%) | 3 (7.7%) |
| 30 to 34 Years | 24 (77.4%) | 0 (0.0%) |
| 35 to 44 Years | 23 (100.0%) | 0 (0.0%) |
| 45 to 54 Years | 68 (70.8%) | 0 (0.0%) |
| 55 to 59 Years | 147 (98.0%) | 3 (2.0%) |
| 60 to 64 Years | 39 (79.6%) | 0 (0.0%) |
| 65 to 74 Years | 34 (37.8%) | 0 (0.0%) |
| 75 Years and over | 0 (0.0%) | 0 (0.0%) |
| Total | 407 (79.6%) | 6 (1.5%) |
Employment Status by Educational Attainment in Mountain Lake
According to labor force statistics for Mountain Lake, 87.6% of individuals (340) out of the total population between 25 and 64 years of age (388) are in the labor force, with 1.8% or 6 of them being unemployed. The group with the highest labor force participation rate are those with the educational attainment of less than high school, with 100.0% or 31 individuals in the labor force. Within the labor force, individuals with bachelor's degree or higher education have the highest percentage of unemployment, with 7.6% or 6 of them being unemployed.
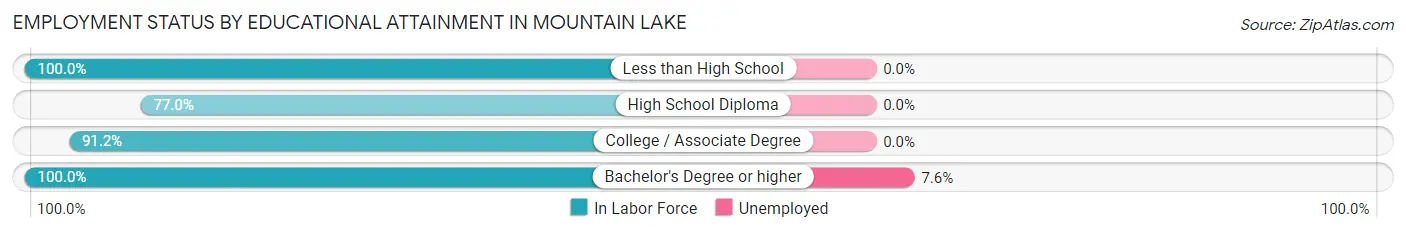
| Educational Attainment | In Labor Force | Unemployed |
| Less than High School | 31 (100.0%) | 0 (0.0%) |
| High School Diploma | 127 (77.0%) | 0 (0.0%) |
| College / Associate Degree | 103 (91.2%) | 0 (0.0%) |
| Bachelor's Degree or higher | 79 (100.0%) | 6 (7.6%) |
| Total | 340 (87.6%) | 7 (1.8%) |
Employment Occupations by Sex in Mountain Lake
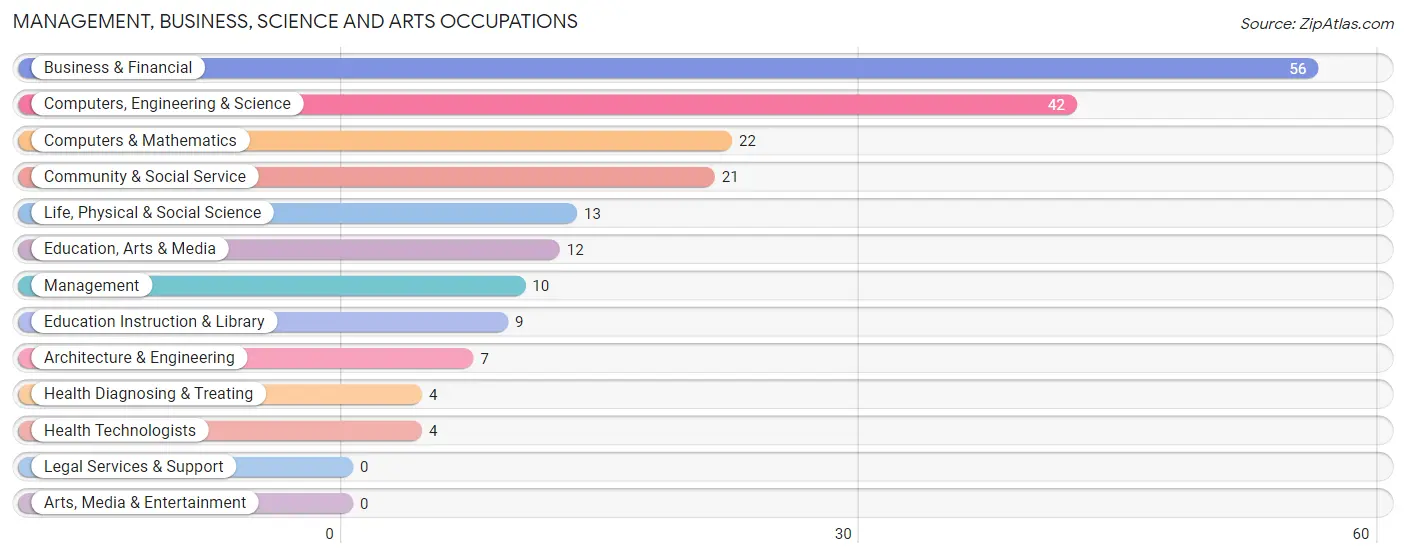
Management, Business, Science and Arts Occupations
The most common Management, Business, Science and Arts occupations in Mountain Lake are Business & Financial (56 | 14.0%), Computers, Engineering & Science (42 | 10.5%), Computers & Mathematics (22 | 5.5%), Community & Social Service (21 | 5.2%), and Life, Physical & Social Science (13 | 3.2%).
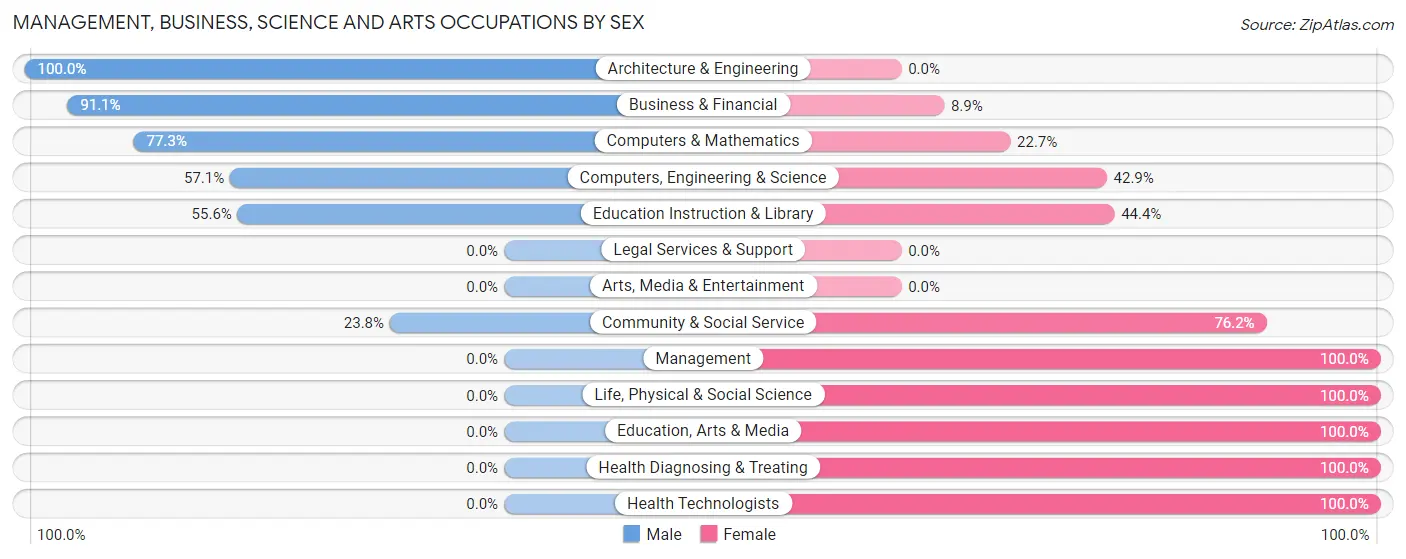
Management, Business, Science and Arts Occupations by Sex
Within the Management, Business, Science and Arts occupations in Mountain Lake, the most male-oriented occupations are Architecture & Engineering (100.0%), Business & Financial (91.1%), and Computers & Mathematics (77.3%), while the most female-oriented occupations are Management (100.0%), Life, Physical & Social Science (100.0%), and Education, Arts & Media (100.0%).
| Occupation | Male | Female |
| Management | 0 (0.0%) | 10 (100.0%) |
| Business & Financial | 51 (91.1%) | 5 (8.9%) |
| Computers, Engineering & Science | 24 (57.1%) | 18 (42.9%) |
| Computers & Mathematics | 17 (77.3%) | 5 (22.7%) |
| Architecture & Engineering | 7 (100.0%) | 0 (0.0%) |
| Life, Physical & Social Science | 0 (0.0%) | 13 (100.0%) |
| Community & Social Service | 5 (23.8%) | 16 (76.2%) |
| Education, Arts & Media | 0 (0.0%) | 12 (100.0%) |
| Legal Services & Support | 0 (0.0%) | 0 (0.0%) |
| Education Instruction & Library | 5 (55.6%) | 4 (44.4%) |
| Arts, Media & Entertainment | 0 (0.0%) | 0 (0.0%) |
| Health Diagnosing & Treating | 0 (0.0%) | 4 (100.0%) |
| Health Technologists | 0 (0.0%) | 4 (100.0%) |
| Total (Category) | 80 (60.2%) | 53 (39.9%) |
| Total (Overall) | 183 (45.6%) | 218 (54.4%) |
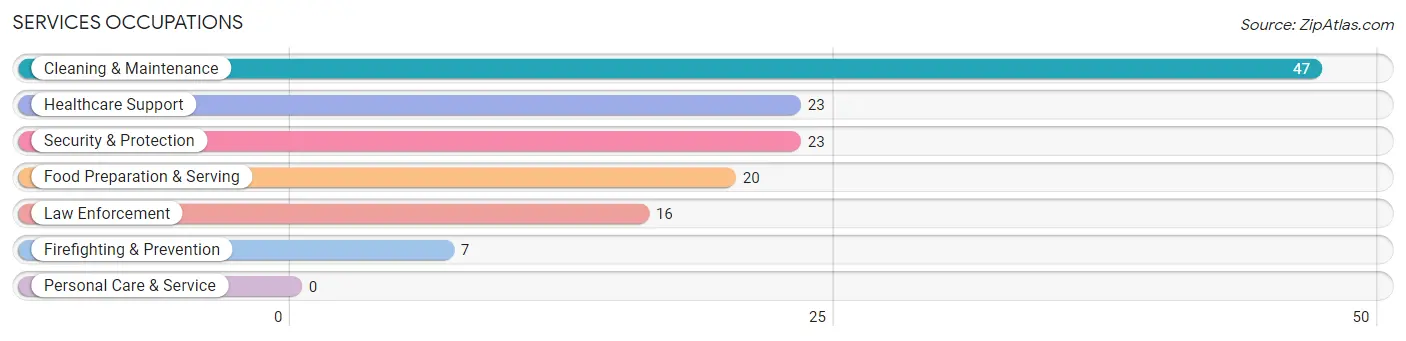
Services Occupations
The most common Services occupations in Mountain Lake are Cleaning & Maintenance (47 | 11.7%), Healthcare Support (23 | 5.7%), Security & Protection (23 | 5.7%), Food Preparation & Serving (20 | 5.0%), and Law Enforcement (16 | 4.0%).
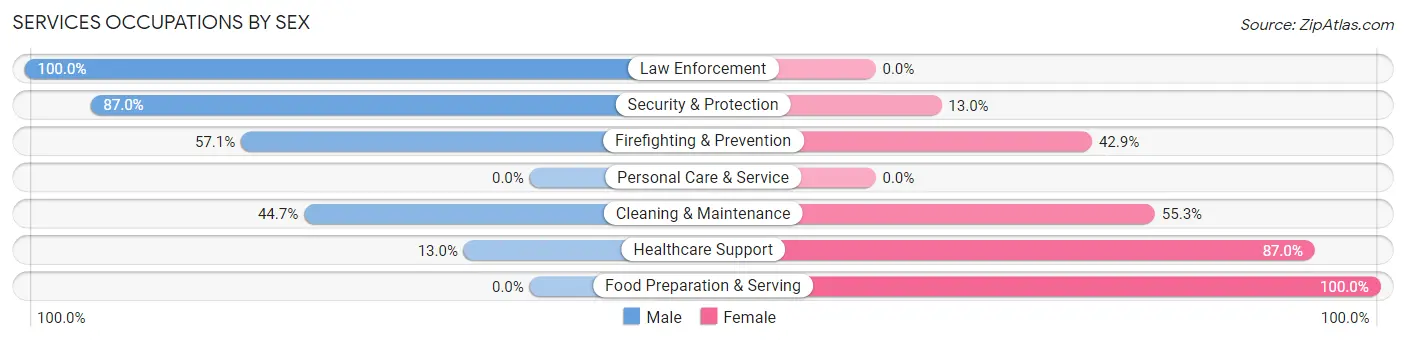
Services Occupations by Sex
Within the Services occupations in Mountain Lake, the most male-oriented occupations are Law Enforcement (100.0%), Security & Protection (87.0%), and Firefighting & Prevention (57.1%), while the most female-oriented occupations are Food Preparation & Serving (100.0%), Healthcare Support (87.0%), and Cleaning & Maintenance (55.3%).
| Occupation | Male | Female |
| Healthcare Support | 3 (13.0%) | 20 (87.0%) |
| Security & Protection | 20 (87.0%) | 3 (13.0%) |
| Firefighting & Prevention | 4 (57.1%) | 3 (42.9%) |
| Law Enforcement | 16 (100.0%) | 0 (0.0%) |
| Food Preparation & Serving | 0 (0.0%) | 20 (100.0%) |
| Cleaning & Maintenance | 21 (44.7%) | 26 (55.3%) |
| Personal Care & Service | 0 (0.0%) | 0 (0.0%) |
| Total (Category) | 44 (38.9%) | 69 (61.1%) |
| Total (Overall) | 183 (45.6%) | 218 (54.4%) |
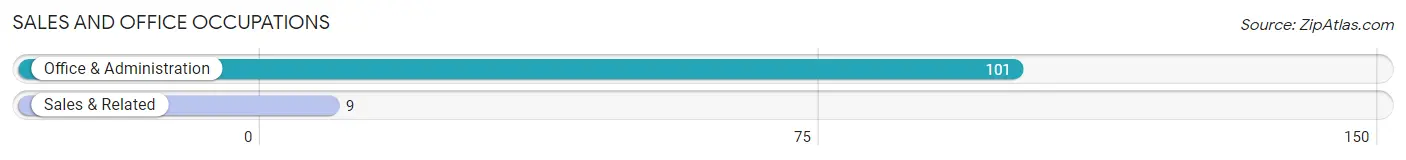
Sales and Office Occupations
The most common Sales and Office occupations in Mountain Lake are Office & Administration (101 | 25.2%), and Sales & Related (9 | 2.2%).
Sales and Office Occupations by Sex
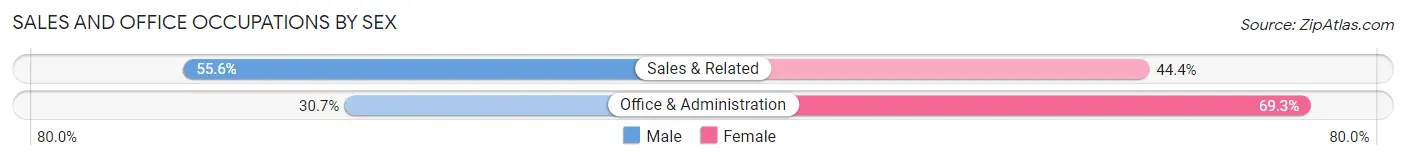
| Occupation | Male | Female |
| Sales & Related | 5 (55.6%) | 4 (44.4%) |
| Office & Administration | 31 (30.7%) | 70 (69.3%) |
| Total (Category) | 36 (32.7%) | 74 (67.3%) |
| Total (Overall) | 183 (45.6%) | 218 (54.4%) |
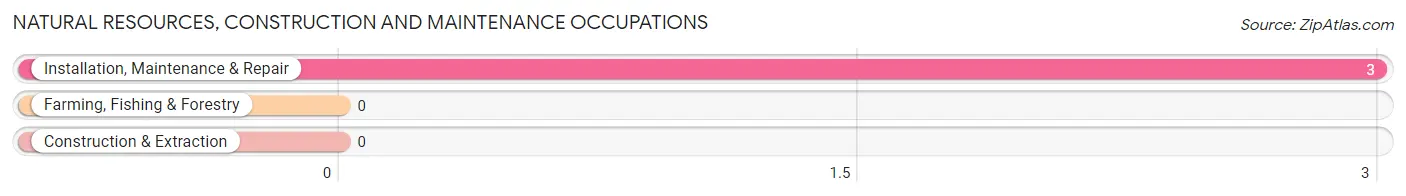
Natural Resources, Construction and Maintenance Occupations
The most common Natural Resources, Construction and Maintenance occupations in Mountain Lake are , and Installation, Maintenance & Repair (3 | 0.7%).
Natural Resources, Construction and Maintenance Occupations by Sex
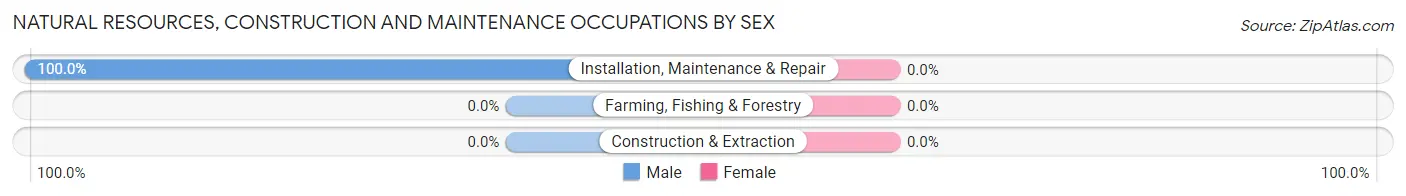
| Occupation | Male | Female |
| Farming, Fishing & Forestry | 0 (0.0%) | 0 (0.0%) |
| Construction & Extraction | 0 (0.0%) | 0 (0.0%) |
| Installation, Maintenance & Repair | 3 (100.0%) | 0 (0.0%) |
| Total (Category) | 3 (100.0%) | 0 (0.0%) |
| Total (Overall) | 183 (45.6%) | 218 (54.4%) |
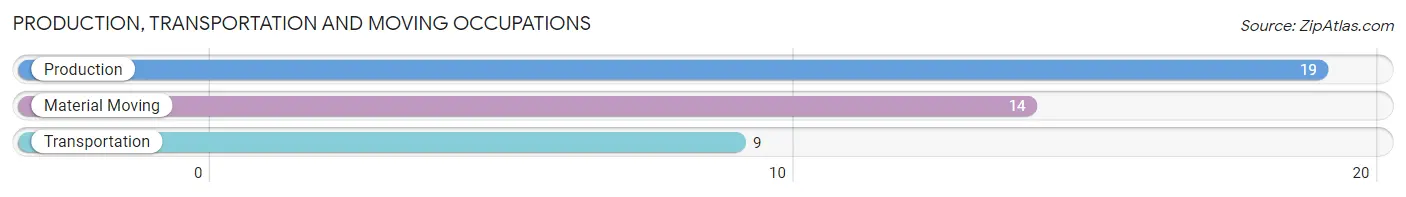
Production, Transportation and Moving Occupations
The most common Production, Transportation and Moving occupations in Mountain Lake are Production (19 | 4.7%), Material Moving (14 | 3.5%), and Transportation (9 | 2.2%).
Production, Transportation and Moving Occupations by Sex
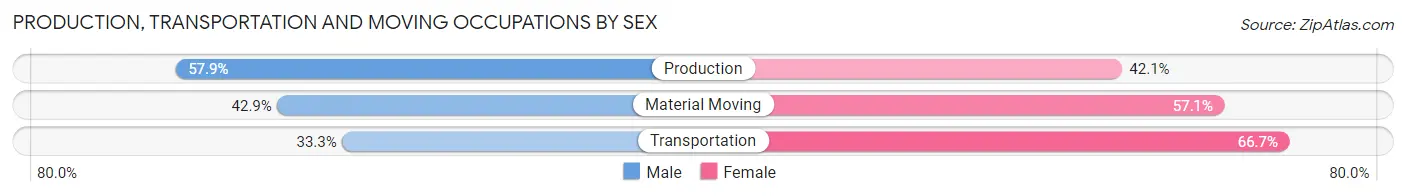
| Occupation | Male | Female |
| Production | 11 (57.9%) | 8 (42.1%) |
| Transportation | 3 (33.3%) | 6 (66.7%) |
| Material Moving | 6 (42.9%) | 8 (57.1%) |
| Total (Category) | 20 (47.6%) | 22 (52.4%) |
| Total (Overall) | 183 (45.6%) | 218 (54.4%) |
Employment Industries by Sex in Mountain Lake
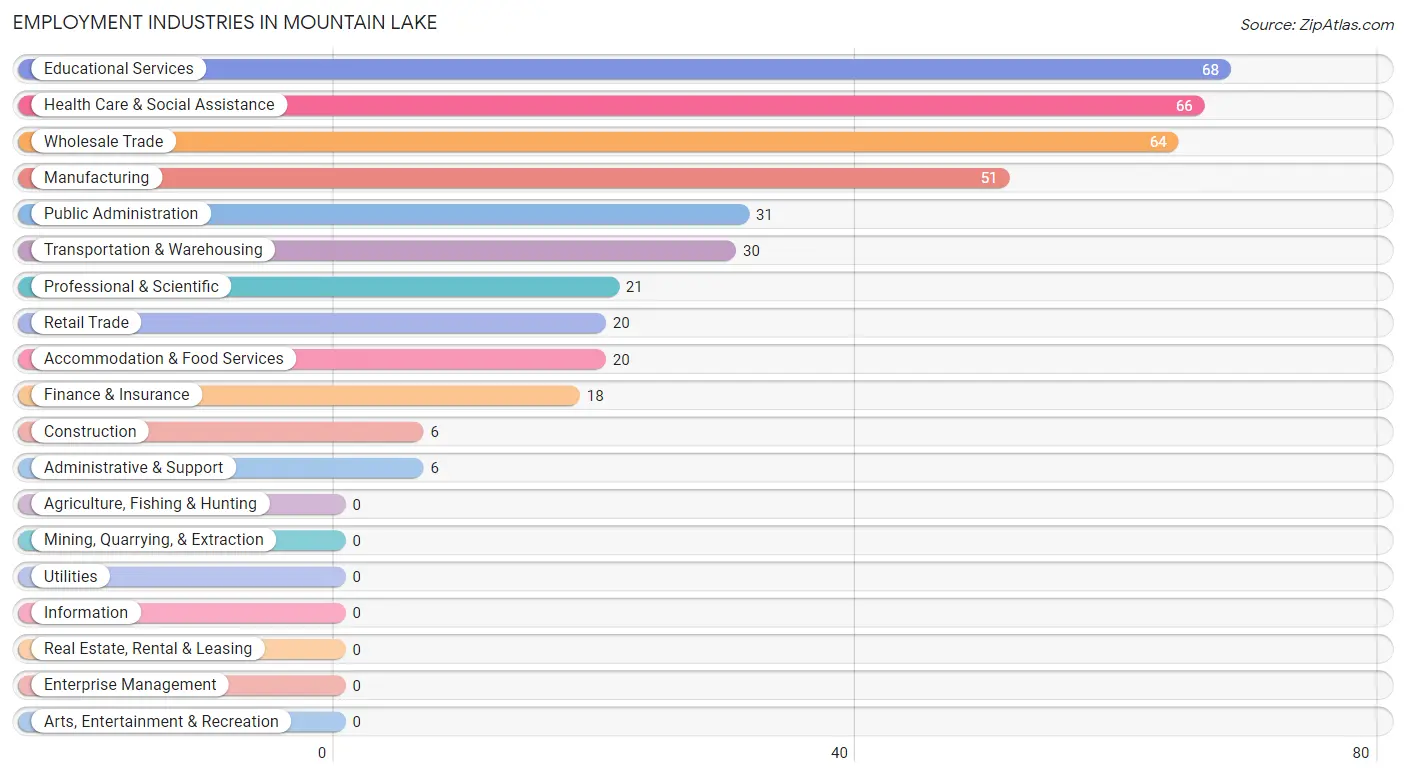
Employment Industries in Mountain Lake
The major employment industries in Mountain Lake include Educational Services (68 | 17.0%), Health Care & Social Assistance (66 | 16.5%), Wholesale Trade (64 | 16.0%), Manufacturing (51 | 12.7%), and Public Administration (31 | 7.7%).
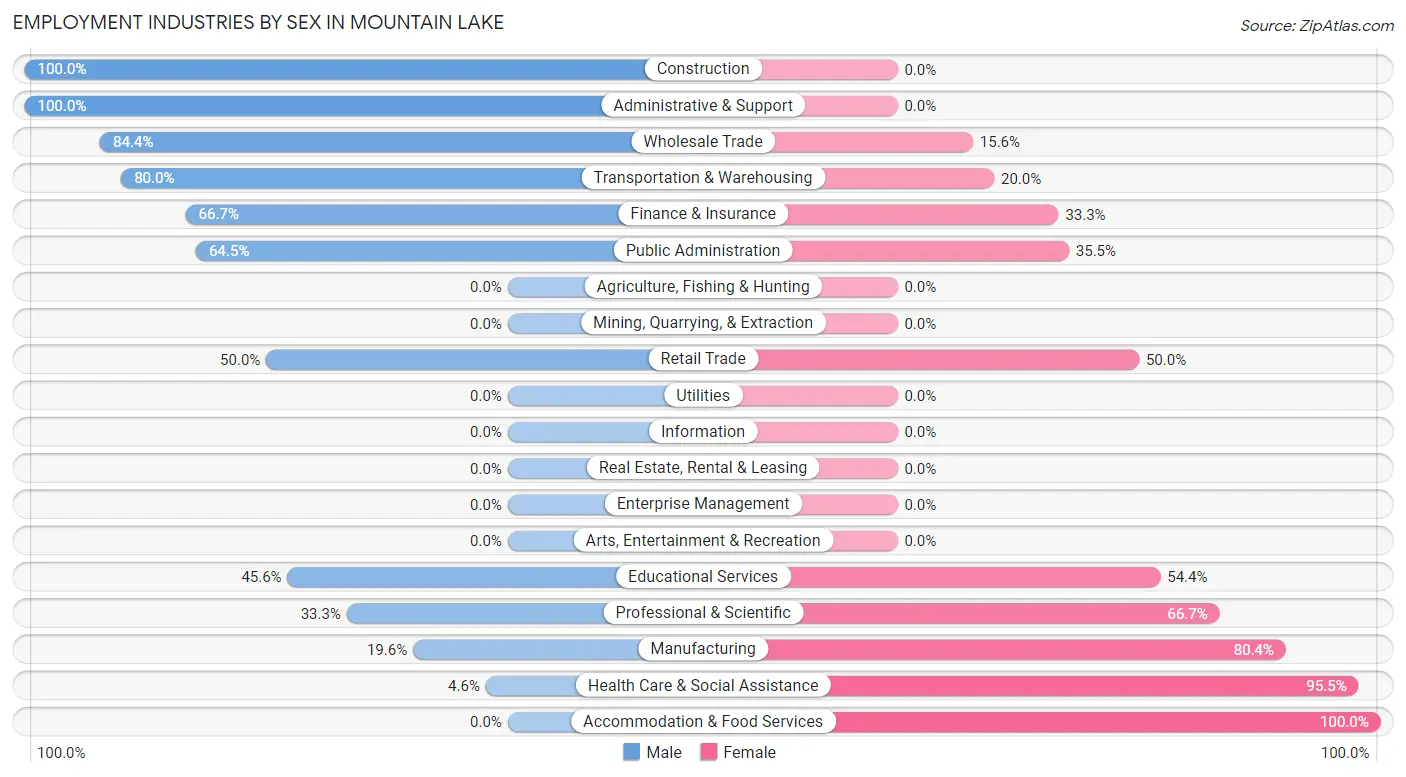
Employment Industries by Sex in Mountain Lake
The Mountain Lake industries that see more men than women are Construction (100.0%), Administrative & Support (100.0%), and Wholesale Trade (84.4%), whereas the industries that tend to have a higher number of women are Accommodation & Food Services (100.0%), Health Care & Social Assistance (95.5%), and Manufacturing (80.4%).
| Industry | Male | Female |
| Agriculture, Fishing & Hunting | 0 (0.0%) | 0 (0.0%) |
| Mining, Quarrying, & Extraction | 0 (0.0%) | 0 (0.0%) |
| Construction | 6 (100.0%) | 0 (0.0%) |
| Manufacturing | 10 (19.6%) | 41 (80.4%) |
| Wholesale Trade | 54 (84.4%) | 10 (15.6%) |
| Retail Trade | 10 (50.0%) | 10 (50.0%) |
| Transportation & Warehousing | 24 (80.0%) | 6 (20.0%) |
| Utilities | 0 (0.0%) | 0 (0.0%) |
| Information | 0 (0.0%) | 0 (0.0%) |
| Finance & Insurance | 12 (66.7%) | 6 (33.3%) |
| Real Estate, Rental & Leasing | 0 (0.0%) | 0 (0.0%) |
| Professional & Scientific | 7 (33.3%) | 14 (66.7%) |
| Enterprise Management | 0 (0.0%) | 0 (0.0%) |
| Administrative & Support | 6 (100.0%) | 0 (0.0%) |
| Educational Services | 31 (45.6%) | 37 (54.4%) |
| Health Care & Social Assistance | 3 (4.5%) | 63 (95.5%) |
| Arts, Entertainment & Recreation | 0 (0.0%) | 0 (0.0%) |
| Accommodation & Food Services | 0 (0.0%) | 20 (100.0%) |
| Public Administration | 20 (64.5%) | 11 (35.5%) |
| Total | 183 (45.6%) | 218 (54.4%) |
Education in Mountain Lake
School Enrollment in Mountain Lake
The most common levels of schooling among the 58 students in Mountain Lake are graduate / professional (23 | 39.7%), middle school (13 | 22.4%), and high school (13 | 22.4%).
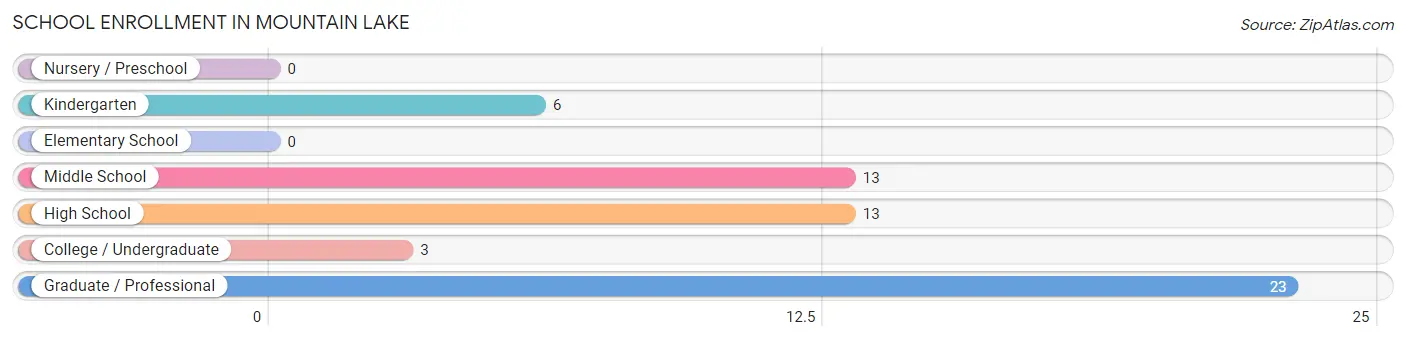
| School Level | # Students | % Students |
| Nursery / Preschool | 0 | 0.0% |
| Kindergarten | 6 | 10.3% |
| Elementary School | 0 | 0.0% |
| Middle School | 13 | 22.4% |
| High School | 13 | 22.4% |
| College / Undergraduate | 3 | 5.2% |
| Graduate / Professional | 23 | 39.7% |
| Total | 58 | 100.0% |
School Enrollment by Age by Funding Source in Mountain Lake
Out of a total of 58 students who are enrolled in schools in Mountain Lake, 6 (10.3%) attend a private institution, while the remaining 52 (89.7%) are enrolled in public schools. The age group of 35 years and over has the highest likelihood of being enrolled in private schools, with 6 (37.5% in the age bracket) enrolled. Conversely, the age group of 5 to 9 year old has the lowest likelihood of being enrolled in a private school, with 6 (100.0% in the age bracket) attending a public institution.
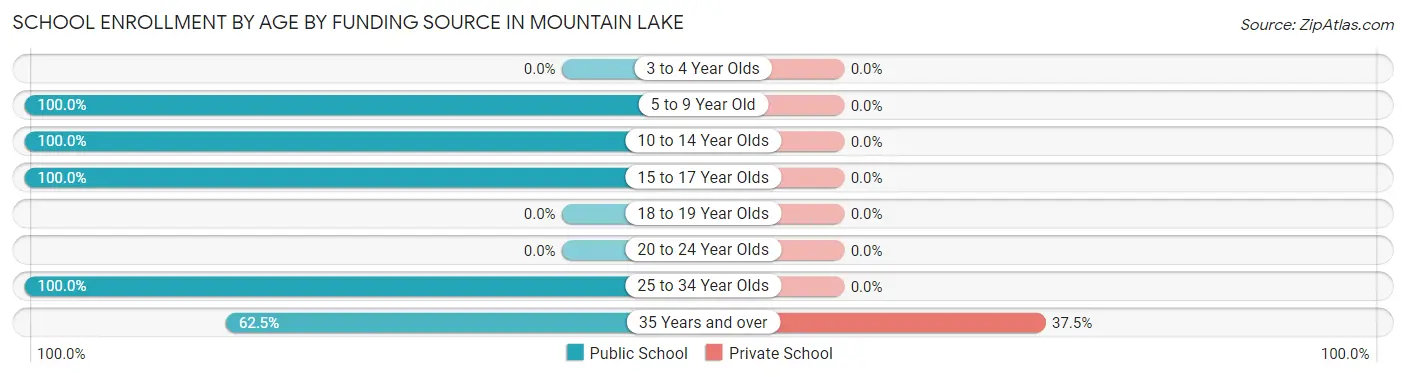
| Age Bracket | Public School | Private School |
| 3 to 4 Year Olds | 0 (0.0%) | 0 (0.0%) |
| 5 to 9 Year Old | 6 (100.0%) | 0 (0.0%) |
| 10 to 14 Year Olds | 13 (100.0%) | 0 (0.0%) |
| 15 to 17 Year Olds | 13 (100.0%) | 0 (0.0%) |
| 18 to 19 Year Olds | 0 (0.0%) | 0 (0.0%) |
| 20 to 24 Year Olds | 0 (0.0%) | 0 (0.0%) |
| 25 to 34 Year Olds | 10 (100.0%) | 0 (0.0%) |
| 35 Years and over | 10 (62.5%) | 6 (37.5%) |
| Total | 52 (89.7%) | 6 (10.3%) |
Educational Attainment by Field of Study in Mountain Lake
Psychology (28 | 22.2%), arts & humanities (24 | 19.1%), business (16 | 12.7%), social sciences (14 | 11.1%), and education (10 | 7.9%) are the most common fields of study among 126 individuals in Mountain Lake who have obtained a bachelor's degree or higher.
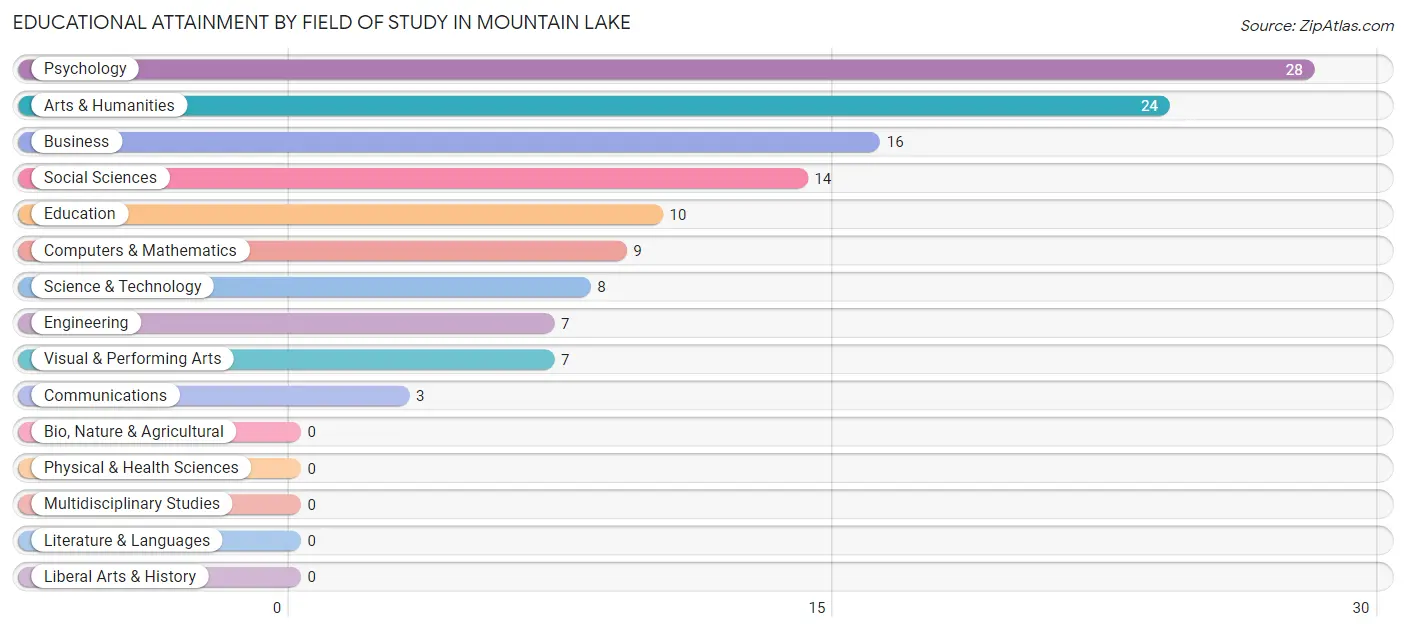
| Field of Study | # Graduates | % Graduates |
| Computers & Mathematics | 9 | 7.1% |
| Bio, Nature & Agricultural | 0 | 0.0% |
| Physical & Health Sciences | 0 | 0.0% |
| Psychology | 28 | 22.2% |
| Social Sciences | 14 | 11.1% |
| Engineering | 7 | 5.6% |
| Multidisciplinary Studies | 0 | 0.0% |
| Science & Technology | 8 | 6.4% |
| Business | 16 | 12.7% |
| Education | 10 | 7.9% |
| Literature & Languages | 0 | 0.0% |
| Liberal Arts & History | 0 | 0.0% |
| Visual & Performing Arts | 7 | 5.6% |
| Communications | 3 | 2.4% |
| Arts & Humanities | 24 | 19.1% |
| Total | 126 | 100.0% |
Transportation & Commute in Mountain Lake
Vehicle Availability by Sex in Mountain Lake
The most prevalent vehicle ownership categories in Mountain Lake are males with 2 vehicles (82, accounting for 44.8%) and females with 2 vehicles (80, making up 39.1%).
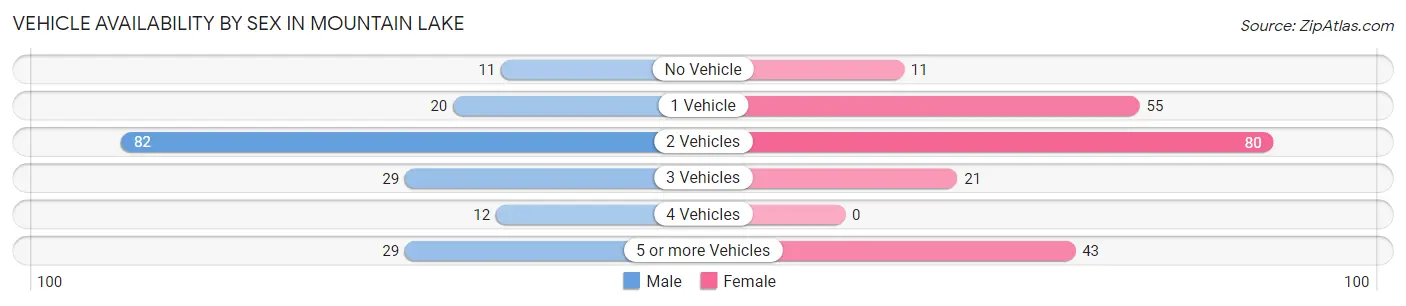
| Vehicles Available | Male | Female |
| No Vehicle | 11 (6.0%) | 11 (5.2%) |
| 1 Vehicle | 20 (10.9%) | 55 (26.2%) |
| 2 Vehicles | 82 (44.8%) | 80 (38.1%) |
| 3 Vehicles | 29 (15.9%) | 21 (10.0%) |
| 4 Vehicles | 12 (6.6%) | 0 (0.0%) |
| 5 or more Vehicles | 29 (15.9%) | 43 (20.5%) |
| Total | 183 (100.0%) | 210 (100.0%) |
Commute Time in Mountain Lake
The most frequently occuring commute durations in Mountain Lake are 45 to 59 minutes (91 commuters, 24.5%), 20 to 24 minutes (77 commuters, 20.7%), and 10 to 14 minutes (76 commuters, 20.4%).
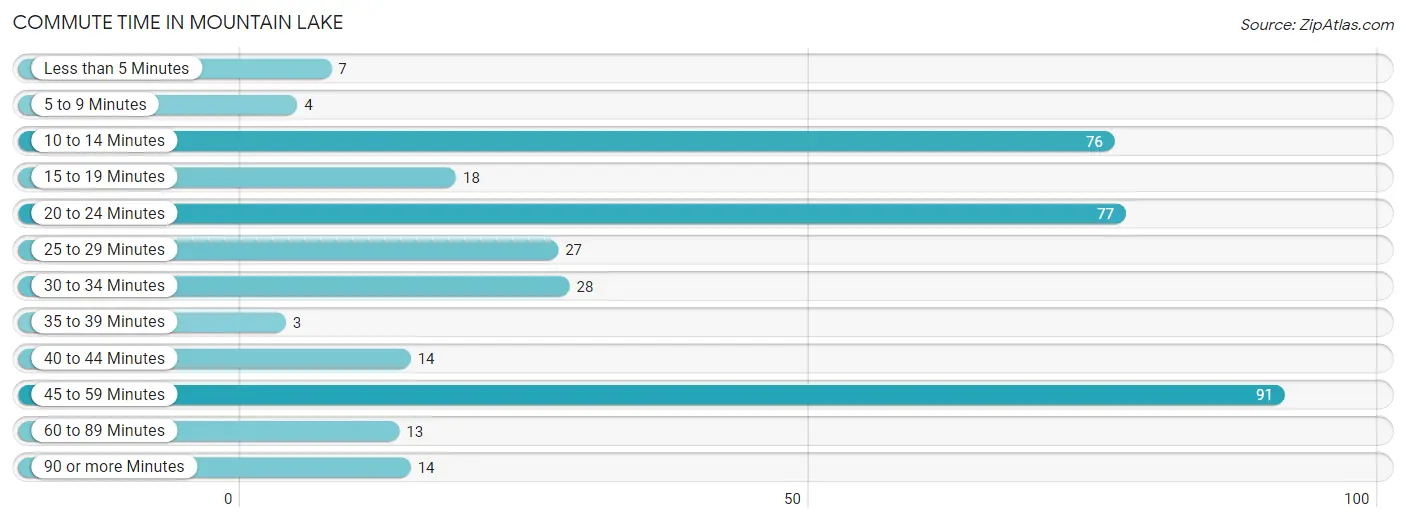
| Commute Time | # Commuters | % Commuters |
| Less than 5 Minutes | 7 | 1.9% |
| 5 to 9 Minutes | 4 | 1.1% |
| 10 to 14 Minutes | 76 | 20.4% |
| 15 to 19 Minutes | 18 | 4.8% |
| 20 to 24 Minutes | 77 | 20.7% |
| 25 to 29 Minutes | 27 | 7.3% |
| 30 to 34 Minutes | 28 | 7.5% |
| 35 to 39 Minutes | 3 | 0.8% |
| 40 to 44 Minutes | 14 | 3.8% |
| 45 to 59 Minutes | 91 | 24.5% |
| 60 to 89 Minutes | 13 | 3.5% |
| 90 or more Minutes | 14 | 3.8% |
Commute Time by Sex in Mountain Lake
The most common commute times in Mountain Lake are 45 to 59 minutes (66 commuters, 37.1%) for males and 20 to 24 minutes (66 commuters, 34.0%) for females.
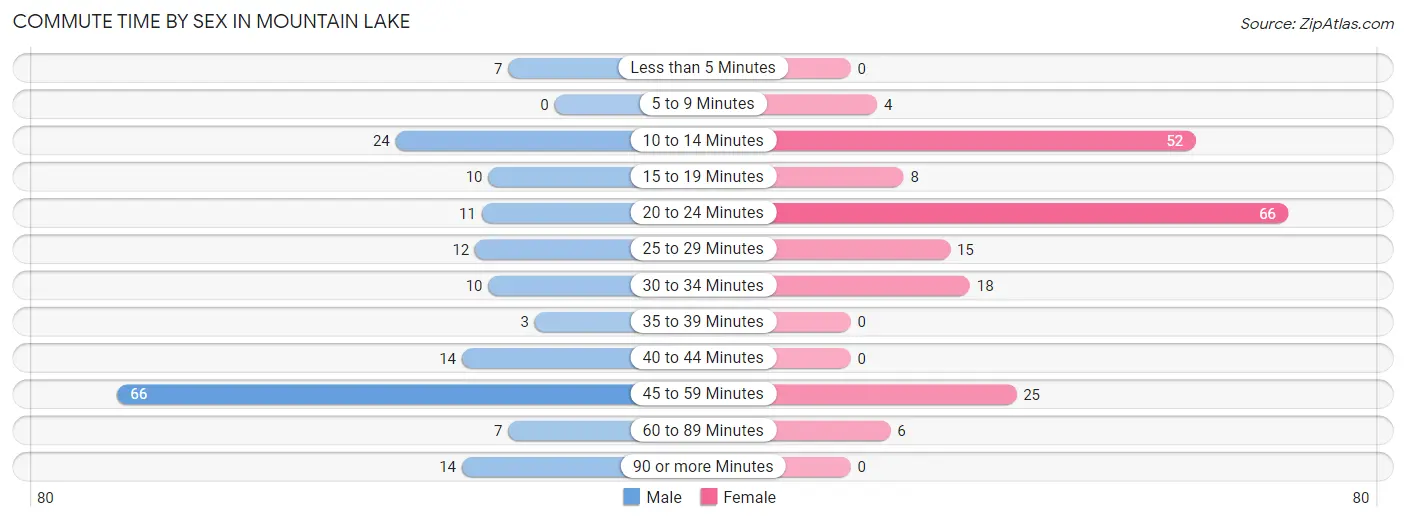
| Commute Time | Male | Female |
| Less than 5 Minutes | 7 (3.9%) | 0 (0.0%) |
| 5 to 9 Minutes | 0 (0.0%) | 4 (2.1%) |
| 10 to 14 Minutes | 24 (13.5%) | 52 (26.8%) |
| 15 to 19 Minutes | 10 (5.6%) | 8 (4.1%) |
| 20 to 24 Minutes | 11 (6.2%) | 66 (34.0%) |
| 25 to 29 Minutes | 12 (6.7%) | 15 (7.7%) |
| 30 to 34 Minutes | 10 (5.6%) | 18 (9.3%) |
| 35 to 39 Minutes | 3 (1.7%) | 0 (0.0%) |
| 40 to 44 Minutes | 14 (7.9%) | 0 (0.0%) |
| 45 to 59 Minutes | 66 (37.1%) | 25 (12.9%) |
| 60 to 89 Minutes | 7 (3.9%) | 6 (3.1%) |
| 90 or more Minutes | 14 (7.9%) | 0 (0.0%) |
Time of Departure to Work by Sex in Mountain Lake
The most frequent times of departure to work in Mountain Lake are 6:00 AM to 6:29 AM (76, 42.7%) for males and 7:30 AM to 7:59 AM (63, 32.5%) for females.
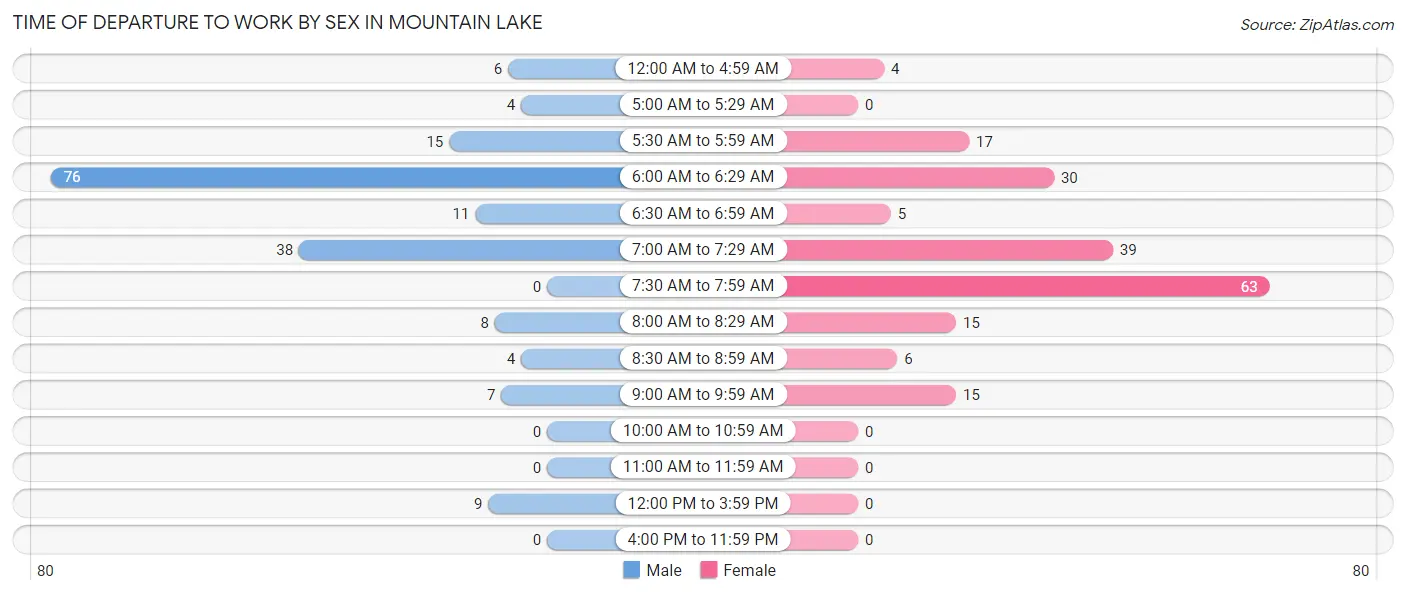
| Time of Departure | Male | Female |
| 12:00 AM to 4:59 AM | 6 (3.4%) | 4 (2.1%) |
| 5:00 AM to 5:29 AM | 4 (2.2%) | 0 (0.0%) |
| 5:30 AM to 5:59 AM | 15 (8.4%) | 17 (8.8%) |
| 6:00 AM to 6:29 AM | 76 (42.7%) | 30 (15.5%) |
| 6:30 AM to 6:59 AM | 11 (6.2%) | 5 (2.6%) |
| 7:00 AM to 7:29 AM | 38 (21.3%) | 39 (20.1%) |
| 7:30 AM to 7:59 AM | 0 (0.0%) | 63 (32.5%) |
| 8:00 AM to 8:29 AM | 8 (4.5%) | 15 (7.7%) |
| 8:30 AM to 8:59 AM | 4 (2.2%) | 6 (3.1%) |
| 9:00 AM to 9:59 AM | 7 (3.9%) | 15 (7.7%) |
| 10:00 AM to 10:59 AM | 0 (0.0%) | 0 (0.0%) |
| 11:00 AM to 11:59 AM | 0 (0.0%) | 0 (0.0%) |
| 12:00 PM to 3:59 PM | 9 (5.1%) | 0 (0.0%) |
| 4:00 PM to 11:59 PM | 0 (0.0%) | 0 (0.0%) |
| Total | 178 (100.0%) | 194 (100.0%) |
Housing Occupancy in Mountain Lake
Occupancy by Ownership in Mountain Lake
Of the total 232 dwellings in Mountain Lake, owner-occupied units account for 191 (82.3%), while renter-occupied units make up 41 (17.7%).
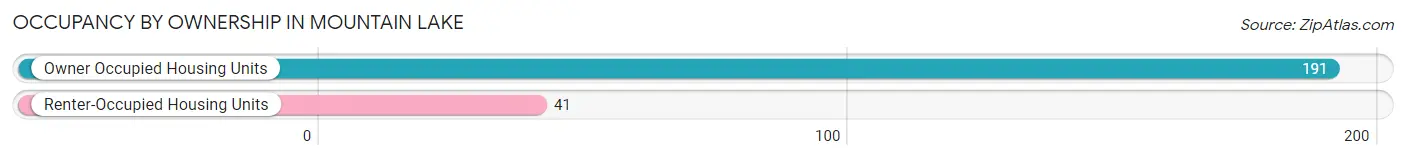
| Occupancy | # Housing Units | % Housing Units |
| Owner Occupied Housing Units | 191 | 82.3% |
| Renter-Occupied Housing Units | 41 | 17.7% |
| Total Occupied Housing Units | 232 | 100.0% |
Occupancy by Household Size in Mountain Lake
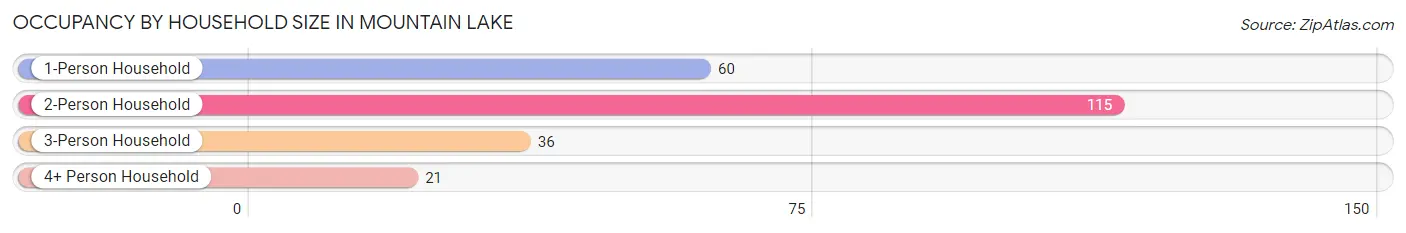
| Household Size | # Housing Units | % Housing Units |
| 1-Person Household | 60 | 25.9% |
| 2-Person Household | 115 | 49.6% |
| 3-Person Household | 36 | 15.5% |
| 4+ Person Household | 21 | 9.0% |
| Total Housing Units | 232 | 100.0% |
Occupancy by Ownership by Household Size in Mountain Lake
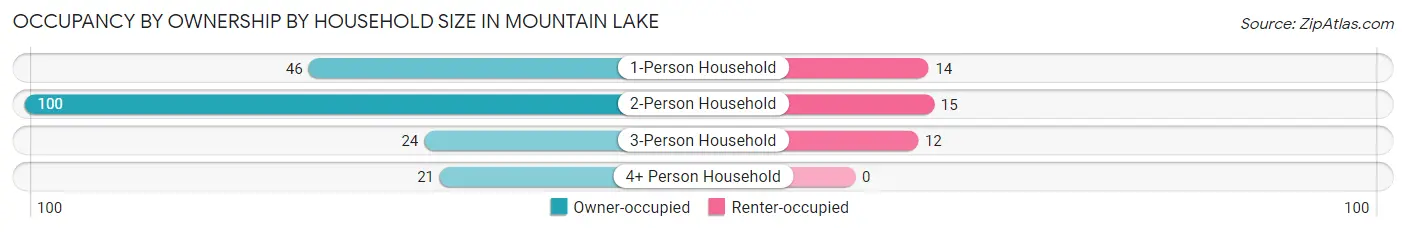
| Household Size | Owner-occupied | Renter-occupied |
| 1-Person Household | 46 (76.7%) | 14 (23.3%) |
| 2-Person Household | 100 (87.0%) | 15 (13.0%) |
| 3-Person Household | 24 (66.7%) | 12 (33.3%) |
| 4+ Person Household | 21 (100.0%) | 0 (0.0%) |
| Total Housing Units | 191 (82.3%) | 41 (17.7%) |
Occupancy by Educational Attainment in Mountain Lake
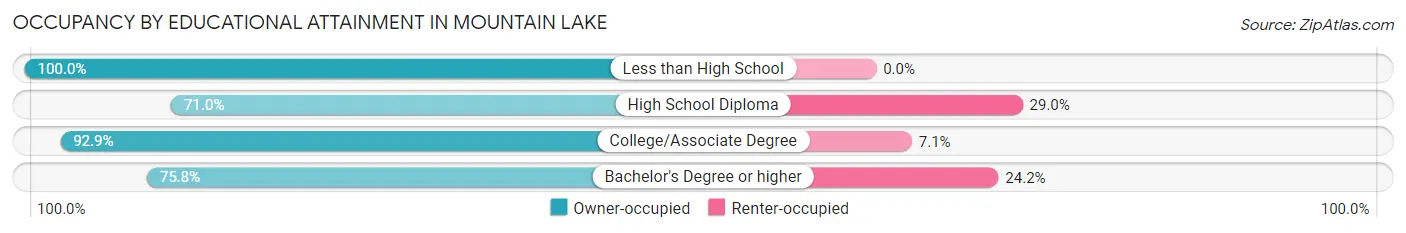
| Household Size | Owner-occupied | Renter-occupied |
| Less than High School | 5 (100.0%) | 0 (0.0%) |
| High School Diploma | 44 (71.0%) | 18 (29.0%) |
| College/Associate Degree | 92 (92.9%) | 7 (7.1%) |
| Bachelor's Degree or higher | 50 (75.8%) | 16 (24.2%) |
Occupancy by Age of Householder in Mountain Lake
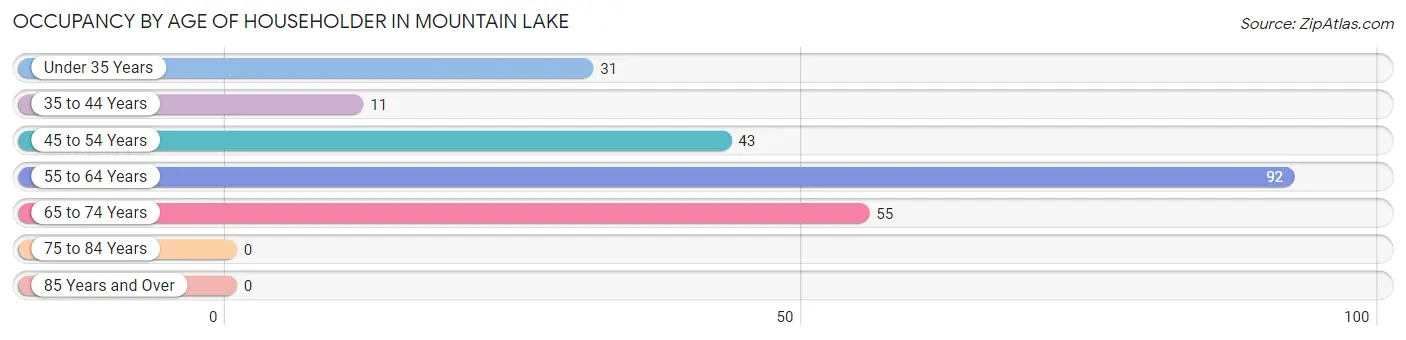
| Age Bracket | # Households | % Households |
| Under 35 Years | 31 | 13.4% |
| 35 to 44 Years | 11 | 4.7% |
| 45 to 54 Years | 43 | 18.5% |
| 55 to 64 Years | 92 | 39.7% |
| 65 to 74 Years | 55 | 23.7% |
| 75 to 84 Years | 0 | 0.0% |
| 85 Years and Over | 0 | 0.0% |
| Total | 232 | 100.0% |
Housing Finances in Mountain Lake
Median Income by Occupancy in Mountain Lake
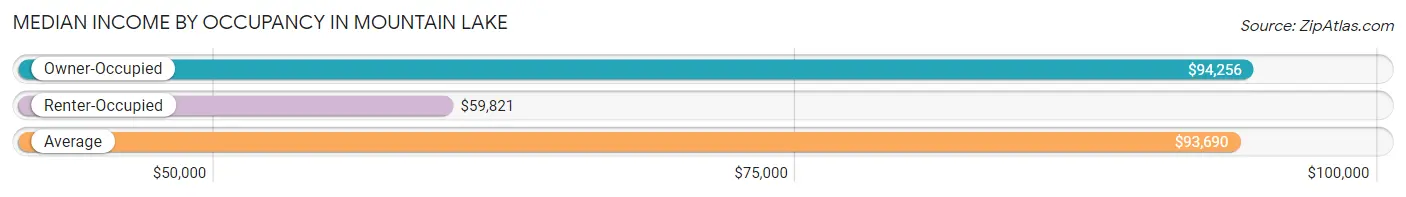
| Occupancy Type | # Households | Median Income |
| Owner-Occupied | 191 (82.3%) | $94,256 |
| Renter-Occupied | 41 (17.7%) | $59,821 |
| Average | 232 (100.0%) | $93,690 |
Occupancy by Householder Income Bracket in Mountain Lake
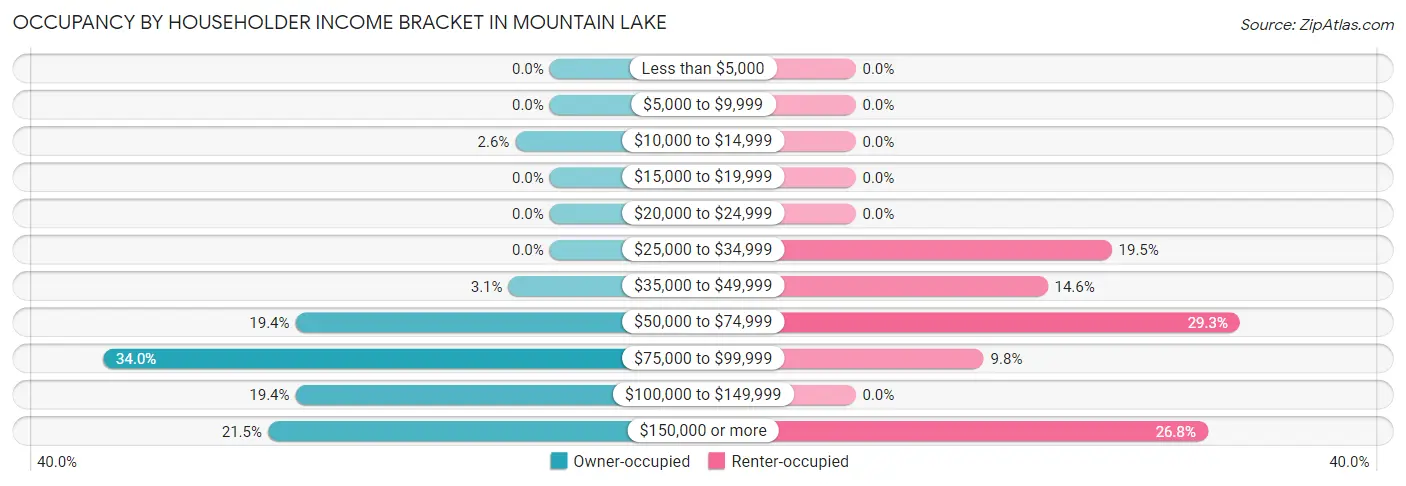
| Income Bracket | Owner-occupied | Renter-occupied |
| Less than $5,000 | 0 (0.0%) | 0 (0.0%) |
| $5,000 to $9,999 | 0 (0.0%) | 0 (0.0%) |
| $10,000 to $14,999 | 5 (2.6%) | 0 (0.0%) |
| $15,000 to $19,999 | 0 (0.0%) | 0 (0.0%) |
| $20,000 to $24,999 | 0 (0.0%) | 0 (0.0%) |
| $25,000 to $34,999 | 0 (0.0%) | 8 (19.5%) |
| $35,000 to $49,999 | 6 (3.1%) | 6 (14.6%) |
| $50,000 to $74,999 | 37 (19.4%) | 12 (29.3%) |
| $75,000 to $99,999 | 65 (34.0%) | 4 (9.8%) |
| $100,000 to $149,999 | 37 (19.4%) | 0 (0.0%) |
| $150,000 or more | 41 (21.5%) | 11 (26.8%) |
| Total | 191 (100.0%) | 41 (100.0%) |
Monthly Housing Cost Tiers in Mountain Lake
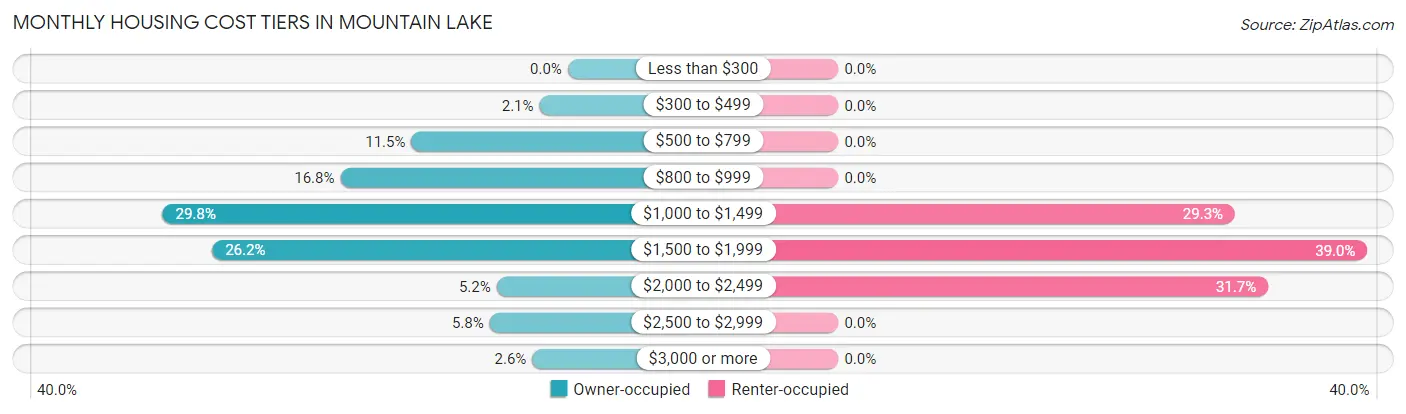
| Monthly Cost | Owner-occupied | Renter-occupied |
| Less than $300 | 0 (0.0%) | 0 (0.0%) |
| $300 to $499 | 4 (2.1%) | 0 (0.0%) |
| $500 to $799 | 22 (11.5%) | 0 (0.0%) |
| $800 to $999 | 32 (16.8%) | 0 (0.0%) |
| $1,000 to $1,499 | 57 (29.8%) | 12 (29.3%) |
| $1,500 to $1,999 | 50 (26.2%) | 16 (39.0%) |
| $2,000 to $2,499 | 10 (5.2%) | 13 (31.7%) |
| $2,500 to $2,999 | 11 (5.8%) | 0 (0.0%) |
| $3,000 or more | 5 (2.6%) | 0 (0.0%) |
| Total | 191 (100.0%) | 41 (100.0%) |
Physical Housing Characteristics in Mountain Lake
Housing Structures in Mountain Lake
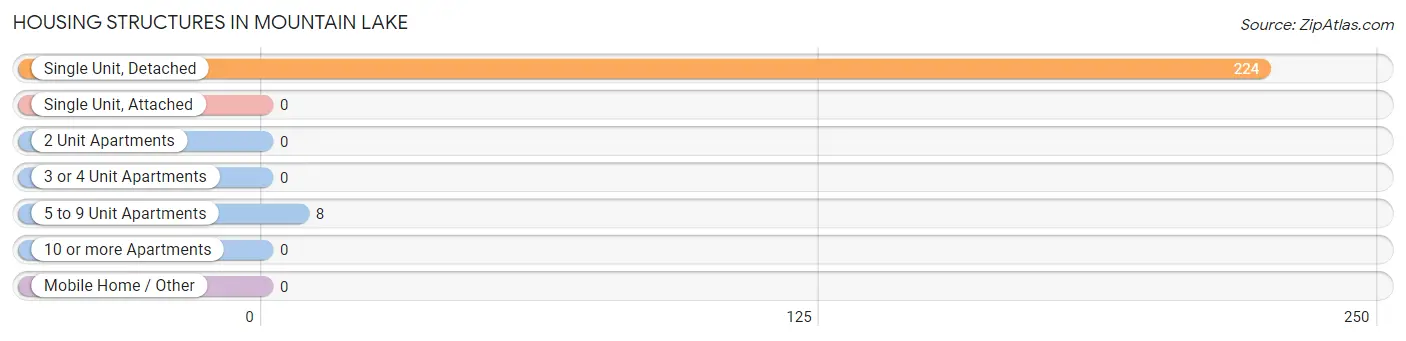
| Structure Type | # Housing Units | % Housing Units |
| Single Unit, Detached | 224 | 96.6% |
| Single Unit, Attached | 0 | 0.0% |
| 2 Unit Apartments | 0 | 0.0% |
| 3 or 4 Unit Apartments | 0 | 0.0% |
| 5 to 9 Unit Apartments | 8 | 3.5% |
| 10 or more Apartments | 0 | 0.0% |
| Mobile Home / Other | 0 | 0.0% |
| Total | 232 | 100.0% |
Housing Structures by Occupancy in Mountain Lake
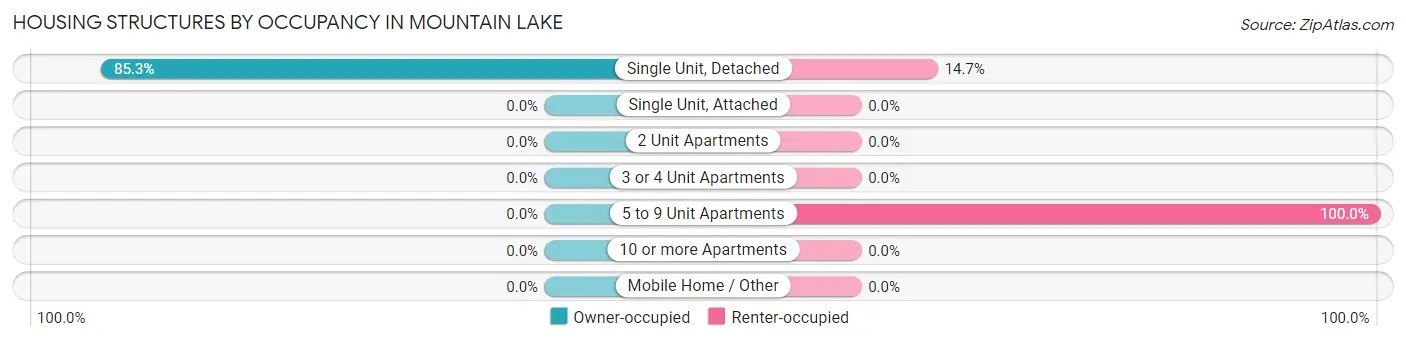
| Structure Type | Owner-occupied | Renter-occupied |
| Single Unit, Detached | 191 (85.3%) | 33 (14.7%) |
| Single Unit, Attached | 0 (0.0%) | 0 (0.0%) |
| 2 Unit Apartments | 0 (0.0%) | 0 (0.0%) |
| 3 or 4 Unit Apartments | 0 (0.0%) | 0 (0.0%) |
| 5 to 9 Unit Apartments | 0 (0.0%) | 8 (100.0%) |
| 10 or more Apartments | 0 (0.0%) | 0 (0.0%) |
| Mobile Home / Other | 0 (0.0%) | 0 (0.0%) |
| Total | 191 (82.3%) | 41 (17.7%) |
Housing Structures by Number of Rooms in Mountain Lake
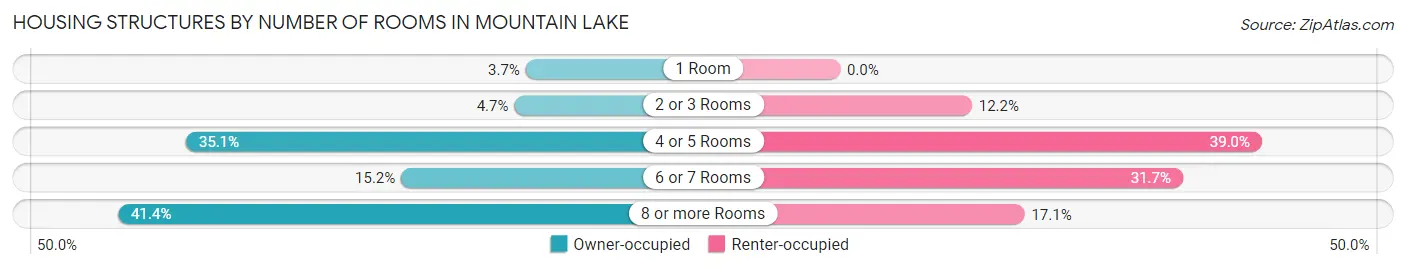
| Number of Rooms | Owner-occupied | Renter-occupied |
| 1 Room | 7 (3.7%) | 0 (0.0%) |
| 2 or 3 Rooms | 9 (4.7%) | 5 (12.2%) |
| 4 or 5 Rooms | 67 (35.1%) | 16 (39.0%) |
| 6 or 7 Rooms | 29 (15.2%) | 13 (31.7%) |
| 8 or more Rooms | 79 (41.4%) | 7 (17.1%) |
| Total | 191 (100.0%) | 41 (100.0%) |
Housing Structure by Heating Type in Mountain Lake
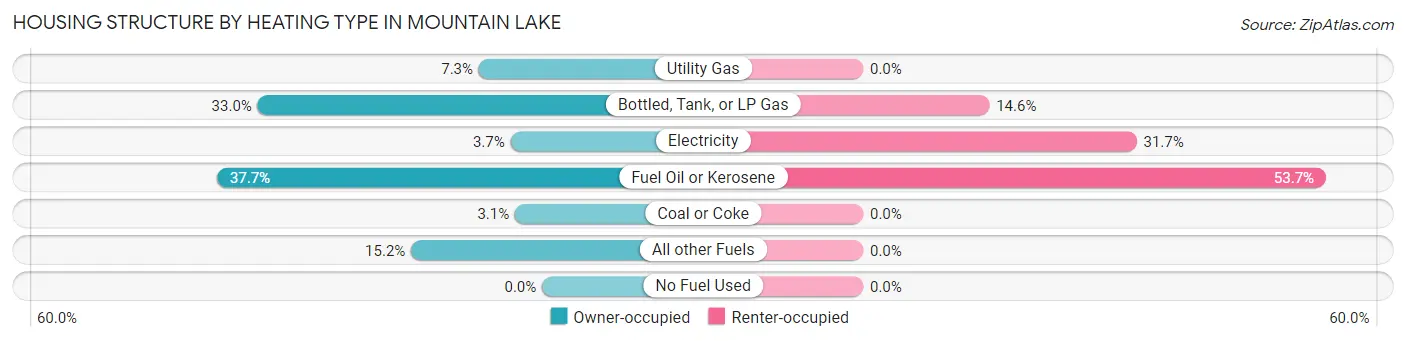
| Heating Type | Owner-occupied | Renter-occupied |
| Utility Gas | 14 (7.3%) | 0 (0.0%) |
| Bottled, Tank, or LP Gas | 63 (33.0%) | 6 (14.6%) |
| Electricity | 7 (3.7%) | 13 (31.7%) |
| Fuel Oil or Kerosene | 72 (37.7%) | 22 (53.7%) |
| Coal or Coke | 6 (3.1%) | 0 (0.0%) |
| All other Fuels | 29 (15.2%) | 0 (0.0%) |
| No Fuel Used | 0 (0.0%) | 0 (0.0%) |
| Total | 191 (100.0%) | 41 (100.0%) |
Household Vehicle Usage in Mountain Lake
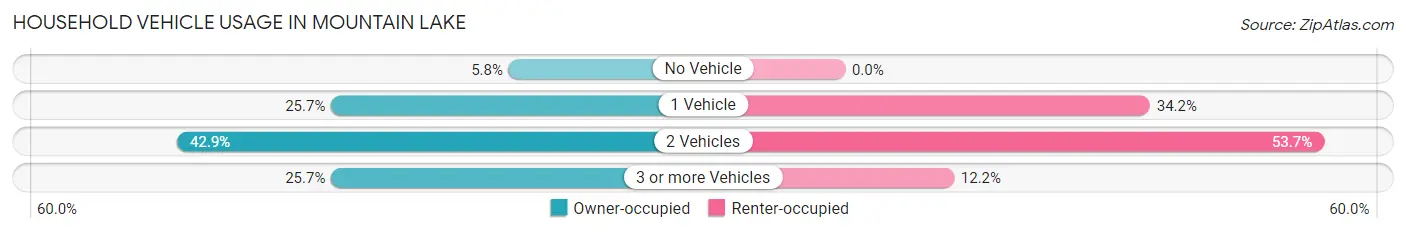
| Vehicles per Household | Owner-occupied | Renter-occupied |
| No Vehicle | 11 (5.8%) | 0 (0.0%) |
| 1 Vehicle | 49 (25.7%) | 14 (34.2%) |
| 2 Vehicles | 82 (42.9%) | 22 (53.7%) |
| 3 or more Vehicles | 49 (25.7%) | 5 (12.2%) |
| Total | 191 (100.0%) | 41 (100.0%) |
Real Estate & Mortgages in Mountain Lake
Real Estate and Mortgage Overview in Mountain Lake
| Characteristic | Without Mortgage | With Mortgage |
| Housing Units | 49 | 142 |
| Median Property Value | $277,100 | $315,500 |
| Median Household Income | $137,813 | $20 |
| Monthly Housing Costs | $789 | $5 |
| Real Estate Taxes | $5,231 | $0 |
Property Value by Mortgage Status in Mountain Lake
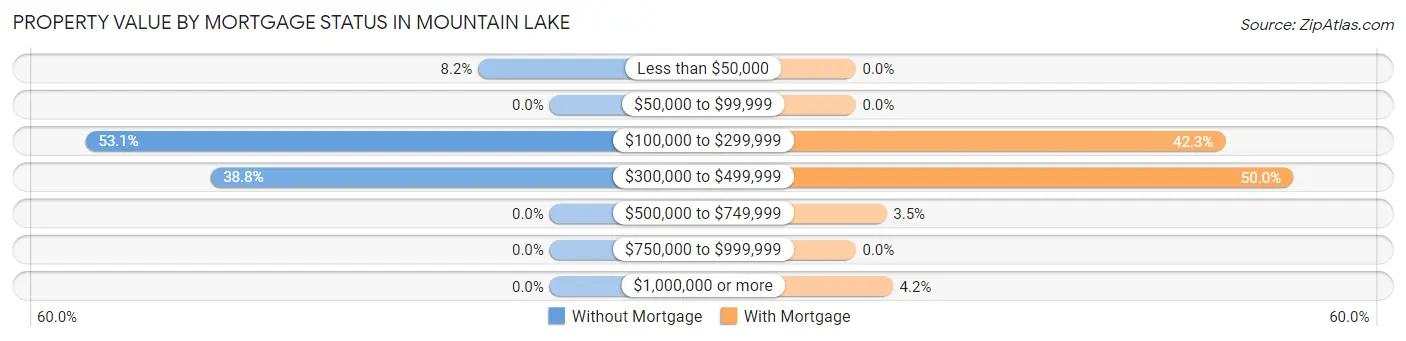
| Property Value | Without Mortgage | With Mortgage |
| Less than $50,000 | 4 (8.2%) | 0 (0.0%) |
| $50,000 to $99,999 | 0 (0.0%) | 0 (0.0%) |
| $100,000 to $299,999 | 26 (53.1%) | 60 (42.2%) |
| $300,000 to $499,999 | 19 (38.8%) | 71 (50.0%) |
| $500,000 to $749,999 | 0 (0.0%) | 5 (3.5%) |
| $750,000 to $999,999 | 0 (0.0%) | 0 (0.0%) |
| $1,000,000 or more | 0 (0.0%) | 6 (4.2%) |
| Total | 49 (100.0%) | 142 (100.0%) |
Household Income by Mortgage Status in Mountain Lake
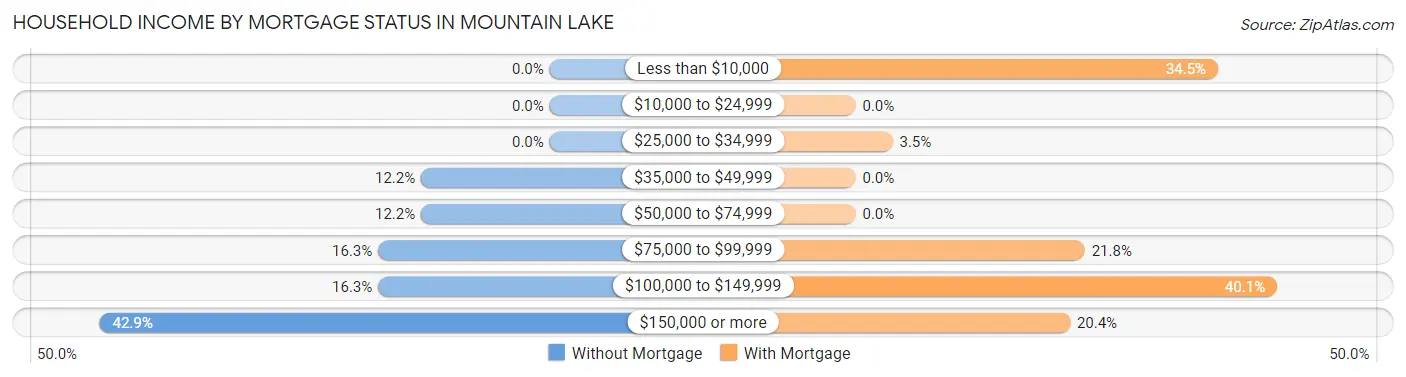
| Household Income | Without Mortgage | With Mortgage |
| Less than $10,000 | 0 (0.0%) | 49 (34.5%) |
| $10,000 to $24,999 | 0 (0.0%) | 0 (0.0%) |
| $25,000 to $34,999 | 0 (0.0%) | 5 (3.5%) |
| $35,000 to $49,999 | 6 (12.2%) | 0 (0.0%) |
| $50,000 to $74,999 | 6 (12.2%) | 0 (0.0%) |
| $75,000 to $99,999 | 8 (16.3%) | 31 (21.8%) |
| $100,000 to $149,999 | 8 (16.3%) | 57 (40.1%) |
| $150,000 or more | 21 (42.9%) | 29 (20.4%) |
| Total | 49 (100.0%) | 142 (100.0%) |
Property Value to Household Income Ratio in Mountain Lake
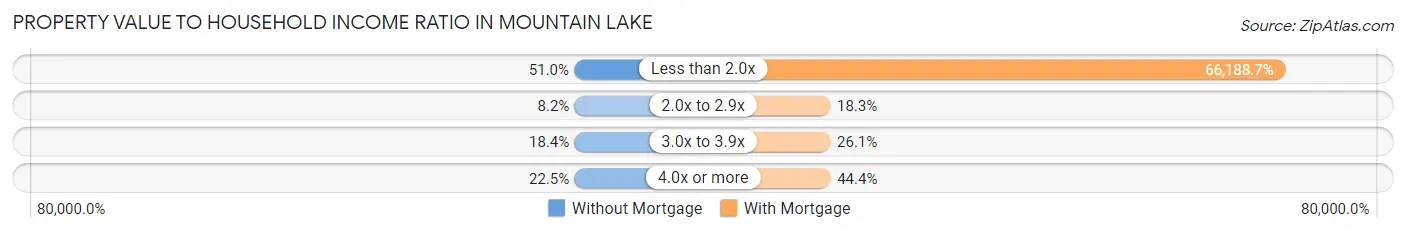
| Value-to-Income Ratio | Without Mortgage | With Mortgage |
| Less than 2.0x | 25 (51.0%) | 93,988 (66,188.7%) |
| 2.0x to 2.9x | 4 (8.2%) | 26 (18.3%) |
| 3.0x to 3.9x | 9 (18.4%) | 37 (26.1%) |
| 4.0x or more | 11 (22.5%) | 63 (44.4%) |
| Total | 49 (100.0%) | 142 (100.0%) |
Real Estate Taxes by Mortgage Status in Mountain Lake
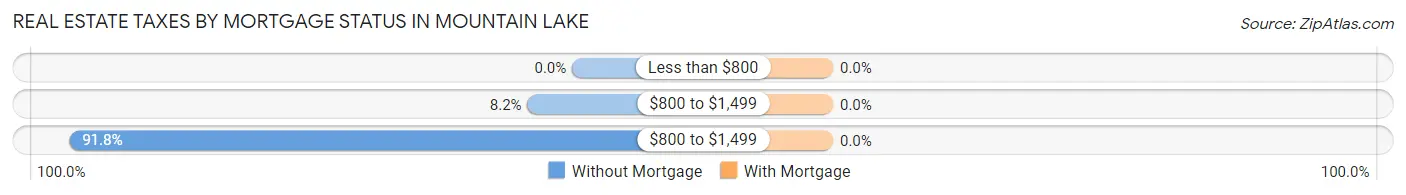
| Property Taxes | Without Mortgage | With Mortgage |
| Less than $800 | 0 (0.0%) | 0 (0.0%) |
| $800 to $1,499 | 4 (8.2%) | 0 (0.0%) |
| $800 to $1,499 | 45 (91.8%) | 0 (0.0%) |
| Total | 49 (100.0%) | 142 (100.0%) |
Health & Disability in Mountain Lake
Health Insurance Coverage by Age in Mountain Lake
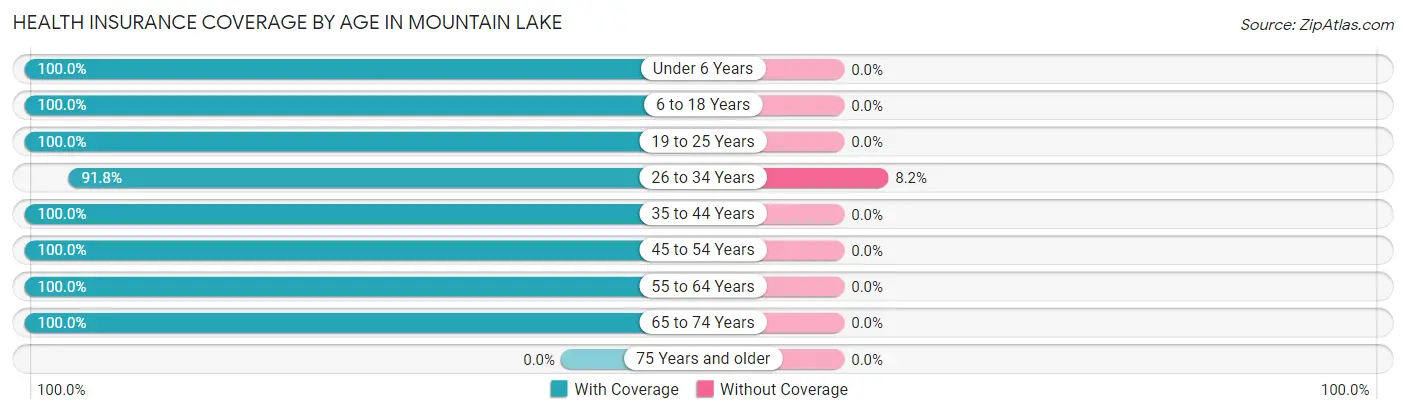
| Age Bracket | With Coverage | Without Coverage |
| Under 6 Years | 6 (100.0%) | 0 (0.0%) |
| 6 to 18 Years | 26 (100.0%) | 0 (0.0%) |
| 19 to 25 Years | 42 (100.0%) | 0 (0.0%) |
| 26 to 34 Years | 56 (91.8%) | 5 (8.2%) |
| 35 to 44 Years | 23 (100.0%) | 0 (0.0%) |
| 45 to 54 Years | 96 (100.0%) | 0 (0.0%) |
| 55 to 64 Years | 199 (100.0%) | 0 (0.0%) |
| 65 to 74 Years | 90 (100.0%) | 0 (0.0%) |
| 75 Years and older | 0 (0.0%) | 0 (0.0%) |
| Total | 538 (99.1%) | 5 (0.9%) |
Health Insurance Coverage by Citizenship Status in Mountain Lake
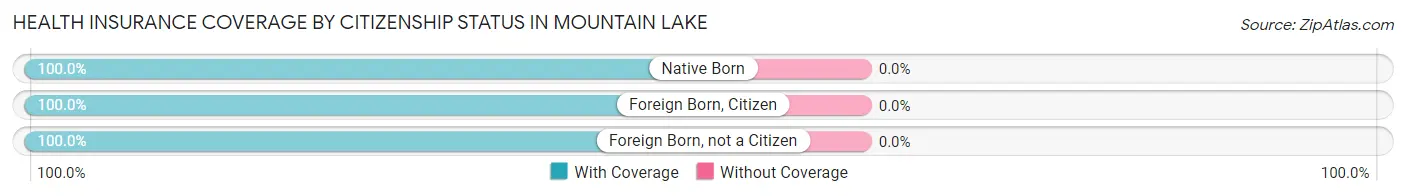
| Citizenship Status | With Coverage | Without Coverage |
| Native Born | 6 (100.0%) | 0 (0.0%) |
| Foreign Born, Citizen | 26 (100.0%) | 0 (0.0%) |
| Foreign Born, not a Citizen | 42 (100.0%) | 0 (0.0%) |
Health Insurance Coverage by Household Income in Mountain Lake
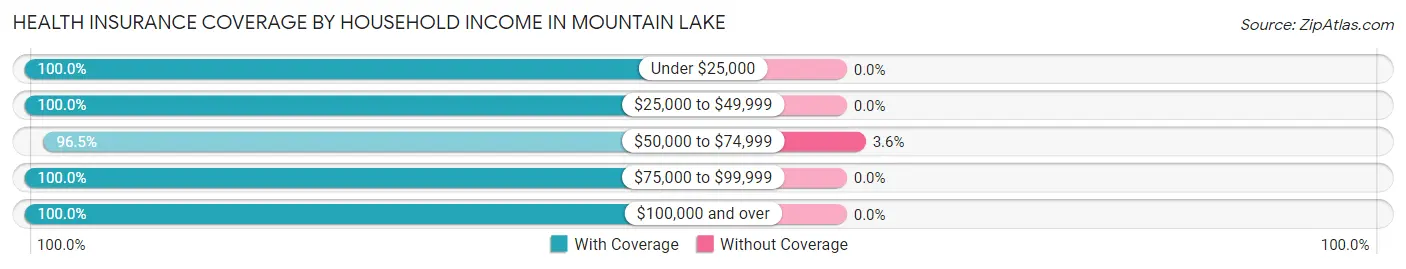
| Household Income | With Coverage | Without Coverage |
| Under $25,000 | 10 (100.0%) | 0 (0.0%) |
| $25,000 to $49,999 | 20 (100.0%) | 0 (0.0%) |
| $50,000 to $74,999 | 136 (96.5%) | 5 (3.5%) |
| $75,000 to $99,999 | 143 (100.0%) | 0 (0.0%) |
| $100,000 and over | 229 (100.0%) | 0 (0.0%) |
Public vs Private Health Insurance Coverage by Age in Mountain Lake
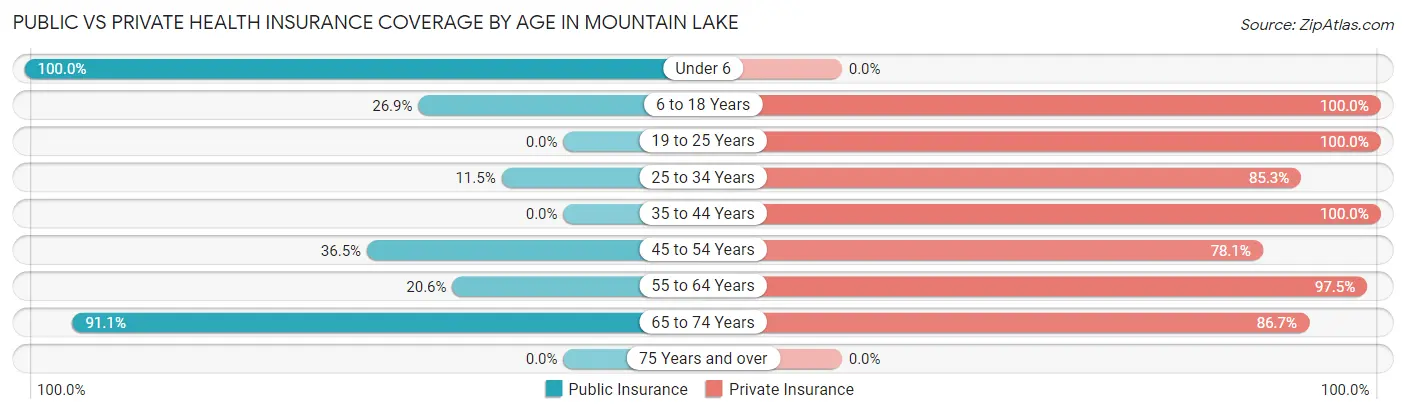
| Age Bracket | Public Insurance | Private Insurance |
| Under 6 | 6 (100.0%) | 0 (0.0%) |
| 6 to 18 Years | 7 (26.9%) | 26 (100.0%) |
| 19 to 25 Years | 0 (0.0%) | 42 (100.0%) |
| 25 to 34 Years | 7 (11.5%) | 52 (85.3%) |
| 35 to 44 Years | 0 (0.0%) | 23 (100.0%) |
| 45 to 54 Years | 35 (36.5%) | 75 (78.1%) |
| 55 to 64 Years | 41 (20.6%) | 194 (97.5%) |
| 65 to 74 Years | 82 (91.1%) | 78 (86.7%) |
| 75 Years and over | 0 (0.0%) | 0 (0.0%) |
| Total | 178 (32.8%) | 490 (90.2%) |
Disability Status by Sex by Age in Mountain Lake
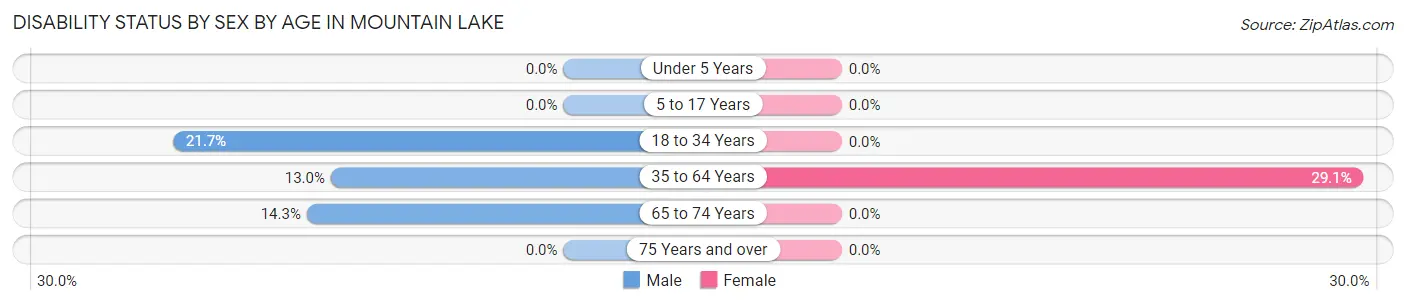
| Age Bracket | Male | Female |
| Under 5 Years | 0 (0.0%) | 0 (0.0%) |
| 5 to 17 Years | 0 (0.0%) | 0 (0.0%) |
| 18 to 34 Years | 10 (21.7%) | 0 (0.0%) |
| 35 to 64 Years | 18 (13.0%) | 52 (29.0%) |
| 65 to 74 Years | 8 (14.3%) | 0 (0.0%) |
| 75 Years and over | 0 (0.0%) | 0 (0.0%) |
Disability Class by Sex by Age in Mountain Lake
Disability Class: Hearing Difficulty
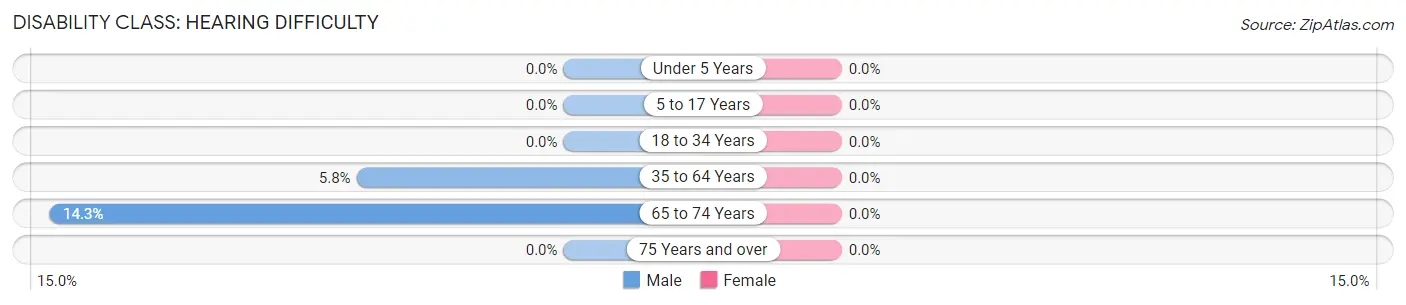
| Age Bracket | Male | Female |
| Under 5 Years | 0 (0.0%) | 0 (0.0%) |
| 5 to 17 Years | 0 (0.0%) | 0 (0.0%) |
| 18 to 34 Years | 0 (0.0%) | 0 (0.0%) |
| 35 to 64 Years | 8 (5.8%) | 0 (0.0%) |
| 65 to 74 Years | 8 (14.3%) | 0 (0.0%) |
| 75 Years and over | 0 (0.0%) | 0 (0.0%) |
Disability Class: Vision Difficulty
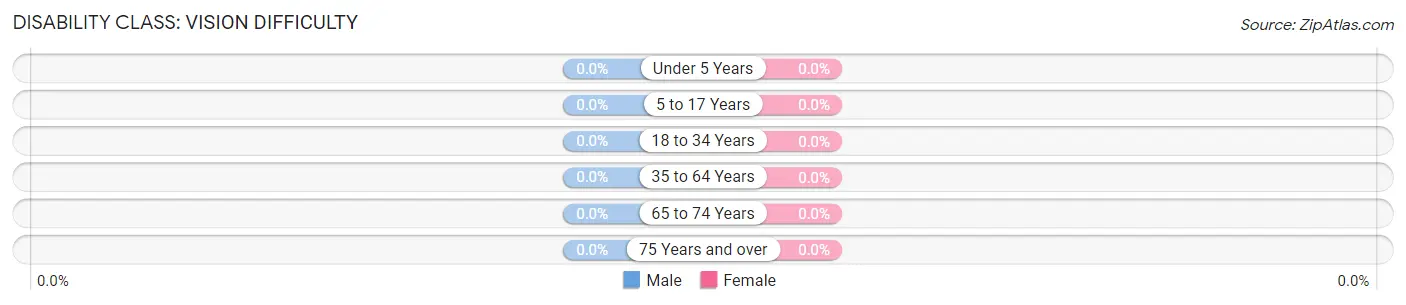
| Age Bracket | Male | Female |
| Under 5 Years | 0 (0.0%) | 0 (0.0%) |
| 5 to 17 Years | 0 (0.0%) | 0 (0.0%) |
| 18 to 34 Years | 0 (0.0%) | 0 (0.0%) |
| 35 to 64 Years | 0 (0.0%) | 0 (0.0%) |
| 65 to 74 Years | 0 (0.0%) | 0 (0.0%) |
| 75 Years and over | 0 (0.0%) | 0 (0.0%) |
Disability Class: Cognitive Difficulty
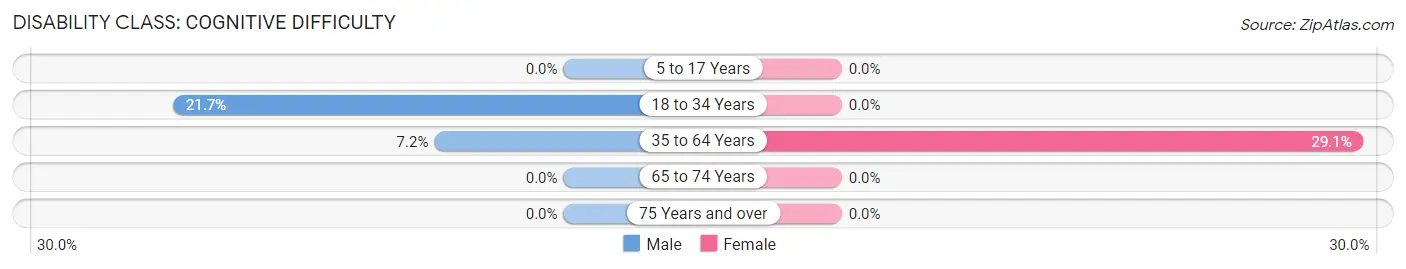
| Age Bracket | Male | Female |
| 5 to 17 Years | 0 (0.0%) | 0 (0.0%) |
| 18 to 34 Years | 10 (21.7%) | 0 (0.0%) |
| 35 to 64 Years | 10 (7.2%) | 52 (29.0%) |
| 65 to 74 Years | 0 (0.0%) | 0 (0.0%) |
| 75 Years and over | 0 (0.0%) | 0 (0.0%) |
Disability Class: Ambulatory Difficulty
| Age Bracket | Male | Female |
| 5 to 17 Years | 0 (0.0%) | 0 (0.0%) |
| 18 to 34 Years | 0 (0.0%) | 0 (0.0%) |
| 35 to 64 Years | 0 (0.0%) | 0 (0.0%) |
| 65 to 74 Years | 0 (0.0%) | 0 (0.0%) |
| 75 Years and over | 0 (0.0%) | 0 (0.0%) |
Disability Class: Self-Care Difficulty
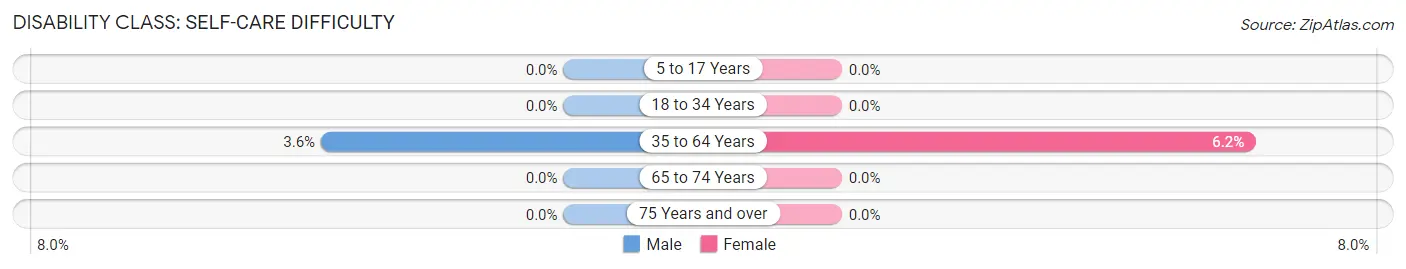
| Age Bracket | Male | Female |
| 5 to 17 Years | 0 (0.0%) | 0 (0.0%) |
| 18 to 34 Years | 0 (0.0%) | 0 (0.0%) |
| 35 to 64 Years | 5 (3.6%) | 11 (6.1%) |
| 65 to 74 Years | 0 (0.0%) | 0 (0.0%) |
| 75 Years and over | 0 (0.0%) | 0 (0.0%) |
Technology Access in Mountain Lake
Computing Device Access in Mountain Lake
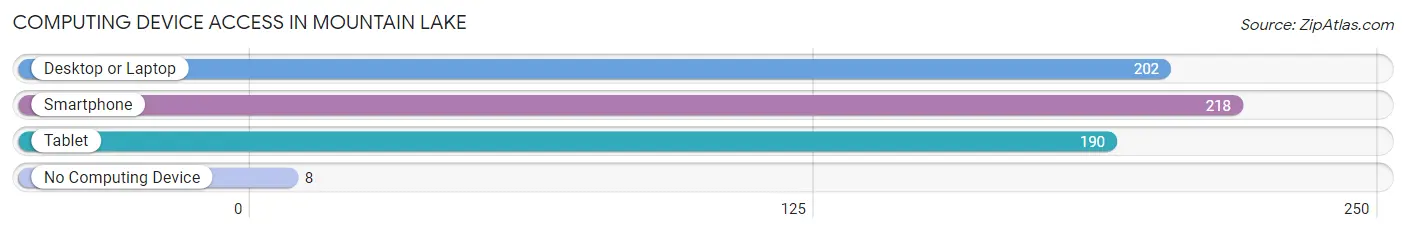
| Device Type | # Households | % Households |
| Desktop or Laptop | 202 | 87.1% |
| Smartphone | 218 | 94.0% |
| Tablet | 190 | 81.9% |
| No Computing Device | 8 | 3.5% |
| Total | 232 | 100.0% |
Internet Access in Mountain Lake
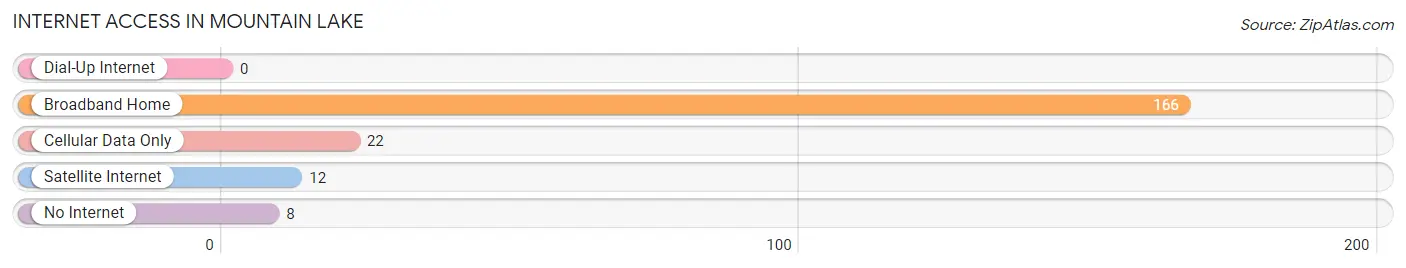
| Internet Type | # Households | % Households |
| Dial-Up Internet | 0 | 0.0% |
| Broadband Home | 166 | 71.6% |
| Cellular Data Only | 22 | 9.5% |
| Satellite Internet | 12 | 5.2% |
| No Internet | 8 | 3.5% |
| Total | 232 | 100.0% |
Mountain Lake Summary
Mountain Lake, NJ is a small borough located in Morris County, New Jersey. It is situated in the northern part of the state, about 25 miles west of New York City. The borough is bordered by the towns of Boonton, Denville, and Parsippany-Troy Hills. The population of Mountain Lake was 2,845 as of the 2010 census.
History
Mountain Lake was originally inhabited by the Lenape Native Americans. The area was first settled by Europeans in the late 17th century. The first settler was a Dutchman named Jan Van Der Veen, who purchased land in the area in 1695. The area was known as Veen’s Mountain until the early 19th century, when it was renamed Mountain Lake.
The borough was officially incorporated in 1894. At the time, the area was mostly rural and agricultural. The main industry was dairy farming, and the area was known for its high-quality milk. In the early 20th century, the area began to develop as a summer resort destination. The Mountain Lake Hotel was built in 1906, and the area became a popular destination for wealthy New Yorkers looking to escape the city.
Geography
Mountain Lake is located at 40°51'N 74°30'W (40.85, -74.50). The borough has a total area of 1.2 square miles, all of which is land. The borough is located in the Highlands region of New Jersey, and is surrounded by hills and mountains. The highest point in the borough is the summit of Bald Mountain, which has an elevation of 1,068 feet.
The borough is located in the watershed of the Rockaway River, which flows through the area. The river is a tributary of the Passaic River, which flows into Newark Bay and then into the Atlantic Ocean.
Economy
Mountain Lake has a small, but diverse economy. The borough is home to a variety of businesses, including retail stores, restaurants, and professional services. The largest employer in the borough is the Mountain Lake Hotel, which employs over 200 people.
The borough also has a thriving tourism industry. The area is a popular destination for outdoor recreation, such as hiking, fishing, and camping. The Mountain Lake Hotel is a popular destination for weddings and other special events.
Demographics
As of the 2010 census, the population of Mountain Lake was 2,845. The racial makeup of the borough was 94.3% White, 1.7% African American, 0.2% Native American, 1.2% Asian, and 2.6% from other races. Hispanic or Latino of any race were 5.2% of the population.
The median household income in the borough was $76,250, and the median family income was $90,000. The per capita income was $35,000. About 4.2% of families and 5.3% of the population were below the poverty line.
Common Questions
What is Per Capita Income in Mountain Lake?
Per Capita income in Mountain Lake is $54,165.
What is the Median Family Income in Mountain Lake?
Median Family Income in Mountain Lake is $94,826.
What is the Median Household income in Mountain Lake?
Median Household Income in Mountain Lake is $93,690.
What is Income or Wage Gap in Mountain Lake?
Income or Wage Gap in Mountain Lake is 40.0%.
Women in Mountain Lake earn 60.0 cents for every dollar earned by a man.
What is Inequality or Gini Index in Mountain Lake?
Inequality or Gini Index in Mountain Lake is 0.34.
What is the Total Population of Mountain Lake?
Total Population of Mountain Lake is 543.
What is the Total Male Population of Mountain Lake?
Total Male Population of Mountain Lake is 253.
What is the Total Female Population of Mountain Lake?
Total Female Population of Mountain Lake is 290.
What is the Ratio of Males per 100 Females in Mountain Lake?
There are 87.24 Males per 100 Females in Mountain Lake.
What is the Ratio of Females per 100 Males in Mountain Lake?
There are 114.62 Females per 100 Males in Mountain Lake.
What is the Median Population Age in Mountain Lake?
Median Population Age in Mountain Lake is 55.6 Years.
What is the Average Family Size in Mountain Lake
Average Family Size in Mountain Lake is 2.7 People.
What is the Average Household Size in Mountain Lake
Average Household Size in Mountain Lake is 2.3 People.
How Large is the Labor Force in Mountain Lake?
There are 407 People in the Labor Forcein in Mountain Lake.
What is the Percentage of People in the Labor Force in Mountain Lake?
79.6% of People are in the Labor Force in Mountain Lake.
What is the Unemployment Rate in Mountain Lake?
Unemployment Rate in Mountain Lake is 1.5%.