Cities with the Highest Unemployment Rate Amomg Seniors Over the Age of 65 in New Jersey
RELATED REPORTS & OPTIONS
Highest Unemployment | Senior > 65
New Jersey
Compare Cities
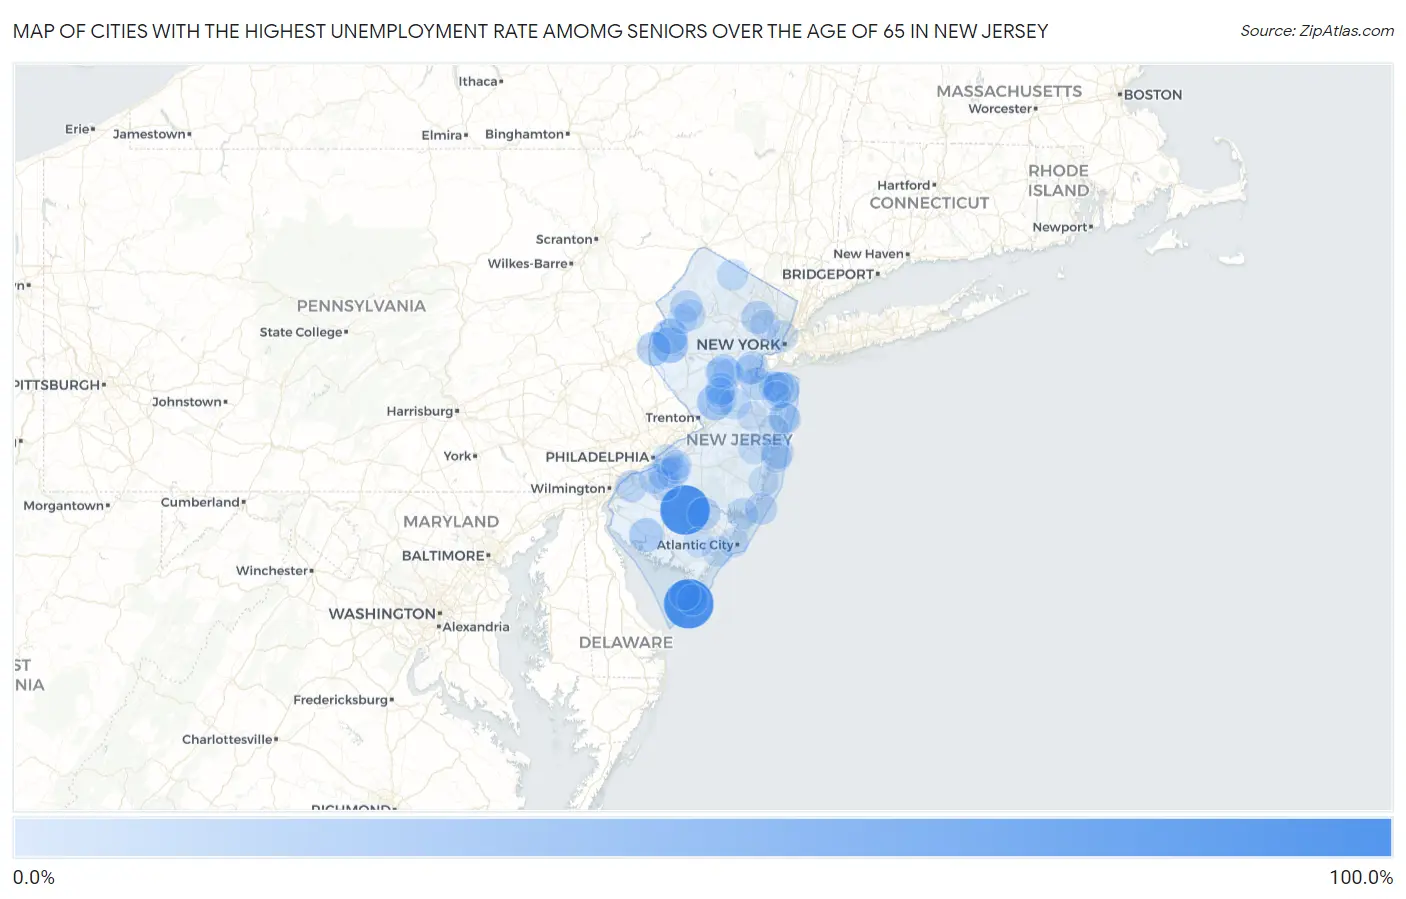
Map of Cities with the Highest Unemployment Rate Amomg Seniors Over the Age of 65 in New Jersey
0.0%
100.0%
Cities with the Highest Unemployment Rate Amomg Seniors Over the Age of 65 in New Jersey
| City | Senior Unemployment | vs State | vs National | |
| 1. | Carlls Corner | 100.0% | 6.0%(+94.0)#1 | 3.9%(+96.1)#30 |
| 2. | Richland | 100.0% | 6.0%(+94.0)#2 | 3.9%(+96.1)#34 |
| 3. | Diamond Beach | 100.0% | 6.0%(+94.0)#3 | 3.9%(+96.1)#48 |
| 4. | Collings Lakes | 99.9% | 6.0%(+93.9)#4 | 3.9%(+96.0)#81 |
| 5. | Newport | 72.5% | 6.0%(+66.5)#5 | 3.9%(+68.6)#164 |
| 6. | Mckee | 56.8% | 6.0%(+50.8)#6 | 3.9%(+52.9)#239 |
| 7. | Wildwood Crest Borough | 38.5% | 6.0%(+32.5)#7 | 3.9%(+34.6)#446 |
| 8. | Asbury | 38.4% | 6.0%(+32.4)#8 | 3.9%(+34.5)#456 |
| 9. | Navesink | 36.7% | 6.0%(+30.7)#9 | 3.9%(+32.8)#481 |
| 10. | Princeton Junction | 36.1% | 6.0%(+30.1)#10 | 3.9%(+32.2)#489 |
| 11. | Brass Castle | 35.4% | 6.0%(+29.4)#11 | 3.9%(+31.5)#507 |
| 12. | Victory Gardens Borough | 34.7% | 6.0%(+28.7)#12 | 3.9%(+30.8)#519 |
| 13. | Carteret Borough | 31.6% | 6.0%(+25.6)#13 | 3.9%(+27.7)#627 |
| 14. | Demarest Borough | 31.2% | 6.0%(+25.2)#14 | 3.9%(+27.3)#640 |
| 15. | Upper Pohatcong | 29.9% | 6.0%(+23.9)#15 | 3.9%(+26.0)#678 |
| 16. | Bridgeton | 29.1% | 6.0%(+23.1)#16 | 3.9%(+25.2)#704 |
| 17. | Brookside | 28.2% | 6.0%(+22.2)#17 | 3.9%(+24.3)#753 |
| 18. | Franklin Center | 27.4% | 6.0%(+21.4)#18 | 3.9%(+23.5)#780 |
| 19. | Union | 25.9% | 6.0%(+19.9)#19 | 3.9%(+22.0)#828 |
| 20. | Point Pleasant Beach Borough | 24.8% | 6.0%(+18.8)#20 | 3.9%(+20.9)#902 |
| 21. | Singac | 24.6% | 6.0%(+18.6)#21 | 3.9%(+20.7)#908 |
| 22. | Elwood | 23.6% | 6.0%(+17.6)#22 | 3.9%(+19.7)#947 |
| 23. | Ridgefield Borough | 23.3% | 6.0%(+17.3)#23 | 3.9%(+19.4)#956 |
| 24. | The Hills | 23.3% | 6.0%(+17.3)#24 | 3.9%(+19.4)#957 |
| 25. | East Newark Borough | 23.2% | 6.0%(+17.2)#25 | 3.9%(+19.3)#961 |
| 26. | Woodbridge | 23.0% | 6.0%(+17.0)#26 | 3.9%(+19.1)#972 |
| 27. | Dover Beaches North | 23.0% | 6.0%(+17.0)#27 | 3.9%(+19.1)#976 |
| 28. | Laurence Harbor | 22.0% | 6.0%(+16.0)#28 | 3.9%(+18.1)#1,039 |
| 29. | Far Hills Borough | 21.9% | 6.0%(+15.9)#29 | 3.9%(+18.0)#1,041 |
| 30. | Eatontown Borough | 21.7% | 6.0%(+15.7)#30 | 3.9%(+17.8)#1,052 |
| 31. | Emerson Borough | 21.6% | 6.0%(+15.6)#31 | 3.9%(+17.7)#1,059 |
| 32. | Turnersville | 21.4% | 6.0%(+15.4)#32 | 3.9%(+17.5)#1,064 |
| 33. | Bedminster | 21.0% | 6.0%(+15.0)#33 | 3.9%(+17.1)#1,093 |
| 34. | Beckett | 20.8% | 6.0%(+14.8)#34 | 3.9%(+16.9)#1,107 |
| 35. | South Plainfield Borough | 20.3% | 6.0%(+14.3)#35 | 3.9%(+16.4)#1,125 |
| 36. | Kendall Park | 20.2% | 6.0%(+14.2)#36 | 3.9%(+16.3)#1,131 |
| 37. | Glen Gardner Borough | 20.0% | 6.0%(+14.0)#37 | 3.9%(+16.1)#1,141 |
| 38. | Johnsonburg | 19.9% | 6.0%(+13.9)#38 | 3.9%(+16.0)#1,182 |
| 39. | North Beach Haven | 19.7% | 6.0%(+13.7)#39 | 3.9%(+15.8)#1,197 |
| 40. | Ocean Grove | 19.3% | 6.0%(+13.3)#40 | 3.9%(+15.4)#1,213 |
| 41. | Old Tappan Borough | 18.7% | 6.0%(+12.7)#41 | 3.9%(+14.8)#1,255 |
| 42. | Glendora | 18.7% | 6.0%(+12.7)#42 | 3.9%(+14.8)#1,256 |
| 43. | Leonardo | 18.4% | 6.0%(+12.4)#43 | 3.9%(+14.5)#1,296 |
| 44. | Echelon | 18.3% | 6.0%(+12.3)#44 | 3.9%(+14.4)#1,300 |
| 45. | Mystic Island | 18.1% | 6.0%(+12.1)#45 | 3.9%(+14.2)#1,312 |
| 46. | Panther Valley | 17.9% | 6.0%(+11.9)#46 | 3.9%(+14.0)#1,344 |
| 47. | West Wildwood Borough | 17.9% | 6.0%(+11.9)#47 | 3.9%(+14.0)#1,351 |
| 48. | Highland Lakes | 17.6% | 6.0%(+11.6)#48 | 3.9%(+13.7)#1,370 |
| 49. | Concordia | 17.6% | 6.0%(+11.6)#49 | 3.9%(+13.7)#1,372 |
| 50. | Andover Borough | 17.6% | 6.0%(+11.6)#50 | 3.9%(+13.7)#1,379 |
| 51. | Cape May Point Borough | 17.3% | 6.0%(+11.3)#51 | 3.9%(+13.4)#1,407 |
| 52. | Somerdale Borough | 17.2% | 6.0%(+11.2)#52 | 3.9%(+13.3)#1,410 |
| 53. | Golden Triangle | 16.4% | 6.0%(+10.4)#53 | 3.9%(+12.5)#1,525 |
| 54. | Millington | 16.4% | 6.0%(+10.4)#54 | 3.9%(+12.5)#1,527 |
| 55. | Wildwood | 16.3% | 6.0%(+10.3)#55 | 3.9%(+12.4)#1,536 |
| 56. | Leisure Village West | 16.3% | 6.0%(+10.3)#56 | 3.9%(+12.4)#1,537 |
| 57. | Westville Borough | 16.2% | 6.0%(+10.2)#57 | 3.9%(+12.3)#1,544 |
| 58. | Tinton Falls Borough | 16.1% | 6.0%(+10.1)#58 | 3.9%(+12.2)#1,551 |
| 59. | Magnolia Borough | 16.1% | 6.0%(+10.1)#59 | 3.9%(+12.2)#1,554 |
| 60. | Woodstown Borough | 16.0% | 6.0%(+10.00)#60 | 3.9%(+12.1)#1,567 |
| 61. | Chester Borough | 15.8% | 6.0%(+9.80)#61 | 3.9%(+11.9)#1,591 |
| 62. | Wallington Borough | 15.5% | 6.0%(+9.50)#62 | 3.9%(+11.6)#1,618 |
| 63. | Gillette | 15.5% | 6.0%(+9.50)#63 | 3.9%(+11.6)#1,620 |
| 64. | Asbury Park | 15.4% | 6.0%(+9.40)#64 | 3.9%(+11.5)#1,626 |
| 65. | South Toms River Borough | 15.4% | 6.0%(+9.40)#65 | 3.9%(+11.5)#1,628 |
| 66. | Leesburg | 15.3% | 6.0%(+9.30)#66 | 3.9%(+11.4)#1,653 |
| 67. | Union City | 15.1% | 6.0%(+9.10)#67 | 3.9%(+11.2)#1,663 |
| 68. | Somers Point | 15.0% | 6.0%(+9.00)#68 | 3.9%(+11.1)#1,673 |
| 69. | West Park | 14.9% | 6.0%(+8.90)#69 | 3.9%(+11.0)#1,694 |
| 70. | Princeton Meadows | 14.8% | 6.0%(+8.80)#70 | 3.9%(+10.9)#1,698 |
| 71. | Stonebridge | 14.7% | 6.0%(+8.70)#71 | 3.9%(+10.8)#1,708 |
| 72. | Rio Grande | 14.2% | 6.0%(+8.20)#72 | 3.9%(+10.3)#1,755 |
| 73. | Waretown | 14.2% | 6.0%(+8.20)#73 | 3.9%(+10.3)#1,758 |
| 74. | Dover Beaches South | 14.0% | 6.0%(+8.00)#74 | 3.9%(+10.1)#1,808 |
| 75. | Springdale | 13.6% | 6.0%(+7.60)#75 | 3.9%(+9.70)#1,850 |
| 76. | Port Monmouth | 13.6% | 6.0%(+7.60)#76 | 3.9%(+9.70)#1,853 |
| 77. | Milford Borough | 13.3% | 6.0%(+7.30)#77 | 3.9%(+9.40)#1,894 |
| 78. | Washington Borough | 13.2% | 6.0%(+7.20)#78 | 3.9%(+9.30)#1,914 |
| 79. | West Freehold | 13.1% | 6.0%(+7.10)#79 | 3.9%(+9.20)#1,922 |
| 80. | Stanhope Borough | 13.1% | 6.0%(+7.10)#80 | 3.9%(+9.20)#1,928 |
| 81. | Somerset | 12.9% | 6.0%(+6.90)#81 | 3.9%(+9.00)#1,948 |
| 82. | Highland Park Borough | 12.9% | 6.0%(+6.90)#82 | 3.9%(+9.00)#1,950 |
| 83. | Oak Valley | 12.8% | 6.0%(+6.80)#83 | 3.9%(+8.90)#1,971 |
| 84. | Brookdale | 12.7% | 6.0%(+6.70)#84 | 3.9%(+8.80)#1,980 |
| 85. | Little Ferry Borough | 12.5% | 6.0%(+6.50)#85 | 3.9%(+8.60)#2,002 |
| 86. | Allenwood | 12.4% | 6.0%(+6.40)#86 | 3.9%(+8.50)#2,062 |
| 87. | Butler Borough | 12.3% | 6.0%(+6.30)#87 | 3.9%(+8.40)#2,075 |
| 88. | Atlantic City | 12.1% | 6.0%(+6.10)#88 | 3.9%(+8.20)#2,095 |
| 89. | Fords | 12.1% | 6.0%(+6.10)#89 | 3.9%(+8.20)#2,096 |
| 90. | Greentree | 12.1% | 6.0%(+6.10)#90 | 3.9%(+8.20)#2,097 |
| 91. | Weston | 12.1% | 6.0%(+6.10)#91 | 3.9%(+8.20)#2,103 |
| 92. | Estell Manor | 11.9% | 6.0%(+5.90)#92 | 3.9%(+8.00)#2,134 |
| 93. | Hamburg Borough | 11.8% | 6.0%(+5.80)#93 | 3.9%(+7.90)#2,145 |
| 94. | Tenafly Borough | 11.7% | 6.0%(+5.70)#94 | 3.9%(+7.80)#2,151 |
| 95. | Basking Ridge | 11.5% | 6.0%(+5.50)#95 | 3.9%(+7.60)#2,192 |
| 96. | Fairview | 11.5% | 6.0%(+5.50)#96 | 3.9%(+7.60)#2,194 |
| 97. | Allendale Borough | 11.4% | 6.0%(+5.40)#97 | 3.9%(+7.50)#2,212 |
| 98. | Heathcote | 11.4% | 6.0%(+5.40)#98 | 3.9%(+7.50)#2,213 |
| 99. | Union Beach Borough | 11.4% | 6.0%(+5.40)#99 | 3.9%(+7.50)#2,215 |
| 100. | Great Meadows | 11.4% | 6.0%(+5.40)#100 | 3.9%(+7.50)#2,228 |
Common Questions
What are the Top 10 Cities with the Highest Unemployment Rate Amomg Seniors Over the Age of 65 in New Jersey?
Top 10 Cities with the Highest Unemployment Rate Amomg Seniors Over the Age of 65 in New Jersey are:
#1
100.0%
#2
99.9%
#3
38.4%
#4
36.7%
#5
36.1%
#6
35.4%
#7
29.9%
#8
29.1%
#9
27.4%
#10
24.6%
What city has the Highest Unemployment Rate Amomg Seniors Over the Age of 65 in New Jersey?
Diamond Beach has the Highest Unemployment Rate Amomg Seniors Over the Age of 65 in New Jersey with 100.0%.
What is the Unemployment Rate Amomg Seniors Over the Age of 65 in the State of New Jersey?
Unemployment Rate Amomg Seniors Over the Age of 65 in New Jersey is 6.0%.
What is the Unemployment Rate Amomg Seniors Over the Age of 65 in the United States?
Unemployment Rate Amomg Seniors Over the Age of 65 in the United States is 3.9%.