Plainsboro Center, NJ Map & Demographics
Plainsboro Center Map
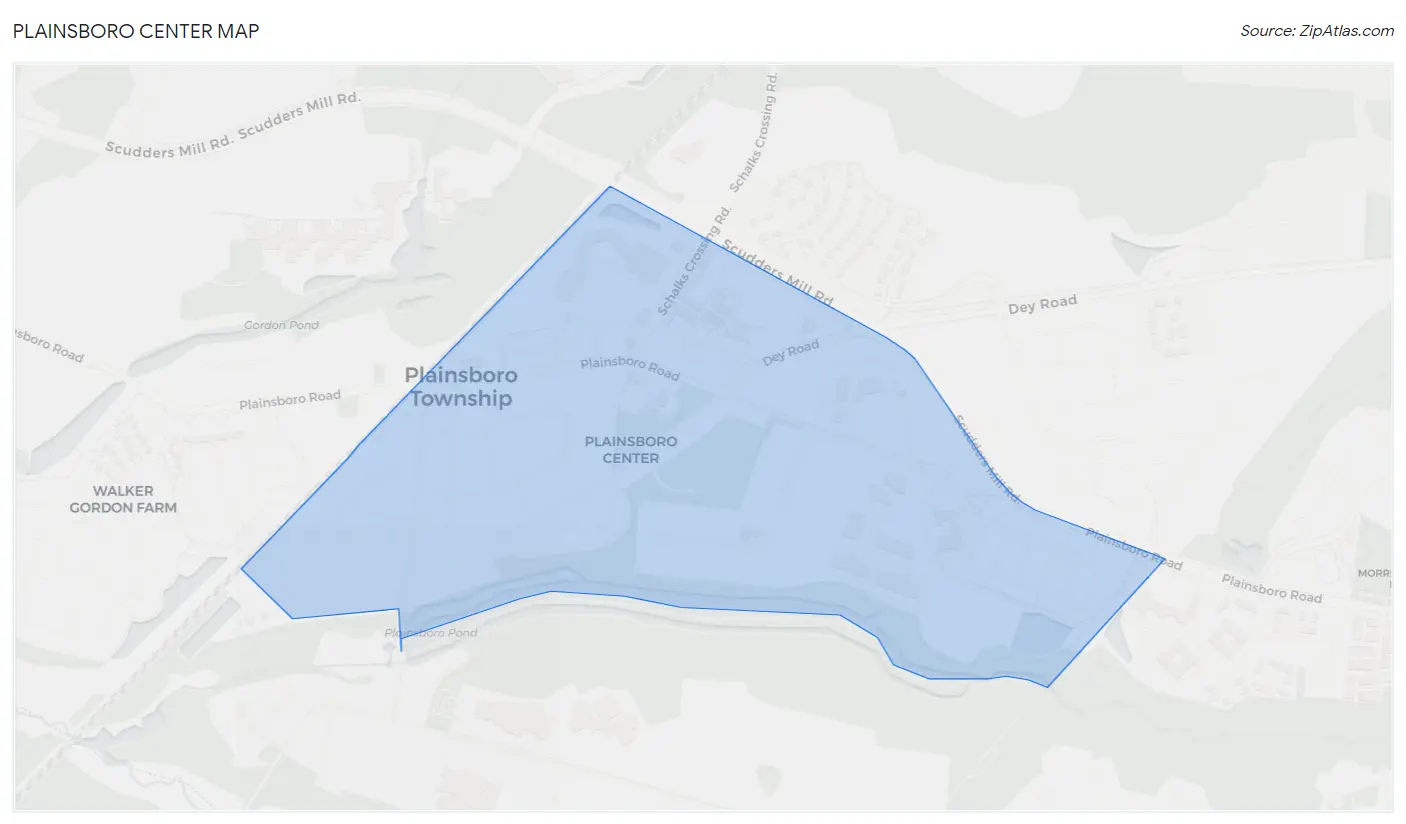
Plainsboro Center Overview
$72,247
PER CAPITA INCOME
$150,040
AVG FAMILY INCOME
$112,629
AVG HOUSEHOLD INCOME
40.0%
WAGE / INCOME GAP [ % ]
60.0¢/ $1
WAGE / INCOME GAP [ $ ]
0.30
INEQUALITY / GINI INDEX
2,766
TOTAL POPULATION
1,587
MALE POPULATION
1,179
FEMALE POPULATION
134.61
MALES / 100 FEMALES
74.29
FEMALES / 100 MALES
36.7
MEDIAN AGE
3.1
AVG FAMILY SIZE
1.9
AVG HOUSEHOLD SIZE
1,766
LABOR FORCE [ PEOPLE ]
77.9%
PERCENT IN LABOR FORCE
2.7%
UNEMPLOYMENT RATE
Income in Plainsboro Center
Income Overview in Plainsboro Center
Per Capita Income in Plainsboro Center is $72,247, while median incomes of families and households are $150,040 and $112,629 respectively.
| Characteristic | Number | Measure |
| Per Capita Income | 2,766 | $72,247 |
| Median Family Income | 585 | $150,040 |
| Mean Family Income | 585 | $186,001 |
| Median Household Income | 1,456 | $112,629 |
| Mean Household Income | 1,456 | $135,036 |
| Income Deficit | 585 | $0 |
| Wage / Income Gap (%) | 2,766 | 40.00% |
| Wage / Income Gap ($) | 2,766 | 60.00¢ per $1 |
| Gini / Inequality Index | 2,766 | 0.30 |
Earnings by Sex in Plainsboro Center
Average Earnings in Plainsboro Center are $101,612, $111,450 for men and $66,875 for women, a difference of 40.0%.
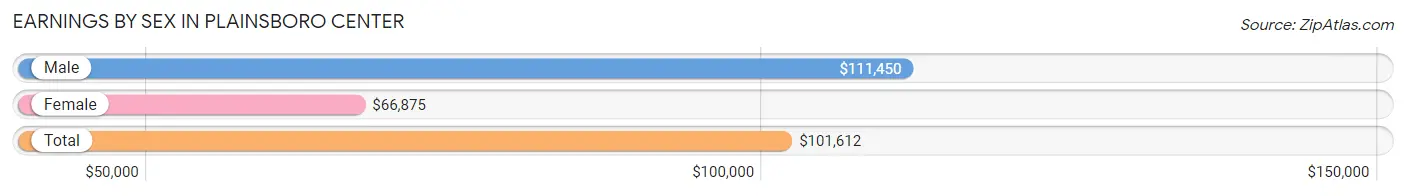
| Sex | Number | Average Earnings |
| Male | 1,232 (68.4%) | $111,450 |
| Female | 568 (31.6%) | $66,875 |
| Total | 1,800 (100.0%) | $101,612 |
Earnings by Sex by Income Bracket in Plainsboro Center
The most common earnings brackets in Plainsboro Center are $100,000+ for men (852 | 69.2%) and $65,000 to $74,999 for women (130 | 22.9%).
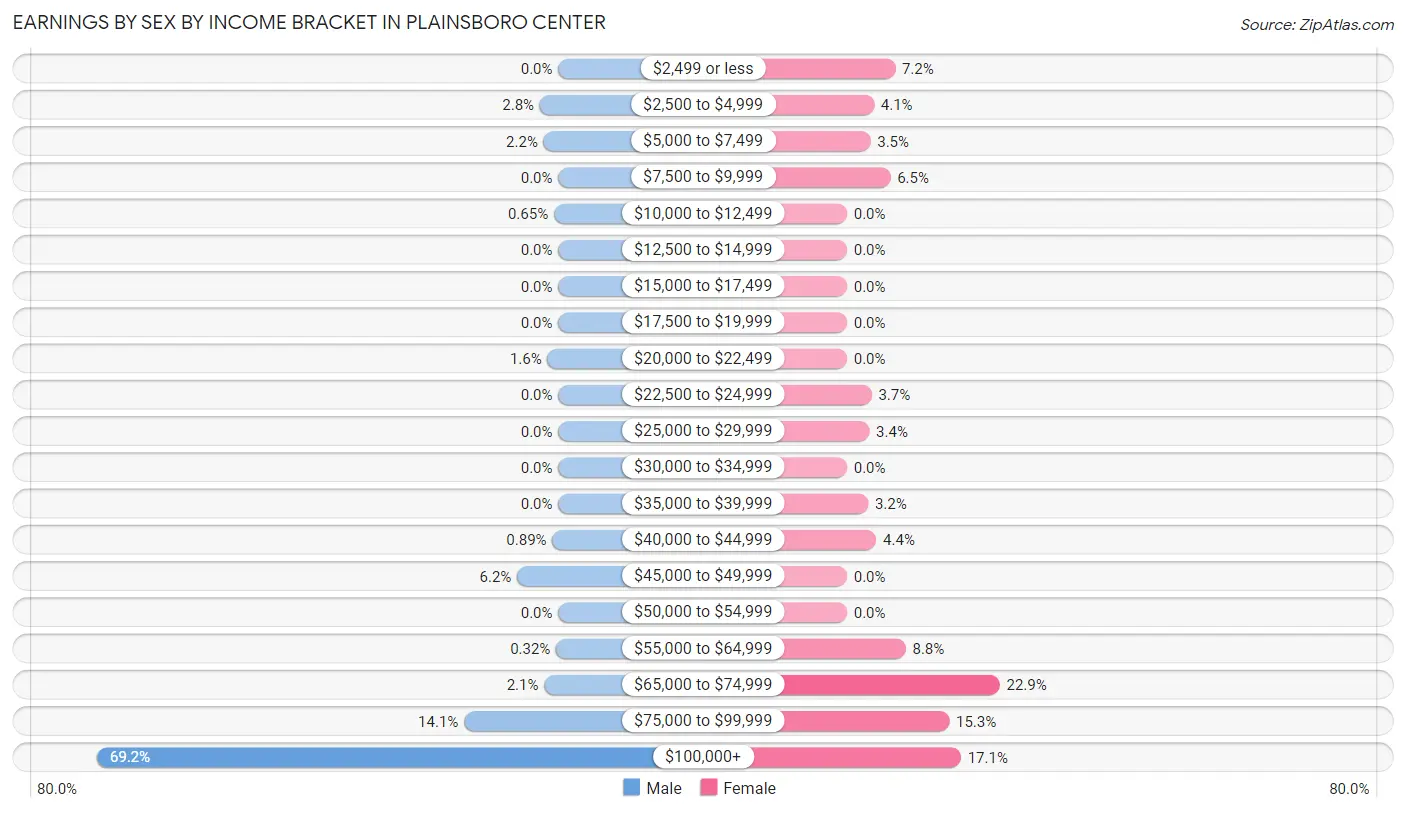
| Income | Male | Female |
| $2,499 or less | 0 (0.0%) | 41 (7.2%) |
| $2,500 to $4,999 | 34 (2.8%) | 23 (4.1%) |
| $5,000 to $7,499 | 27 (2.2%) | 20 (3.5%) |
| $7,500 to $9,999 | 0 (0.0%) | 37 (6.5%) |
| $10,000 to $12,499 | 8 (0.6%) | 0 (0.0%) |
| $12,500 to $14,999 | 0 (0.0%) | 0 (0.0%) |
| $15,000 to $17,499 | 0 (0.0%) | 0 (0.0%) |
| $17,500 to $19,999 | 0 (0.0%) | 0 (0.0%) |
| $20,000 to $22,499 | 20 (1.6%) | 0 (0.0%) |
| $22,500 to $24,999 | 0 (0.0%) | 21 (3.7%) |
| $25,000 to $29,999 | 0 (0.0%) | 19 (3.4%) |
| $30,000 to $34,999 | 0 (0.0%) | 0 (0.0%) |
| $35,000 to $39,999 | 0 (0.0%) | 18 (3.2%) |
| $40,000 to $44,999 | 11 (0.9%) | 25 (4.4%) |
| $45,000 to $49,999 | 76 (6.2%) | 0 (0.0%) |
| $50,000 to $54,999 | 0 (0.0%) | 0 (0.0%) |
| $55,000 to $64,999 | 4 (0.3%) | 50 (8.8%) |
| $65,000 to $74,999 | 26 (2.1%) | 130 (22.9%) |
| $75,000 to $99,999 | 174 (14.1%) | 87 (15.3%) |
| $100,000+ | 852 (69.2%) | 97 (17.1%) |
| Total | 1,232 (100.0%) | 568 (100.0%) |
Earnings by Sex by Educational Attainment in Plainsboro Center
Average earnings in Plainsboro Center are $111,912 for men and $67,063 for women, a difference of 40.1%. Men with an educational attainment of bachelor's degree enjoy the highest average annual earnings of $117,500, while those with graduate degree education earn the least with $111,618. Women with an educational attainment of bachelor's degree earn the most with the average annual earnings of $67,639, while those with graduate degree education have the smallest earnings of $67,458.
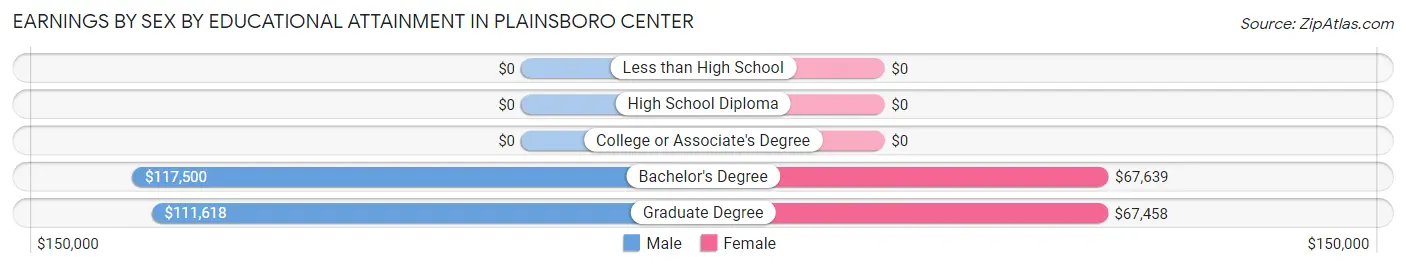
| Educational Attainment | Male Income | Female Income |
| Less than High School | - | - |
| High School Diploma | - | - |
| College or Associate's Degree | - | - |
| Bachelor's Degree | $117,500 | $67,639 |
| Graduate Degree | $111,618 | $67,458 |
| Total | $111,912 | $67,063 |
Family Income in Plainsboro Center
Family Income Brackets in Plainsboro Center
According to the Plainsboro Center family income data, there are 240 families falling into the $200,000+ income range, which is the most common income bracket and makes up 41.0% of all families.
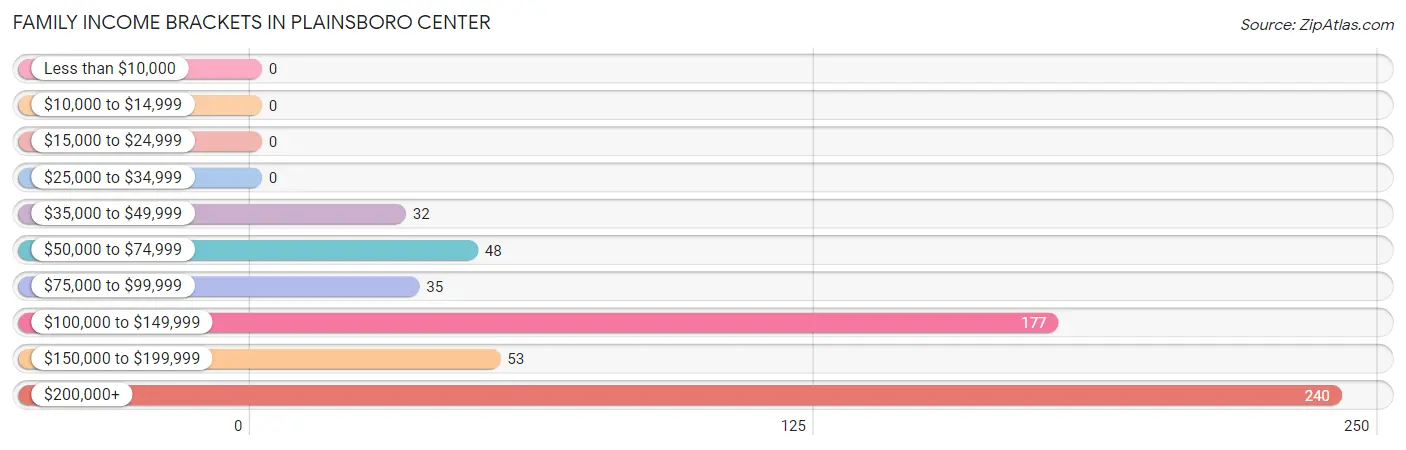
| Income Bracket | # Families | % Families |
| Less than $10,000 | 0 | 0.0% |
| $10,000 to $14,999 | 0 | 0.0% |
| $15,000 to $24,999 | 0 | 0.0% |
| $25,000 to $34,999 | 0 | 0.0% |
| $35,000 to $49,999 | 32 | 5.5% |
| $50,000 to $74,999 | 48 | 8.2% |
| $75,000 to $99,999 | 35 | 6.0% |
| $100,000 to $149,999 | 177 | 30.3% |
| $150,000 to $199,999 | 53 | 9.1% |
| $200,000+ | 240 | 41.0% |
Family Income by Famaliy Size in Plainsboro Center
3-person families (215 | 36.7%) account for the highest median family income in Plainsboro Center with $185,625 per family, while 3-person families (215 | 36.7%) have the highest median income of $61,875 per family member.
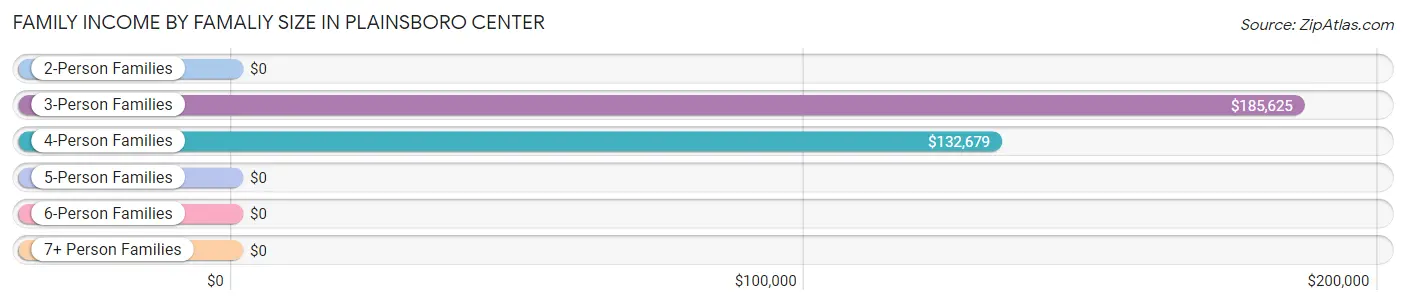
| Income Bracket | # Families | Median Income |
| 2-Person Families | 220 (37.6%) | $0 |
| 3-Person Families | 215 (36.7%) | $185,625 |
| 4-Person Families | 103 (17.6%) | $132,679 |
| 5-Person Families | 26 (4.4%) | $0 |
| 6-Person Families | 0 (0.0%) | $0 |
| 7+ Person Families | 21 (3.6%) | $0 |
| Total | 585 (100.0%) | $150,040 |
Family Income by Number of Earners in Plainsboro Center
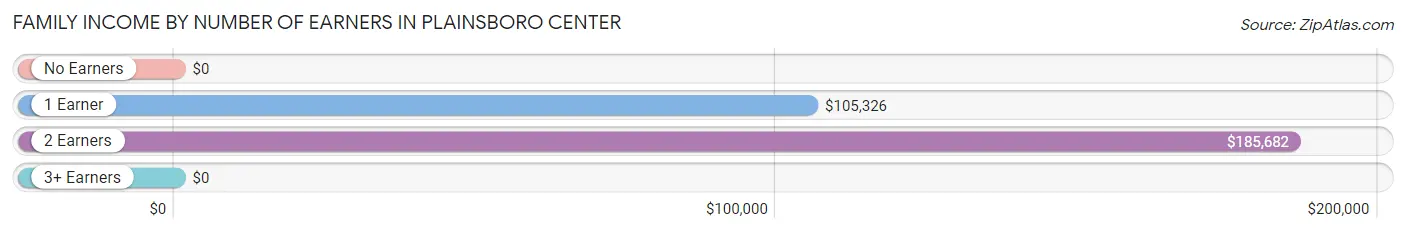
| Number of Earners | # Families | Median Income |
| No Earners | 41 (7.0%) | $0 |
| 1 Earner | 142 (24.3%) | $105,326 |
| 2 Earners | 380 (65.0%) | $185,682 |
| 3+ Earners | 22 (3.8%) | $0 |
| Total | 585 (100.0%) | $150,040 |
Household Income in Plainsboro Center
Household Income Brackets in Plainsboro Center
With 785 households falling in the category, the $100,000 to $149,999 income range is the most frequent in Plainsboro Center, accounting for 53.9% of all households.
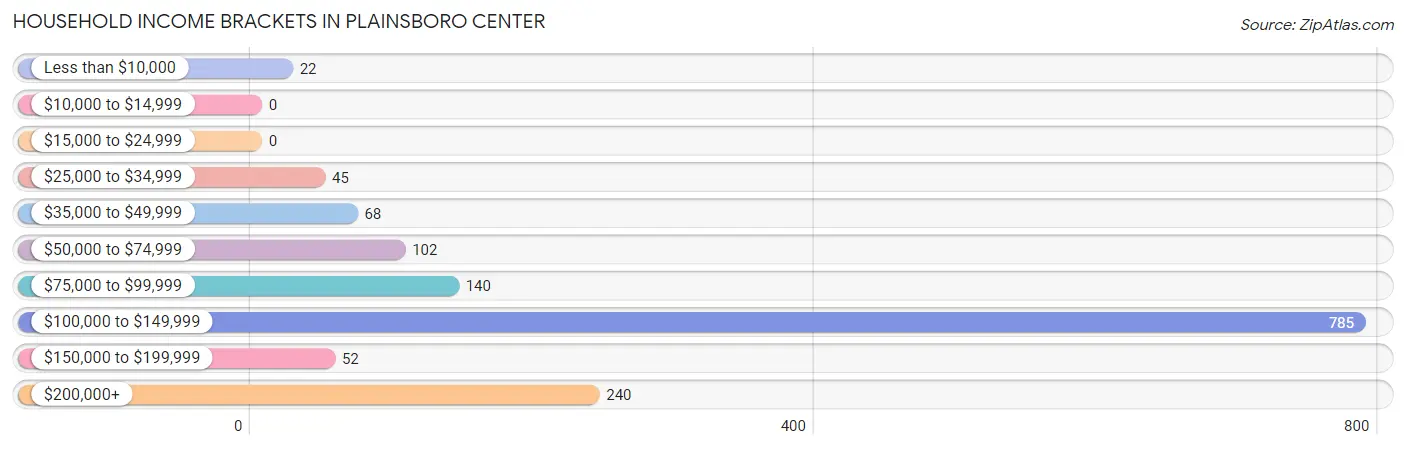
| Income Bracket | # Households | % Households |
| Less than $10,000 | 22 | 1.5% |
| $10,000 to $14,999 | 0 | 0.0% |
| $15,000 to $24,999 | 0 | 0.0% |
| $25,000 to $34,999 | 45 | 3.1% |
| $35,000 to $49,999 | 68 | 4.7% |
| $50,000 to $74,999 | 102 | 7.0% |
| $75,000 to $99,999 | 140 | 9.6% |
| $100,000 to $149,999 | 785 | 53.9% |
| $150,000 to $199,999 | 52 | 3.6% |
| $200,000+ | 240 | 16.5% |
Household Income by Householder Age in Plainsboro Center
The median household income in Plainsboro Center is $112,629, with the highest median household income of $120,217 found in the 45 to 64 years age bracket for the primary householder. A total of 422 households (29.0%) fall into this category. Meanwhile, the 15 to 24 years age bracket for the primary householder has the lowest median household income of $0, with 19 households (1.3%) in this group.
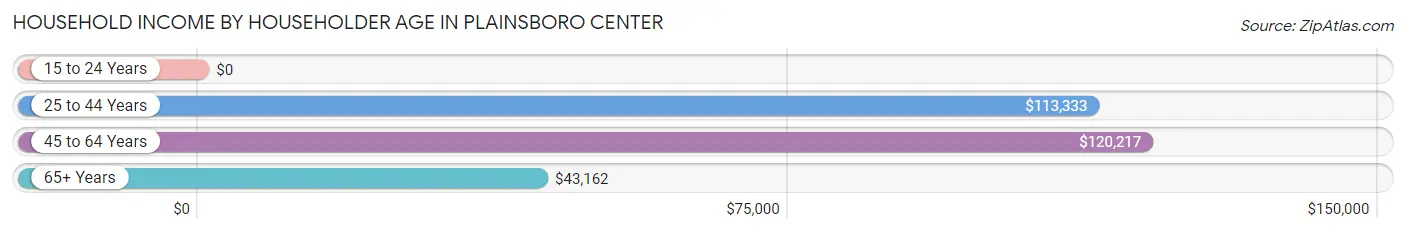
| Income Bracket | # Households | Median Income |
| 15 to 24 Years | 19 (1.3%) | $0 |
| 25 to 44 Years | 788 (54.1%) | $113,333 |
| 45 to 64 Years | 422 (29.0%) | $120,217 |
| 65+ Years | 227 (15.6%) | $43,162 |
| Total | 1,456 (100.0%) | $112,629 |
Poverty in Plainsboro Center
Income Below Poverty by Sex and Age in Plainsboro Center
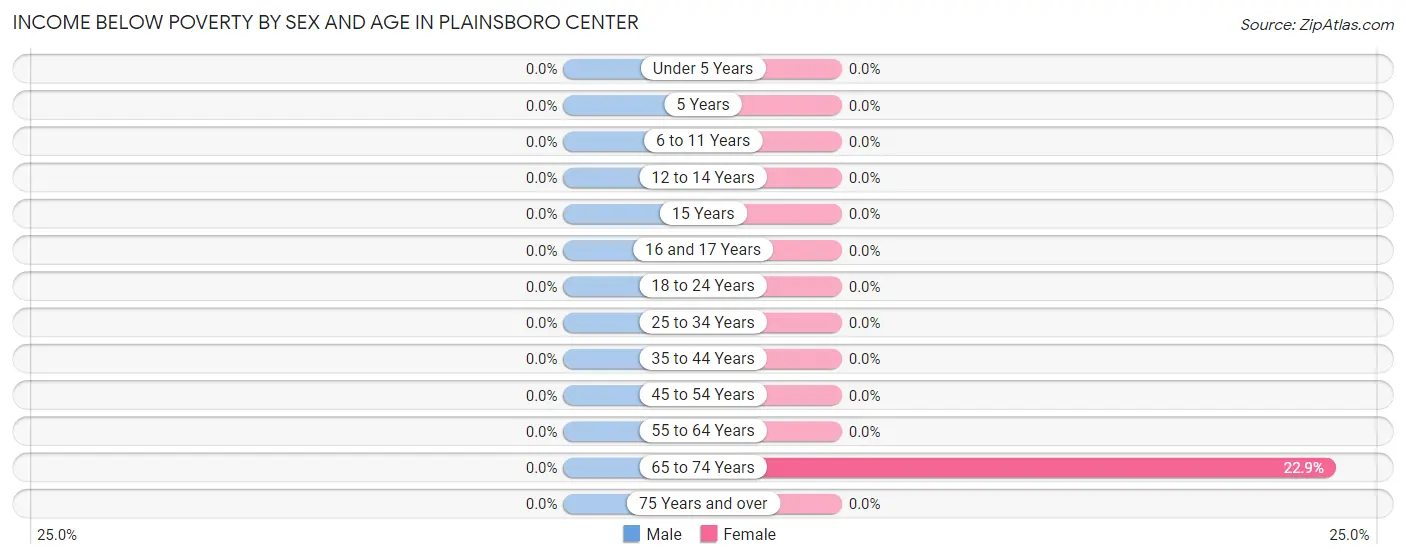
| Age Bracket | Male | Female |
| Under 5 Years | 0 (0.0%) | 0 (0.0%) |
| 5 Years | 0 (0.0%) | 0 (0.0%) |
| 6 to 11 Years | 0 (0.0%) | 0 (0.0%) |
| 12 to 14 Years | 0 (0.0%) | 0 (0.0%) |
| 15 Years | 0 (0.0%) | 0 (0.0%) |
| 16 and 17 Years | 0 (0.0%) | 0 (0.0%) |
| 18 to 24 Years | 0 (0.0%) | 0 (0.0%) |
| 25 to 34 Years | 0 (0.0%) | 0 (0.0%) |
| 35 to 44 Years | 0 (0.0%) | 0 (0.0%) |
| 45 to 54 Years | 0 (0.0%) | 0 (0.0%) |
| 55 to 64 Years | 0 (0.0%) | 0 (0.0%) |
| 65 to 74 Years | 0 (0.0%) | 22 (22.9%) |
| 75 Years and over | 0 (0.0%) | 0 (0.0%) |
| Total | 0 (0.0%) | 22 (1.9%) |
Income Above Poverty by Sex and Age in Plainsboro Center
According to the poverty statistics in Plainsboro Center, males aged under 5 years and females aged under 5 years are the age groups that are most secure financially, with 100.0% of males and 100.0% of females in these age groups living above the poverty line.
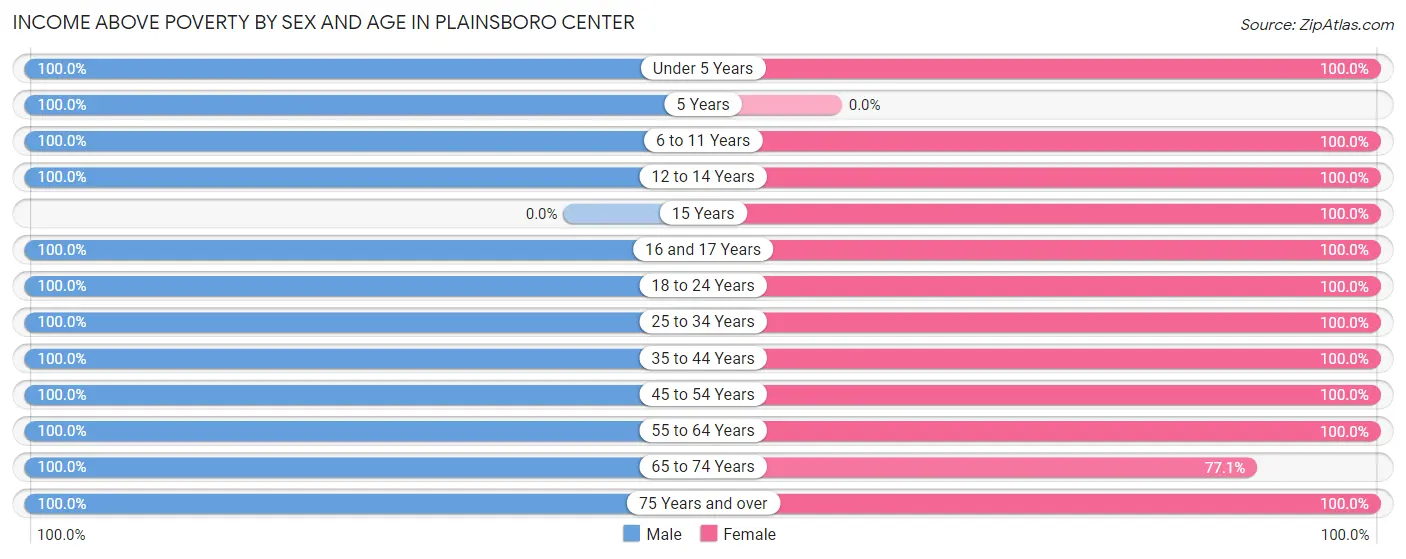
| Age Bracket | Male | Female |
| Under 5 Years | 95 (100.0%) | 91 (100.0%) |
| 5 Years | 17 (100.0%) | 0 (0.0%) |
| 6 to 11 Years | 129 (100.0%) | 71 (100.0%) |
| 12 to 14 Years | 18 (100.0%) | 65 (100.0%) |
| 15 Years | 0 (0.0%) | 13 (100.0%) |
| 16 and 17 Years | 27 (100.0%) | 7 (100.0%) |
| 18 to 24 Years | 17 (100.0%) | 44 (100.0%) |
| 25 to 34 Years | 484 (100.0%) | 213 (100.0%) |
| 35 to 44 Years | 303 (100.0%) | 206 (100.0%) |
| 45 to 54 Years | 234 (100.0%) | 118 (100.0%) |
| 55 to 64 Years | 162 (100.0%) | 113 (100.0%) |
| 65 to 74 Years | 66 (100.0%) | 74 (77.1%) |
| 75 Years and over | 35 (100.0%) | 142 (100.0%) |
| Total | 1,587 (100.0%) | 1,157 (98.1%) |
Income Below Poverty Among Married-Couple Families in Plainsboro Center
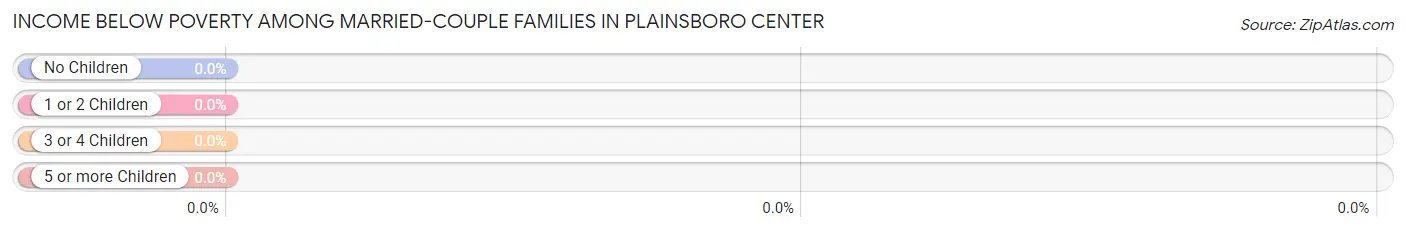
| Children | Above Poverty | Below Poverty |
| No Children | 216 (100.0%) | 0 (0.0%) |
| 1 or 2 Children | 277 (100.0%) | 0 (0.0%) |
| 3 or 4 Children | 39 (100.0%) | 0 (0.0%) |
| 5 or more Children | 0 (0.0%) | 0 (0.0%) |
| Total | 532 (100.0%) | 0 (0.0%) |
Income Below Poverty Among Single-Parent Households in Plainsboro Center
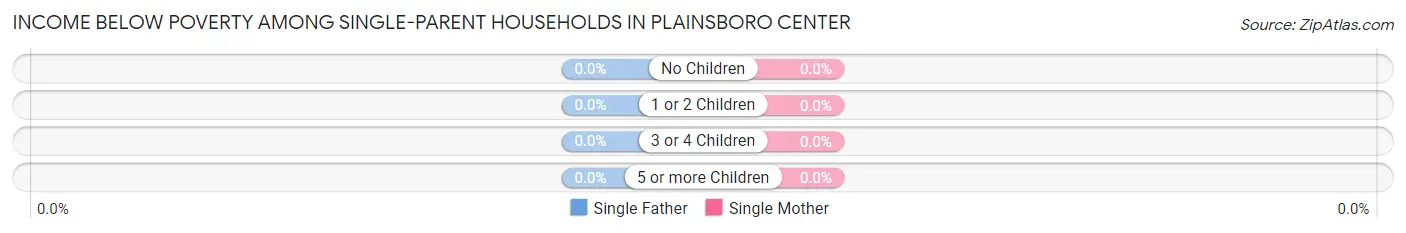
| Children | Single Father | Single Mother |
| No Children | 0 (0.0%) | 0 (0.0%) |
| 1 or 2 Children | 0 (0.0%) | 0 (0.0%) |
| 3 or 4 Children | 0 (0.0%) | 0 (0.0%) |
| 5 or more Children | 0 (0.0%) | 0 (0.0%) |
| Total | 0 (0.0%) | 0 (0.0%) |
Income Below Poverty Among Married-Couple vs Single-Parent Households in Plainsboro Center
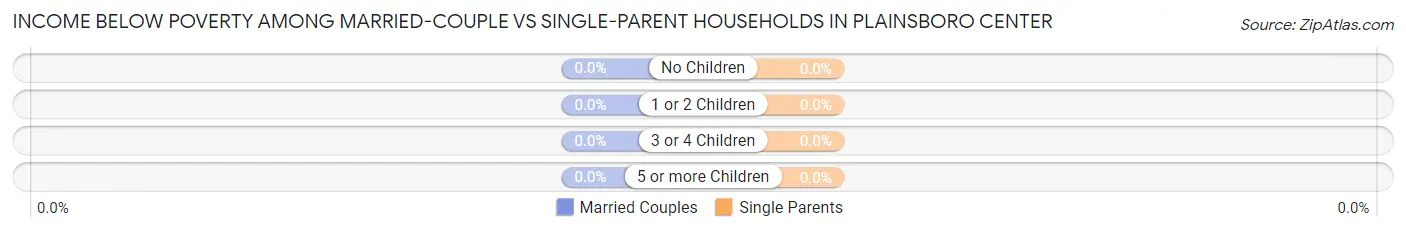
| Children | Married-Couple Families | Single-Parent Households |
| No Children | 0 (0.0%) | 0 (0.0%) |
| 1 or 2 Children | 0 (0.0%) | 0 (0.0%) |
| 3 or 4 Children | 0 (0.0%) | 0 (0.0%) |
| 5 or more Children | 0 (0.0%) | 0 (0.0%) |
| Total | 0 (0.0%) | 0 (0.0%) |
Race in Plainsboro Center
The most populous races in Plainsboro Center are White / Caucasian (1,308 | 47.3%), Asian (1,168 | 42.2%), and Black / African American (208 | 7.5%).
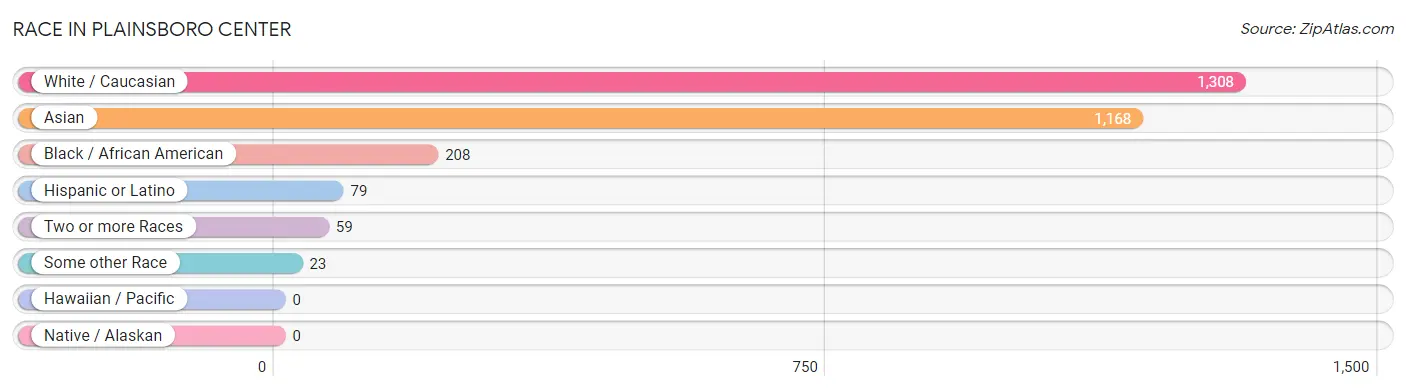
| Race | # Population | % Population |
| Asian | 1,168 | 42.2% |
| Black / African American | 208 | 7.5% |
| Hawaiian / Pacific | 0 | 0.0% |
| Hispanic or Latino | 79 | 2.9% |
| Native / Alaskan | 0 | 0.0% |
| White / Caucasian | 1,308 | 47.3% |
| Two or more Races | 59 | 2.1% |
| Some other Race | 23 | 0.8% |
| Total | 2,766 | 100.0% |
Ancestry in Plainsboro Center
The most populous ancestries reported in Plainsboro Center are Thai (906 | 32.8%), Irish (201 | 7.3%), German (197 | 7.1%), Indian (Asian) (177 | 6.4%), and Russian (159 | 5.8%), together accounting for 59.3% of all Plainsboro Center residents.
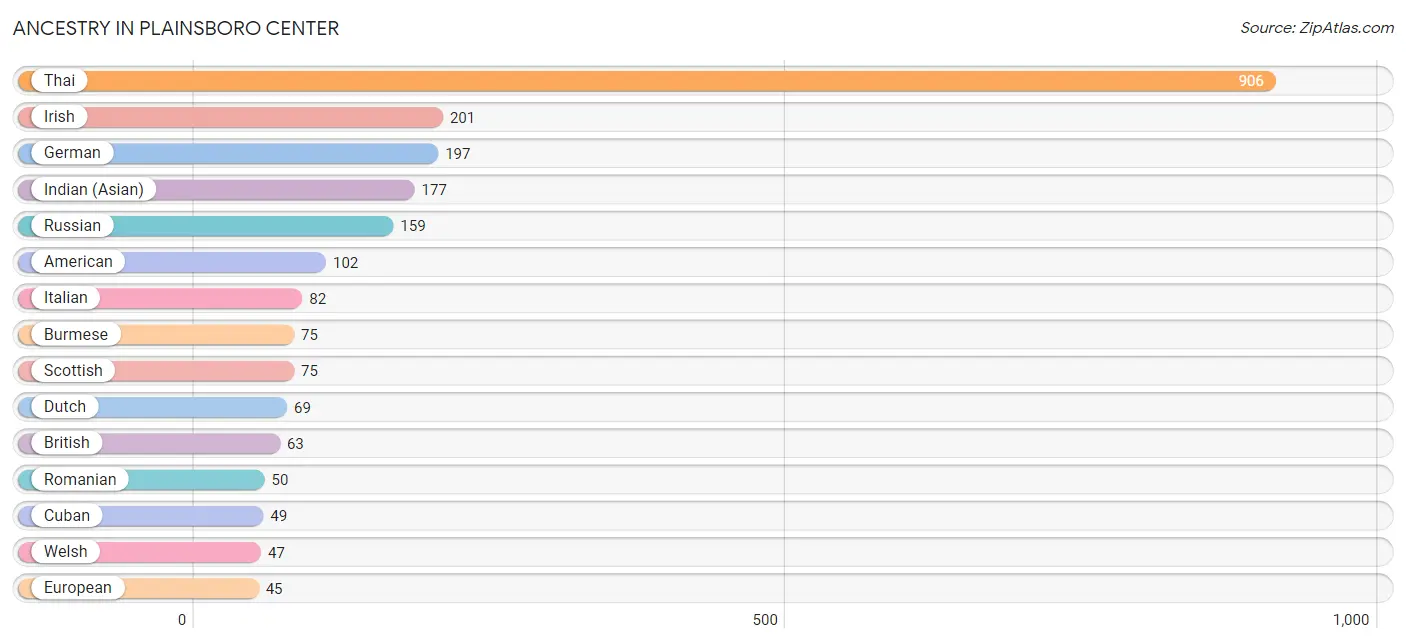
| Ancestry | # Population | % Population |
| American | 102 | 3.7% |
| British | 63 | 2.3% |
| Burmese | 75 | 2.7% |
| Canadian | 26 | 0.9% |
| Cuban | 49 | 1.8% |
| Dutch | 69 | 2.5% |
| Eastern European | 23 | 0.8% |
| European | 45 | 1.6% |
| French | 38 | 1.4% |
| French Canadian | 33 | 1.2% |
| German | 197 | 7.1% |
| Hungarian | 20 | 0.7% |
| Indian (Asian) | 177 | 6.4% |
| Irish | 201 | 7.3% |
| Italian | 82 | 3.0% |
| Korean | 42 | 1.5% |
| Latvian | 14 | 0.5% |
| Polish | 41 | 1.5% |
| Puerto Rican | 30 | 1.1% |
| Romanian | 50 | 1.8% |
| Russian | 159 | 5.8% |
| Scotch-Irish | 23 | 0.8% |
| Scottish | 75 | 2.7% |
| Swiss | 19 | 0.7% |
| Thai | 906 | 32.8% |
| Trinidadian and Tobagonian | 31 | 1.1% |
| Ukrainian | 24 | 0.9% |
| Welsh | 47 | 1.7% | View All 28 Rows |
Immigrants in Plainsboro Center
The most numerous immigrant groups reported in Plainsboro Center came from Asia (919 | 33.2%), India (677 | 24.5%), South Central Asia (677 | 24.5%), Europe (264 | 9.5%), and Eastern Asia (217 | 7.9%), together accounting for 99.6% of all Plainsboro Center residents.
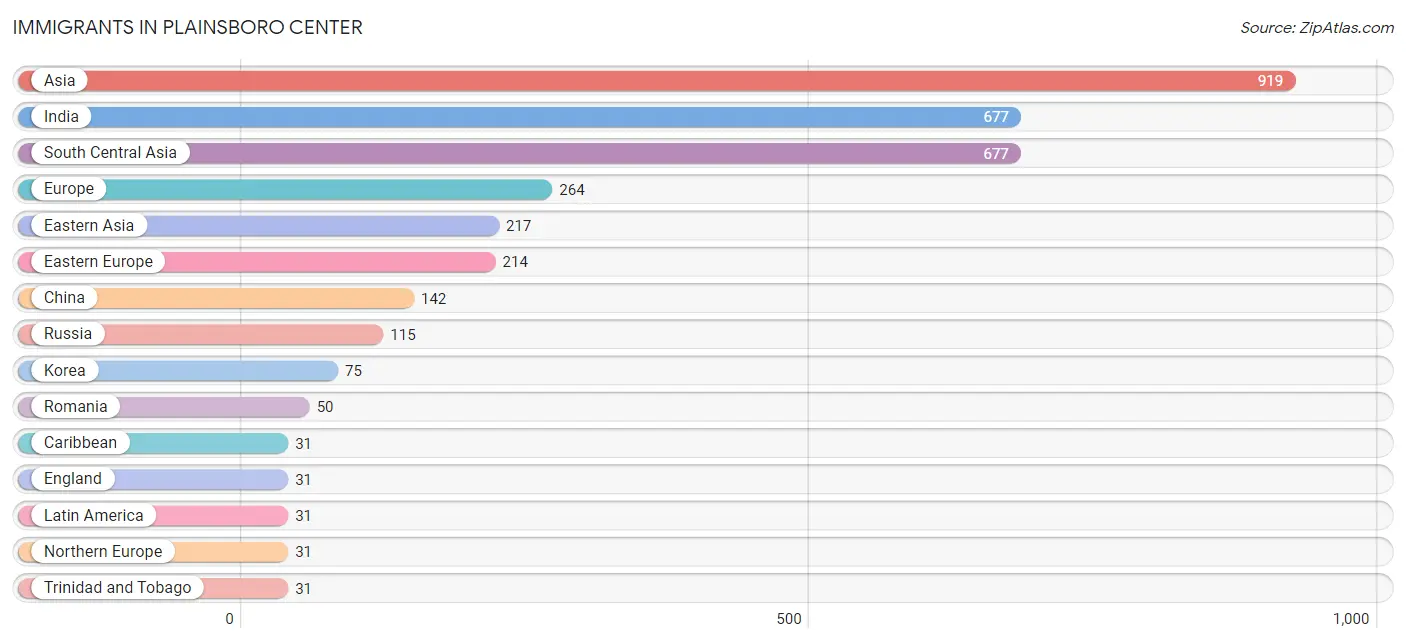
| Immigration Origin | # Population | % Population |
| Asia | 919 | 33.2% |
| Belarus | 25 | 0.9% |
| Canada | 18 | 0.6% |
| Caribbean | 31 | 1.1% |
| China | 142 | 5.1% |
| Eastern Asia | 217 | 7.9% |
| Eastern Europe | 214 | 7.7% |
| England | 31 | 1.1% |
| Europe | 264 | 9.5% |
| India | 677 | 24.5% |
| Korea | 75 | 2.7% |
| Latin America | 31 | 1.1% |
| Latvia | 14 | 0.5% |
| Netherlands | 19 | 0.7% |
| Northern Europe | 31 | 1.1% |
| Philippines | 18 | 0.6% |
| Romania | 50 | 1.8% |
| Russia | 115 | 4.2% |
| South Central Asia | 677 | 24.5% |
| South Eastern Asia | 25 | 0.9% |
| Taiwan | 27 | 1.0% |
| Trinidad and Tobago | 31 | 1.1% |
| Ukraine | 10 | 0.4% |
| Vietnam | 7 | 0.3% |
| Western Europe | 19 | 0.7% | View All 25 Rows |
Sex and Age in Plainsboro Center
Sex and Age in Plainsboro Center
The most populous age groups in Plainsboro Center are 25 to 29 Years (324 | 20.4%) for men and 30 to 34 Years (134 | 11.4%) for women.
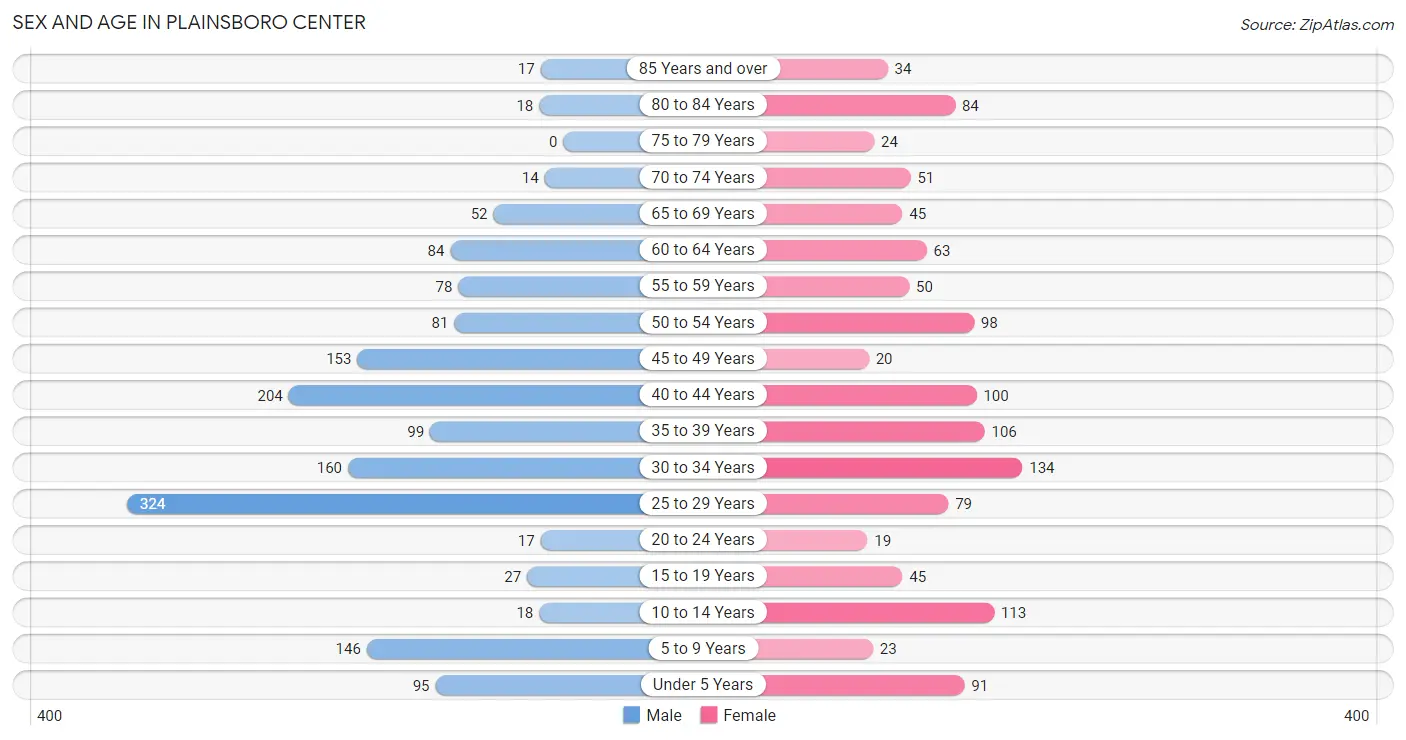
| Age Bracket | Male | Female |
| Under 5 Years | 95 (6.0%) | 91 (7.7%) |
| 5 to 9 Years | 146 (9.2%) | 23 (1.9%) |
| 10 to 14 Years | 18 (1.1%) | 113 (9.6%) |
| 15 to 19 Years | 27 (1.7%) | 45 (3.8%) |
| 20 to 24 Years | 17 (1.1%) | 19 (1.6%) |
| 25 to 29 Years | 324 (20.4%) | 79 (6.7%) |
| 30 to 34 Years | 160 (10.1%) | 134 (11.4%) |
| 35 to 39 Years | 99 (6.2%) | 106 (9.0%) |
| 40 to 44 Years | 204 (12.9%) | 100 (8.5%) |
| 45 to 49 Years | 153 (9.6%) | 20 (1.7%) |
| 50 to 54 Years | 81 (5.1%) | 98 (8.3%) |
| 55 to 59 Years | 78 (4.9%) | 50 (4.2%) |
| 60 to 64 Years | 84 (5.3%) | 63 (5.3%) |
| 65 to 69 Years | 52 (3.3%) | 45 (3.8%) |
| 70 to 74 Years | 14 (0.9%) | 51 (4.3%) |
| 75 to 79 Years | 0 (0.0%) | 24 (2.0%) |
| 80 to 84 Years | 18 (1.1%) | 84 (7.1%) |
| 85 Years and over | 17 (1.1%) | 34 (2.9%) |
| Total | 1,587 (100.0%) | 1,179 (100.0%) |
Families and Households in Plainsboro Center
Median Family Size in Plainsboro Center
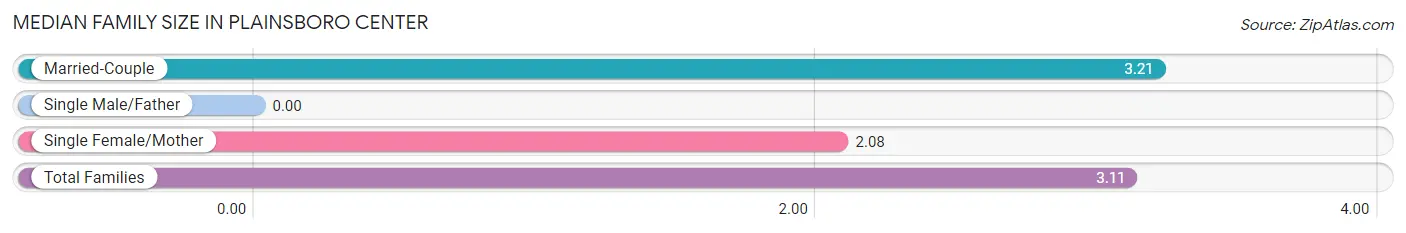
| Family Type | # Families | Family Size |
| Married-Couple | 532 (90.9%) | 3.21 |
| Single Male/Father | 0 (0.0%) | - |
| Single Female/Mother | 53 (9.1%) | 2.08 |
| Total Families | 585 (100.0%) | 3.11 |
Median Household Size in Plainsboro Center
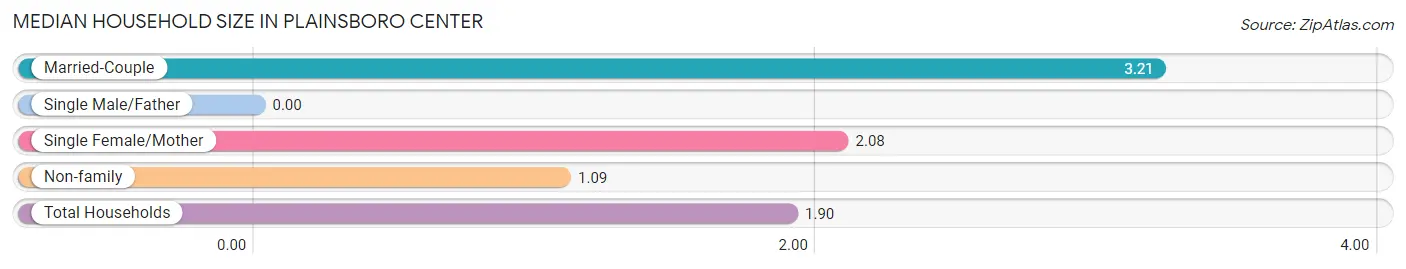
| Household Type | # Households | Household Size |
| Married-Couple | 532 (36.5%) | 3.21 |
| Single Male/Father | 0 (0.0%) | - |
| Single Female/Mother | 53 (3.6%) | 2.08 |
| Non-family | 871 (59.8%) | 1.09 |
| Total Households | 1,456 (100.0%) | 1.90 |
Household Size by Marriage Status in Plainsboro Center
Out of a total of 1,456 households in Plainsboro Center, 585 (40.2%) are family households, while 871 (59.8%) are nonfamily households. The most numerous type of family households are 2-person households, comprising 220, and the most common type of nonfamily households are 1-person households, comprising 799.
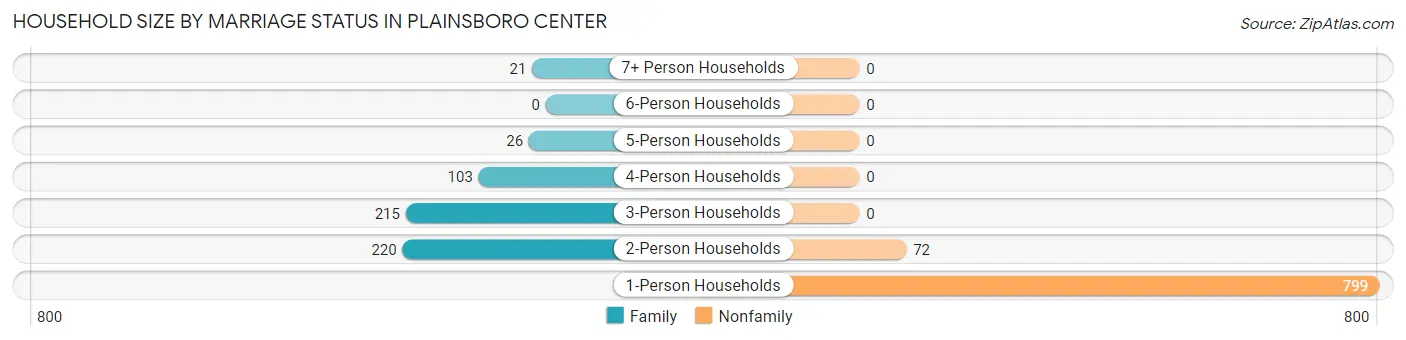
| Household Size | Family Households | Nonfamily Households |
| 1-Person Households | - | 799 (54.9%) |
| 2-Person Households | 220 (15.1%) | 72 (5.0%) |
| 3-Person Households | 215 (14.8%) | 0 (0.0%) |
| 4-Person Households | 103 (7.1%) | 0 (0.0%) |
| 5-Person Households | 26 (1.8%) | 0 (0.0%) |
| 6-Person Households | 0 (0.0%) | 0 (0.0%) |
| 7+ Person Households | 21 (1.4%) | 0 (0.0%) |
| Total | 585 (40.2%) | 871 (59.8%) |
Female Fertility in Plainsboro Center
Fertility by Age in Plainsboro Center
Average fertility rate in Plainsboro Center is 36.0 births per 1,000 women. Women in the age bracket of 20 to 34 years have the highest fertility rate with 78.0 births per 1,000 women. Women in the age bracket of 20 to 34 years acount for 100.0% of all women with births.
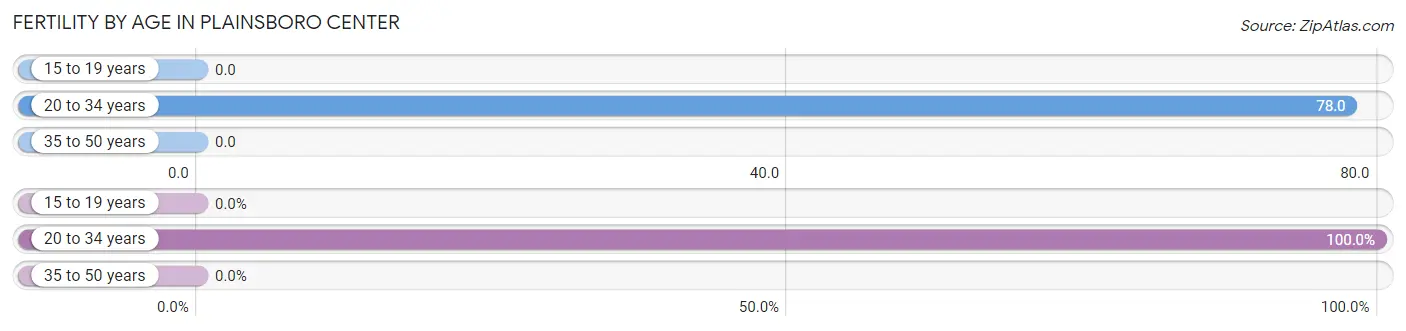
| Age Bracket | Women with Births | Births / 1,000 Women |
| 15 to 19 years | 0 (0.0%) | 0.0 |
| 20 to 34 years | 18 (100.0%) | 78.0 |
| 35 to 50 years | 0 (0.0%) | 0.0 |
| Total | 18 (100.0%) | 36.0 |
Fertility by Age by Marriage Status in Plainsboro Center
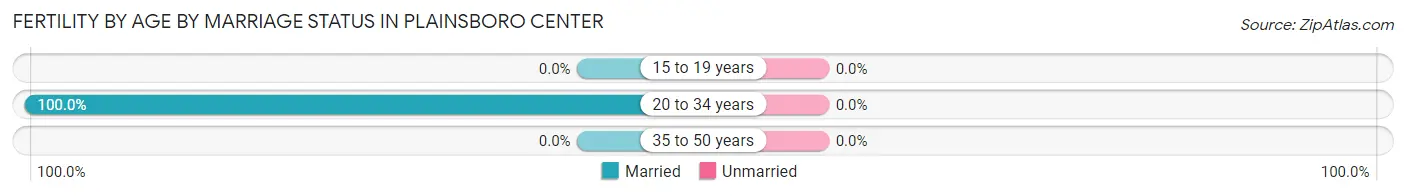
| Age Bracket | Married | Unmarried |
| 15 to 19 years | 0 (0.0%) | 0 (0.0%) |
| 20 to 34 years | 18 (100.0%) | 0 (0.0%) |
| 35 to 50 years | 0 (0.0%) | 0 (0.0%) |
| Total | 18 (100.0%) | 0 (0.0%) |
Fertility by Education in Plainsboro Center
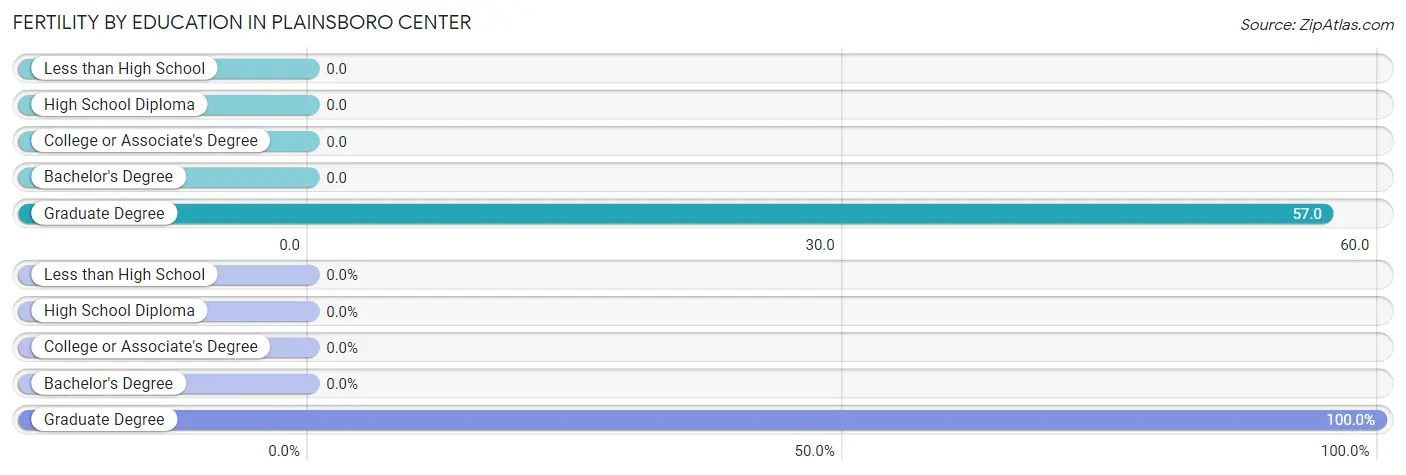
| Educational Attainment | Women with Births | Births / 1,000 Women |
| Less than High School | 0 (0.0%) | 0.0 |
| High School Diploma | 0 (0.0%) | 0.0 |
| College or Associate's Degree | 0 (0.0%) | 0.0 |
| Bachelor's Degree | 0 (0.0%) | 0.0 |
| Graduate Degree | 18 (100.0%) | 57.0 |
| Total | 18 (100.0%) | 36.0 |
Fertility by Education by Marriage Status in Plainsboro Center
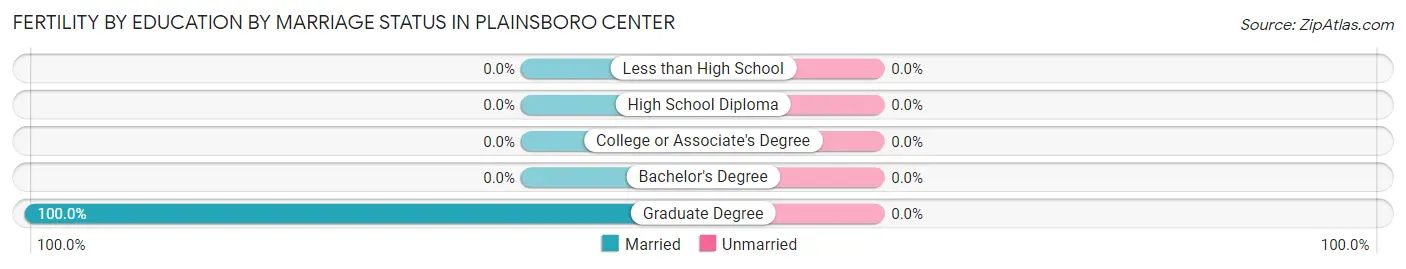
| Educational Attainment | Married | Unmarried |
| Less than High School | 0 (0.0%) | 0 (0.0%) |
| High School Diploma | 0 (0.0%) | 0 (0.0%) |
| College or Associate's Degree | 0 (0.0%) | 0 (0.0%) |
| Bachelor's Degree | 0 (0.0%) | 0 (0.0%) |
| Graduate Degree | 18 (100.0%) | 0 (0.0%) |
| Total | 18 (100.0%) | 0 (0.0%) |
Employment Characteristics in Plainsboro Center
Employment by Class of Employer in Plainsboro Center
Among the 1,700 employed individuals in Plainsboro Center, private company employees (1,271 | 74.8%), not-for-profit organizations (307 | 18.1%), and self-employed (incorporated) (43 | 2.5%) make up the most common classes of employment.
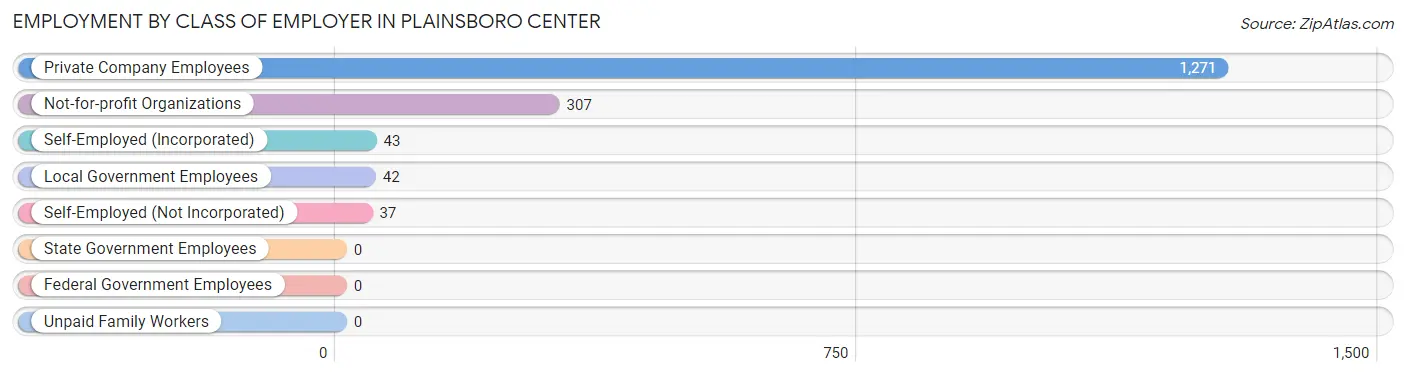
| Employer Class | # Employees | % Employees |
| Private Company Employees | 1,271 | 74.8% |
| Self-Employed (Incorporated) | 43 | 2.5% |
| Self-Employed (Not Incorporated) | 37 | 2.2% |
| Not-for-profit Organizations | 307 | 18.1% |
| Local Government Employees | 42 | 2.5% |
| State Government Employees | 0 | 0.0% |
| Federal Government Employees | 0 | 0.0% |
| Unpaid Family Workers | 0 | 0.0% |
| Total | 1,700 | 100.0% |
Employment Status by Age in Plainsboro Center
According to the labor force statistics for Plainsboro Center, out of the total population over 16 years of age (2,267), 77.9% or 1,766 individuals are in the labor force, with 2.7% or 48 of them unemployed. The age group with the highest labor force participation rate is 20 to 24 years, with 100.0% or 36 individuals in the labor force. Within the labor force, the 30 to 34 years age range has the highest percentage of unemployed individuals, with 10.3% or 28 of them being unemployed.
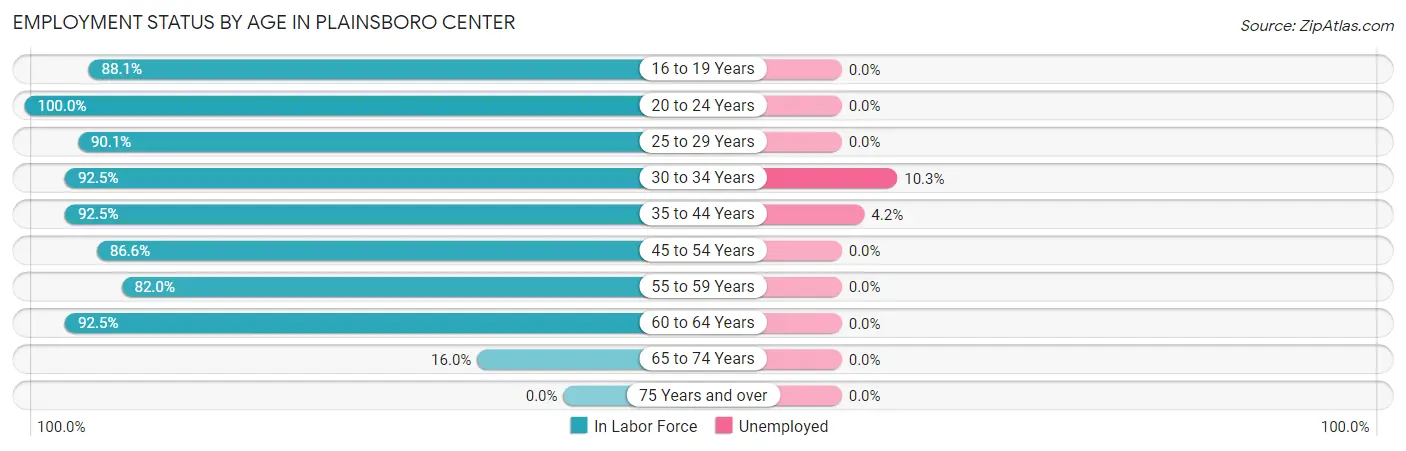
| Age Bracket | In Labor Force | Unemployed |
| 16 to 19 Years | 52 (88.1%) | 0 (0.0%) |
| 20 to 24 Years | 36 (100.0%) | 0 (0.0%) |
| 25 to 29 Years | 363 (90.1%) | 0 (0.0%) |
| 30 to 34 Years | 272 (92.5%) | 28 (10.3%) |
| 35 to 44 Years | 471 (92.5%) | 20 (4.2%) |
| 45 to 54 Years | 305 (86.6%) | 0 (0.0%) |
| 55 to 59 Years | 105 (82.0%) | 0 (0.0%) |
| 60 to 64 Years | 136 (92.5%) | 0 (0.0%) |
| 65 to 74 Years | 26 (16.0%) | 0 (0.0%) |
| 75 Years and over | 0 (0.0%) | 0 (0.0%) |
| Total | 1,766 (77.9%) | 48 (2.7%) |
Employment Status by Educational Attainment in Plainsboro Center
According to labor force statistics for Plainsboro Center, 90.1% of individuals (1,652) out of the total population between 25 and 64 years of age (1,833) are in the labor force, with 2.9% or 48 of them being unemployed. The group with the highest labor force participation rate are those with the educational attainment of bachelor's degree or higher, with 91.7% or 1,584 individuals in the labor force. Within the labor force, individuals with bachelor's degree or higher education have the highest percentage of unemployment, with 3.0% or 48 of them being unemployed.
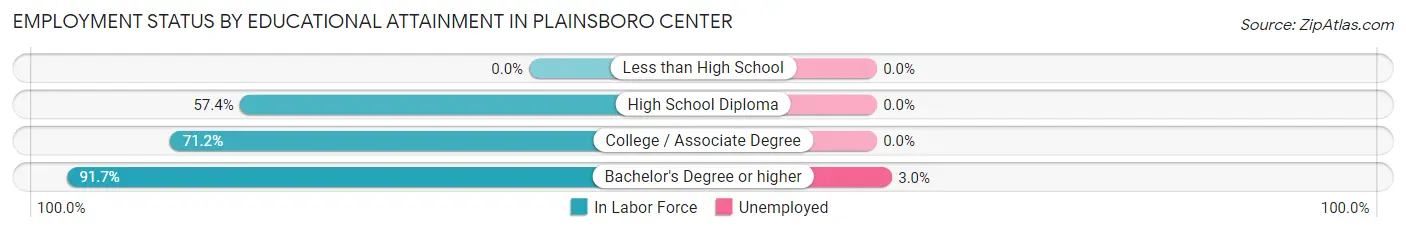
| Educational Attainment | In Labor Force | Unemployed |
| Less than High School | 0 (0.0%) | 0 (0.0%) |
| High School Diploma | 31 (57.4%) | 0 (0.0%) |
| College / Associate Degree | 37 (71.2%) | 0 (0.0%) |
| Bachelor's Degree or higher | 1,584 (91.7%) | 52 (3.0%) |
| Total | 1,652 (90.1%) | 53 (2.9%) |
Employment Occupations by Sex in Plainsboro Center
Management, Business, Science and Arts Occupations
The most common Management, Business, Science and Arts occupations in Plainsboro Center are Computers, Engineering & Science (416 | 24.2%), Computers & Mathematics (317 | 18.4%), Management (306 | 17.8%), Community & Social Service (244 | 14.2%), and Education Instruction & Library (186 | 10.8%).
Management, Business, Science and Arts Occupations by Sex
Within the Management, Business, Science and Arts occupations in Plainsboro Center, the most male-oriented occupations are Architecture & Engineering (100.0%), Business & Financial (88.0%), and Computers & Mathematics (80.8%), while the most female-oriented occupations are Legal Services & Support (100.0%), Arts, Media & Entertainment (85.0%), and Community & Social Service (73.8%).
| Occupation | Male | Female |
| Management | 245 (80.1%) | 61 (19.9%) |
| Business & Financial | 117 (88.0%) | 16 (12.0%) |
| Computers, Engineering & Science | 321 (77.2%) | 95 (22.8%) |
| Computers & Mathematics | 256 (80.8%) | 61 (19.2%) |
| Architecture & Engineering | 44 (100.0%) | 0 (0.0%) |
| Life, Physical & Social Science | 21 (38.2%) | 34 (61.8%) |
| Community & Social Service | 64 (26.2%) | 180 (73.8%) |
| Education, Arts & Media | 0 (0.0%) | 0 (0.0%) |
| Legal Services & Support | 0 (0.0%) | 18 (100.0%) |
| Education Instruction & Library | 58 (31.2%) | 128 (68.8%) |
| Arts, Media & Entertainment | 6 (15.0%) | 34 (85.0%) |
| Health Diagnosing & Treating | 28 (46.7%) | 32 (53.3%) |
| Health Technologists | 28 (46.7%) | 32 (53.3%) |
| Total (Category) | 775 (66.9%) | 384 (33.1%) |
| Total (Overall) | 1,198 (69.7%) | 520 (30.3%) |
Services Occupations
The most common Services occupations in Plainsboro Center are Security & Protection (33 | 1.9%), and Firefighting & Prevention (33 | 1.9%).
Services Occupations by Sex
| Occupation | Male | Female |
| Healthcare Support | 0 (0.0%) | 0 (0.0%) |
| Security & Protection | 33 (100.0%) | 0 (0.0%) |
| Firefighting & Prevention | 33 (100.0%) | 0 (0.0%) |
| Law Enforcement | 0 (0.0%) | 0 (0.0%) |
| Food Preparation & Serving | 0 (0.0%) | 0 (0.0%) |
| Cleaning & Maintenance | 0 (0.0%) | 0 (0.0%) |
| Personal Care & Service | 0 (0.0%) | 0 (0.0%) |
| Total (Category) | 33 (100.0%) | 0 (0.0%) |
| Total (Overall) | 1,198 (69.7%) | 520 (30.3%) |
Sales and Office Occupations
The most common Sales and Office occupations in Plainsboro Center are Sales & Related (273 | 15.9%), and Office & Administration (173 | 10.1%).
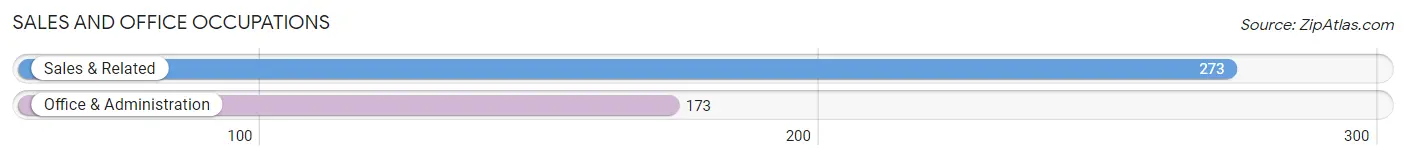
Sales and Office Occupations by Sex

| Occupation | Male | Female |
| Sales & Related | 237 (86.8%) | 36 (13.2%) |
| Office & Administration | 96 (55.5%) | 77 (44.5%) |
| Total (Category) | 333 (74.7%) | 113 (25.3%) |
| Total (Overall) | 1,198 (69.7%) | 520 (30.3%) |
Natural Resources, Construction and Maintenance Occupations

Natural Resources, Construction and Maintenance Occupations by Sex
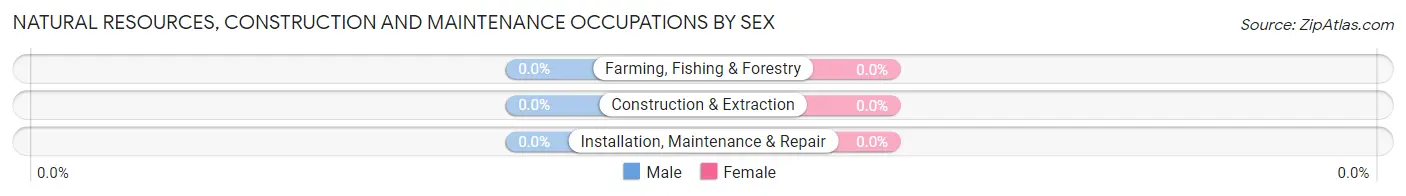
| Occupation | Male | Female |
| Farming, Fishing & Forestry | 0 (0.0%) | 0 (0.0%) |
| Construction & Extraction | 0 (0.0%) | 0 (0.0%) |
| Installation, Maintenance & Repair | 0 (0.0%) | 0 (0.0%) |
| Total (Category) | 0 (0.0%) | 0 (0.0%) |
| Total (Overall) | 1,198 (69.7%) | 520 (30.3%) |
Production, Transportation and Moving Occupations
The most common Production, Transportation and Moving occupations in Plainsboro Center are , and Production (80 | 4.7%).
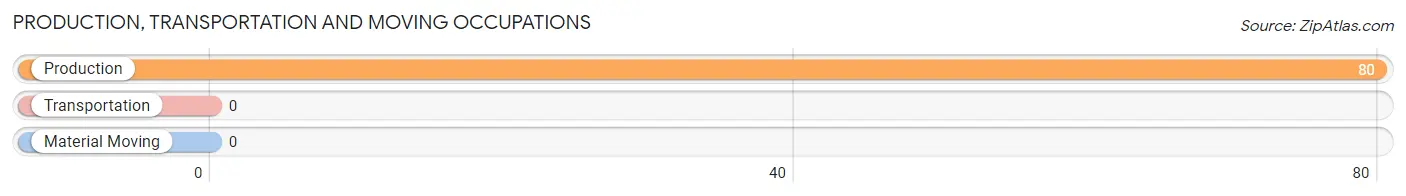
Production, Transportation and Moving Occupations by Sex
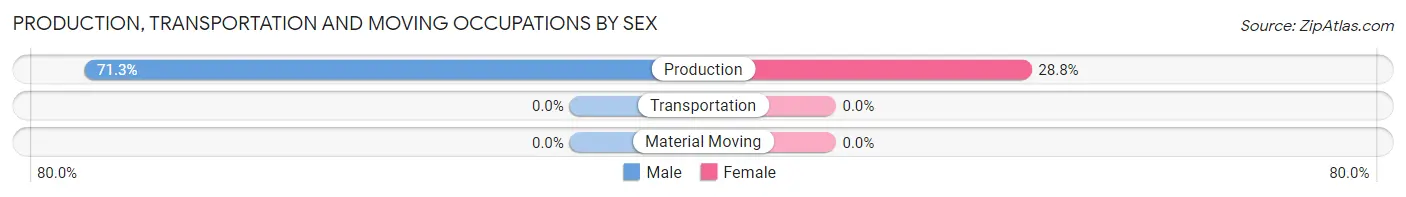
| Occupation | Male | Female |
| Production | 57 (71.3%) | 23 (28.7%) |
| Transportation | 0 (0.0%) | 0 (0.0%) |
| Material Moving | 0 (0.0%) | 0 (0.0%) |
| Total (Category) | 57 (71.3%) | 23 (28.7%) |
| Total (Overall) | 1,198 (69.7%) | 520 (30.3%) |
Employment Industries by Sex in Plainsboro Center
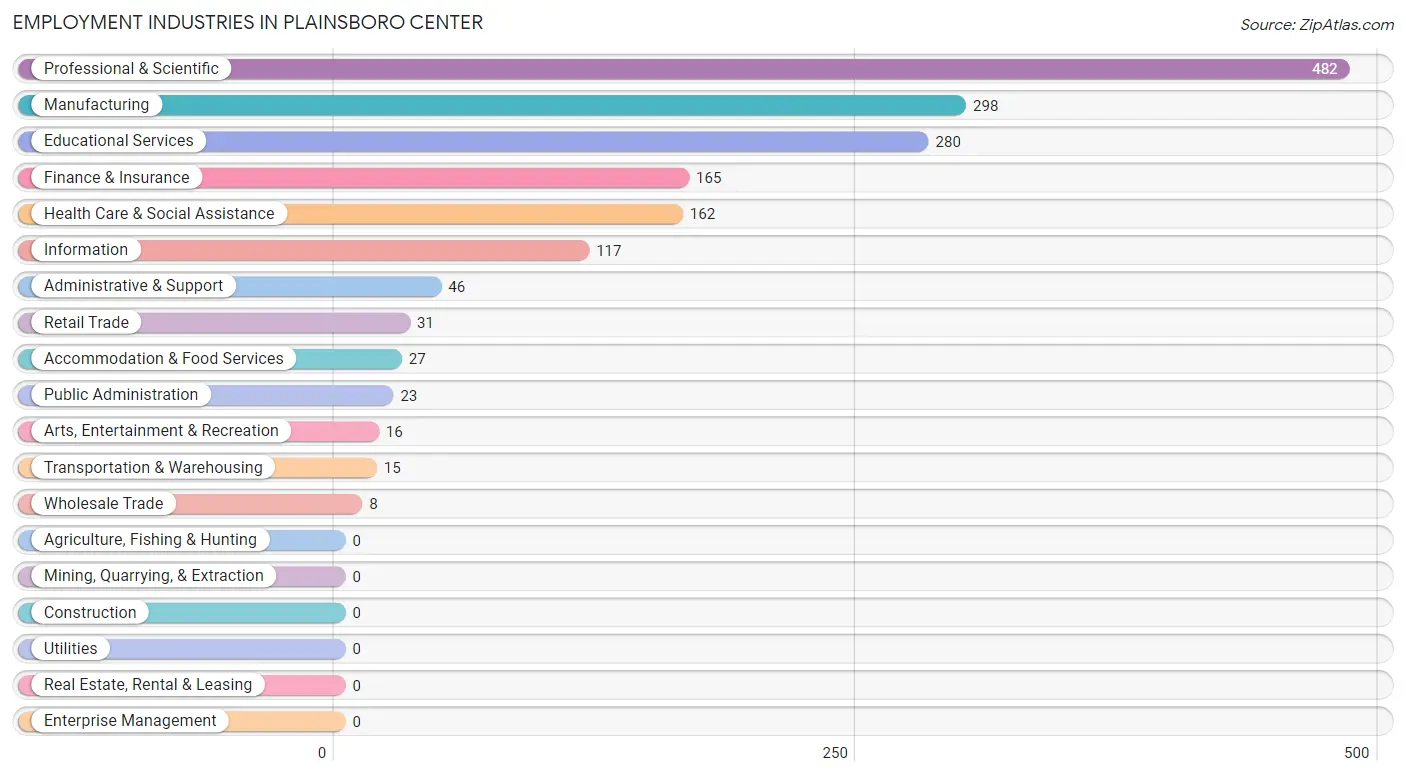
Employment Industries in Plainsboro Center
The major employment industries in Plainsboro Center include Professional & Scientific (482 | 28.1%), Manufacturing (298 | 17.3%), Educational Services (280 | 16.3%), Finance & Insurance (165 | 9.6%), and Health Care & Social Assistance (162 | 9.4%).
Employment Industries by Sex in Plainsboro Center
The Plainsboro Center industries that see more men than women are Wholesale Trade (100.0%), Administrative & Support (100.0%), and Accommodation & Food Services (100.0%), whereas the industries that tend to have a higher number of women are Transportation & Warehousing (100.0%), Arts, Entertainment & Recreation (100.0%), and Public Administration (100.0%).
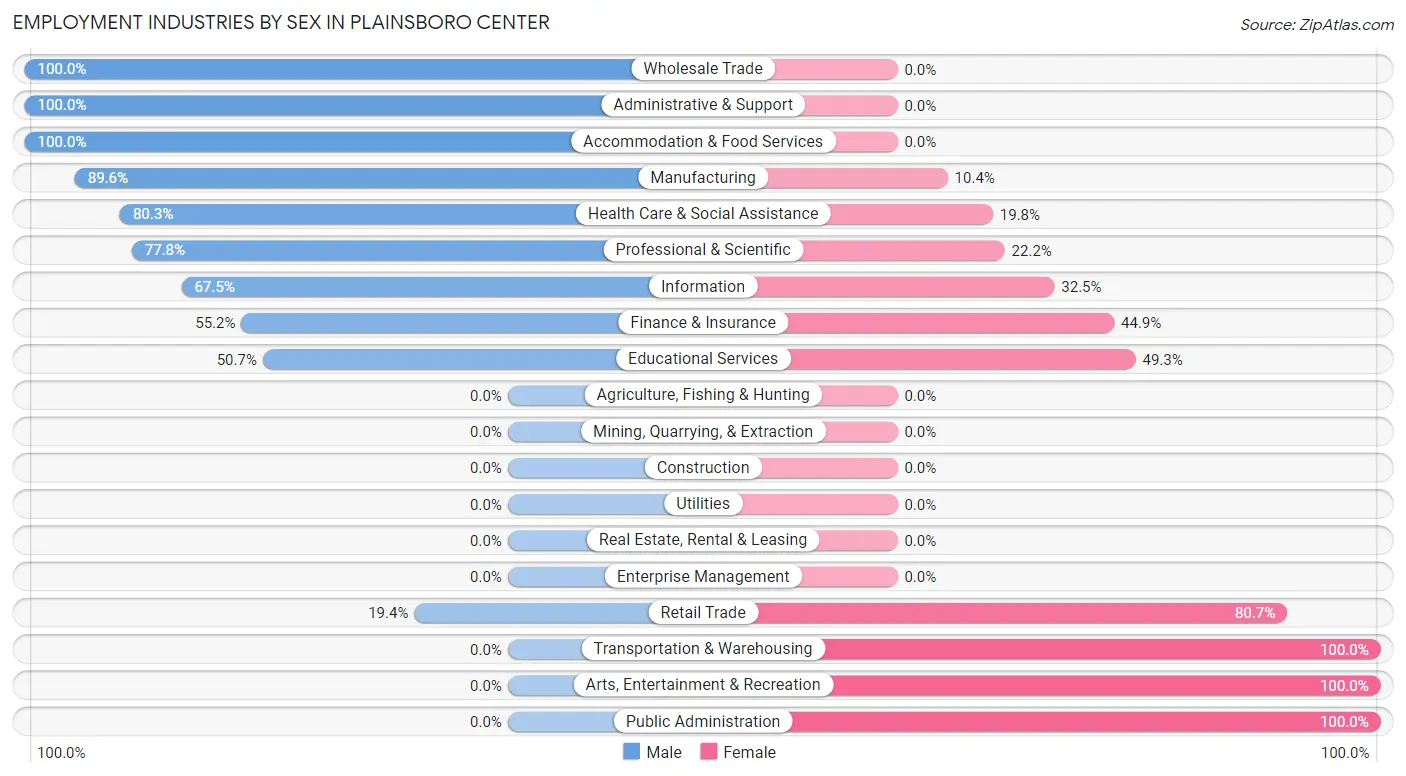
| Industry | Male | Female |
| Agriculture, Fishing & Hunting | 0 (0.0%) | 0 (0.0%) |
| Mining, Quarrying, & Extraction | 0 (0.0%) | 0 (0.0%) |
| Construction | 0 (0.0%) | 0 (0.0%) |
| Manufacturing | 267 (89.6%) | 31 (10.4%) |
| Wholesale Trade | 8 (100.0%) | 0 (0.0%) |
| Retail Trade | 6 (19.4%) | 25 (80.6%) |
| Transportation & Warehousing | 0 (0.0%) | 15 (100.0%) |
| Utilities | 0 (0.0%) | 0 (0.0%) |
| Information | 79 (67.5%) | 38 (32.5%) |
| Finance & Insurance | 91 (55.1%) | 74 (44.9%) |
| Real Estate, Rental & Leasing | 0 (0.0%) | 0 (0.0%) |
| Professional & Scientific | 375 (77.8%) | 107 (22.2%) |
| Enterprise Management | 0 (0.0%) | 0 (0.0%) |
| Administrative & Support | 46 (100.0%) | 0 (0.0%) |
| Educational Services | 142 (50.7%) | 138 (49.3%) |
| Health Care & Social Assistance | 130 (80.2%) | 32 (19.8%) |
| Arts, Entertainment & Recreation | 0 (0.0%) | 16 (100.0%) |
| Accommodation & Food Services | 27 (100.0%) | 0 (0.0%) |
| Public Administration | 0 (0.0%) | 23 (100.0%) |
| Total | 1,198 (69.7%) | 520 (30.3%) |
Education in Plainsboro Center
School Enrollment in Plainsboro Center
The most common levels of schooling among the 500 students in Plainsboro Center are middle school (131 | 26.2%), elementary school (105 | 21.0%), and graduate / professional (85 | 17.0%).
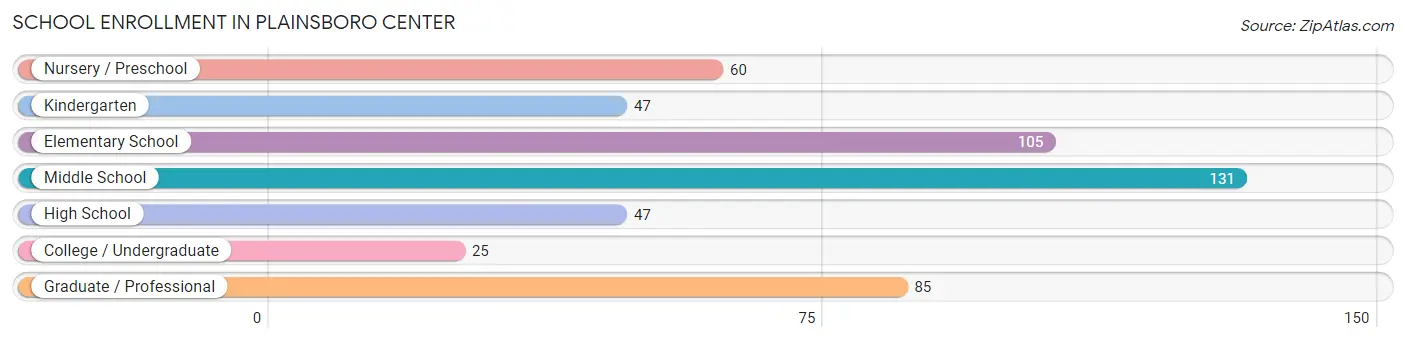
| School Level | # Students | % Students |
| Nursery / Preschool | 60 | 12.0% |
| Kindergarten | 47 | 9.4% |
| Elementary School | 105 | 21.0% |
| Middle School | 131 | 26.2% |
| High School | 47 | 9.4% |
| College / Undergraduate | 25 | 5.0% |
| Graduate / Professional | 85 | 17.0% |
| Total | 500 | 100.0% |
School Enrollment by Age by Funding Source in Plainsboro Center
Out of a total of 500 students who are enrolled in schools in Plainsboro Center, 105 (21.0%) attend a private institution, while the remaining 395 (79.0%) are enrolled in public schools. The age group of 3 to 4 year olds has the highest likelihood of being enrolled in private schools, with 43 (100.0% in the age bracket) enrolled. Conversely, the age group of 10 to 14 year olds has the lowest likelihood of being enrolled in a private school, with 131 (100.0% in the age bracket) attending a public institution.
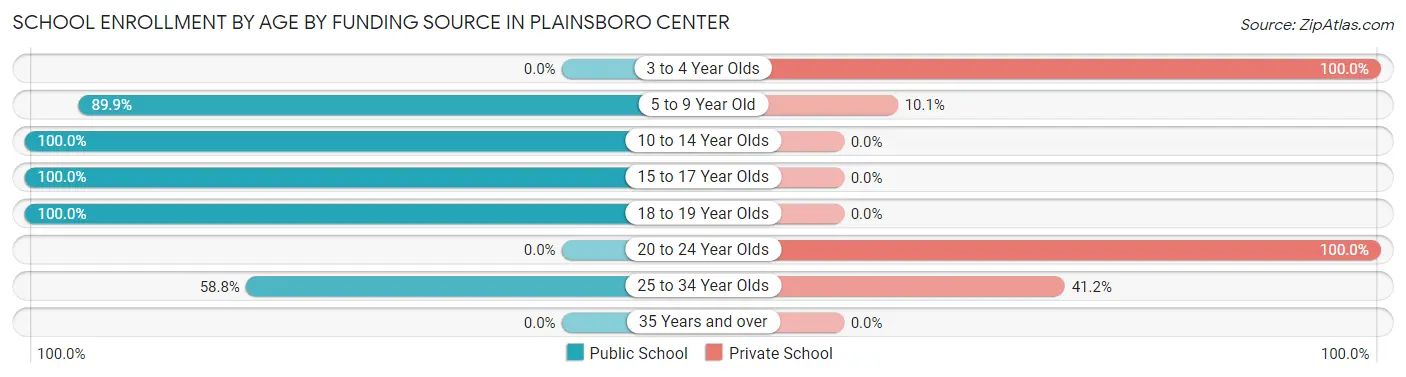
| Age Bracket | Public School | Private School |
| 3 to 4 Year Olds | 0 (0.0%) | 43 (100.0%) |
| 5 to 9 Year Old | 152 (89.9%) | 17 (10.1%) |
| 10 to 14 Year Olds | 131 (100.0%) | 0 (0.0%) |
| 15 to 17 Year Olds | 47 (100.0%) | 0 (0.0%) |
| 18 to 19 Year Olds | 25 (100.0%) | 0 (0.0%) |
| 20 to 24 Year Olds | 0 (0.0%) | 17 (100.0%) |
| 25 to 34 Year Olds | 40 (58.8%) | 28 (41.2%) |
| 35 Years and over | 0 (0.0%) | 0 (0.0%) |
| Total | 395 (79.0%) | 105 (21.0%) |
Educational Attainment by Field of Study in Plainsboro Center
Engineering (384 | 19.5%), physical & health sciences (374 | 19.0%), business (285 | 14.5%), computers & mathematics (248 | 12.6%), and liberal arts & history (147 | 7.5%) are the most common fields of study among 1,969 individuals in Plainsboro Center who have obtained a bachelor's degree or higher.
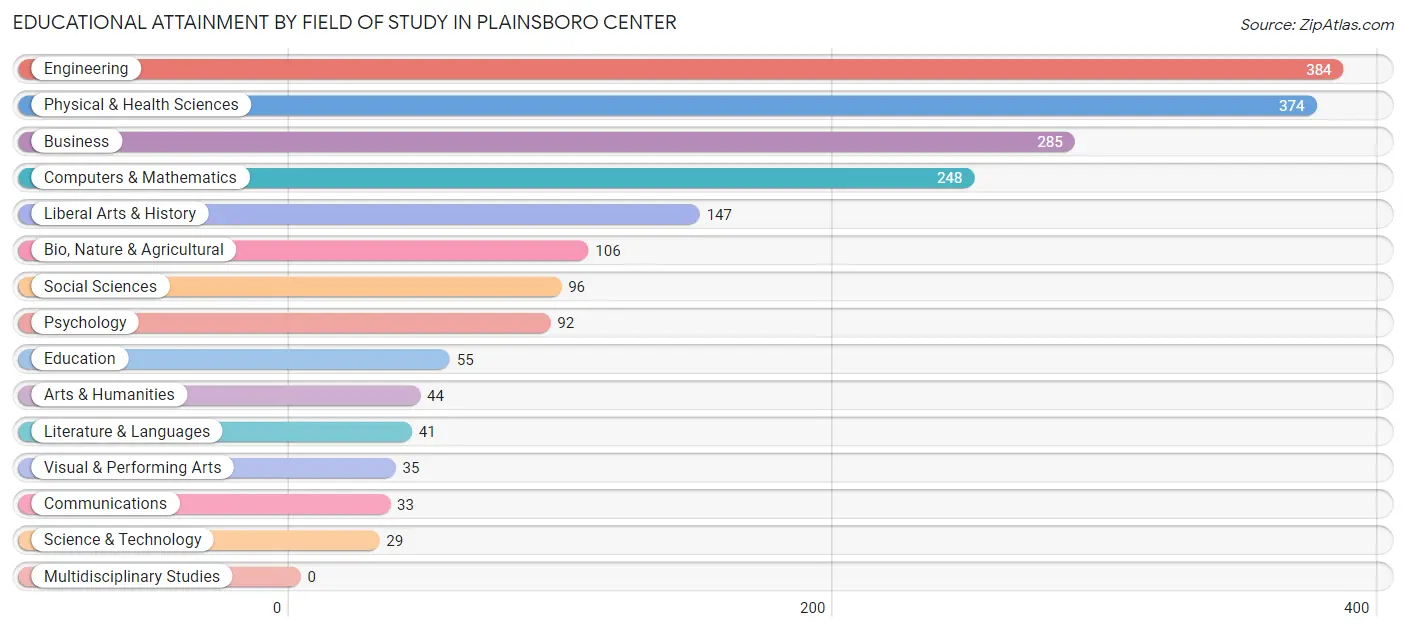
| Field of Study | # Graduates | % Graduates |
| Computers & Mathematics | 248 | 12.6% |
| Bio, Nature & Agricultural | 106 | 5.4% |
| Physical & Health Sciences | 374 | 19.0% |
| Psychology | 92 | 4.7% |
| Social Sciences | 96 | 4.9% |
| Engineering | 384 | 19.5% |
| Multidisciplinary Studies | 0 | 0.0% |
| Science & Technology | 29 | 1.5% |
| Business | 285 | 14.5% |
| Education | 55 | 2.8% |
| Literature & Languages | 41 | 2.1% |
| Liberal Arts & History | 147 | 7.5% |
| Visual & Performing Arts | 35 | 1.8% |
| Communications | 33 | 1.7% |
| Arts & Humanities | 44 | 2.2% |
| Total | 1,969 | 100.0% |
Transportation & Commute in Plainsboro Center
Vehicle Availability by Sex in Plainsboro Center
The most prevalent vehicle ownership categories in Plainsboro Center are males with 1 vehicle (730, accounting for 60.9%) and females with 1 vehicle (131, making up 145.4%).
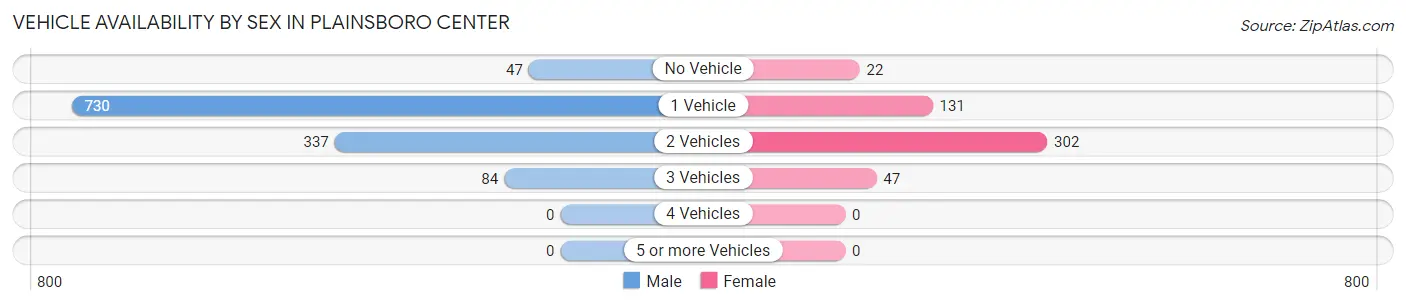
| Vehicles Available | Male | Female |
| No Vehicle | 47 (3.9%) | 22 (4.4%) |
| 1 Vehicle | 730 (60.9%) | 131 (26.1%) |
| 2 Vehicles | 337 (28.1%) | 302 (60.2%) |
| 3 Vehicles | 84 (7.0%) | 47 (9.4%) |
| 4 Vehicles | 0 (0.0%) | 0 (0.0%) |
| 5 or more Vehicles | 0 (0.0%) | 0 (0.0%) |
| Total | 1,198 (100.0%) | 502 (100.0%) |
Commute Time in Plainsboro Center
The most frequently occuring commute durations in Plainsboro Center are 10 to 14 minutes (174 commuters, 14.9%), 15 to 19 minutes (160 commuters, 13.7%), and 30 to 34 minutes (156 commuters, 13.4%).
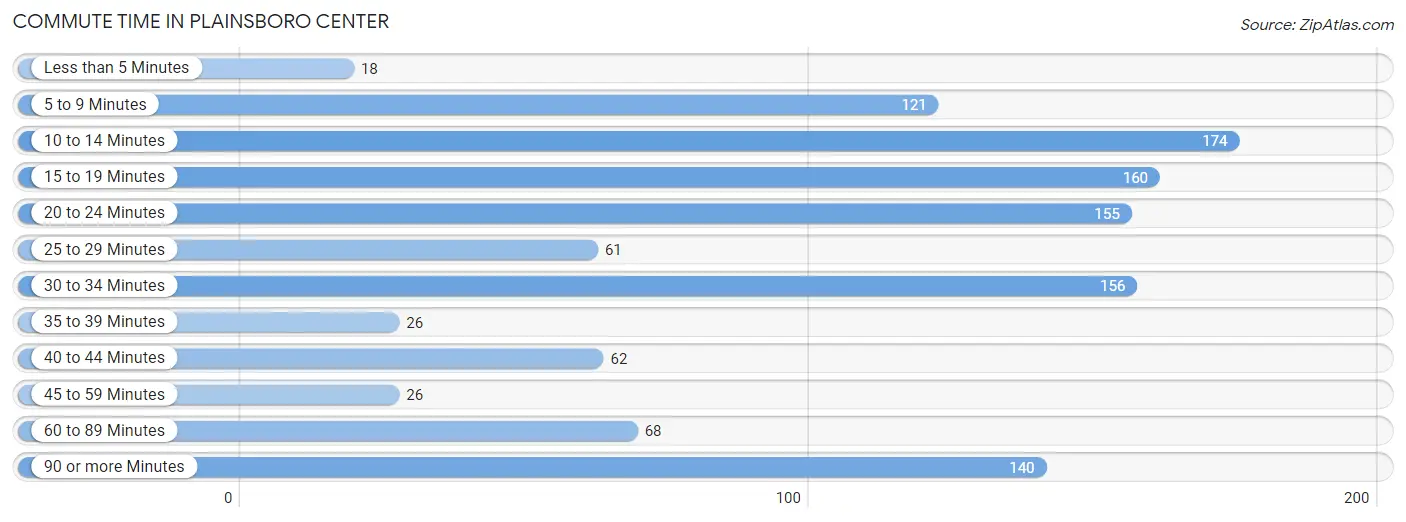
| Commute Time | # Commuters | % Commuters |
| Less than 5 Minutes | 18 | 1.5% |
| 5 to 9 Minutes | 121 | 10.4% |
| 10 to 14 Minutes | 174 | 14.9% |
| 15 to 19 Minutes | 160 | 13.7% |
| 20 to 24 Minutes | 155 | 13.3% |
| 25 to 29 Minutes | 61 | 5.2% |
| 30 to 34 Minutes | 156 | 13.4% |
| 35 to 39 Minutes | 26 | 2.2% |
| 40 to 44 Minutes | 62 | 5.3% |
| 45 to 59 Minutes | 26 | 2.2% |
| 60 to 89 Minutes | 68 | 5.8% |
| 90 or more Minutes | 140 | 12.0% |
Commute Time by Sex in Plainsboro Center
The most common commute times in Plainsboro Center are 30 to 34 minutes (123 commuters, 15.2%) for males and 10 to 14 minutes (86 commuters, 24.0%) for females.
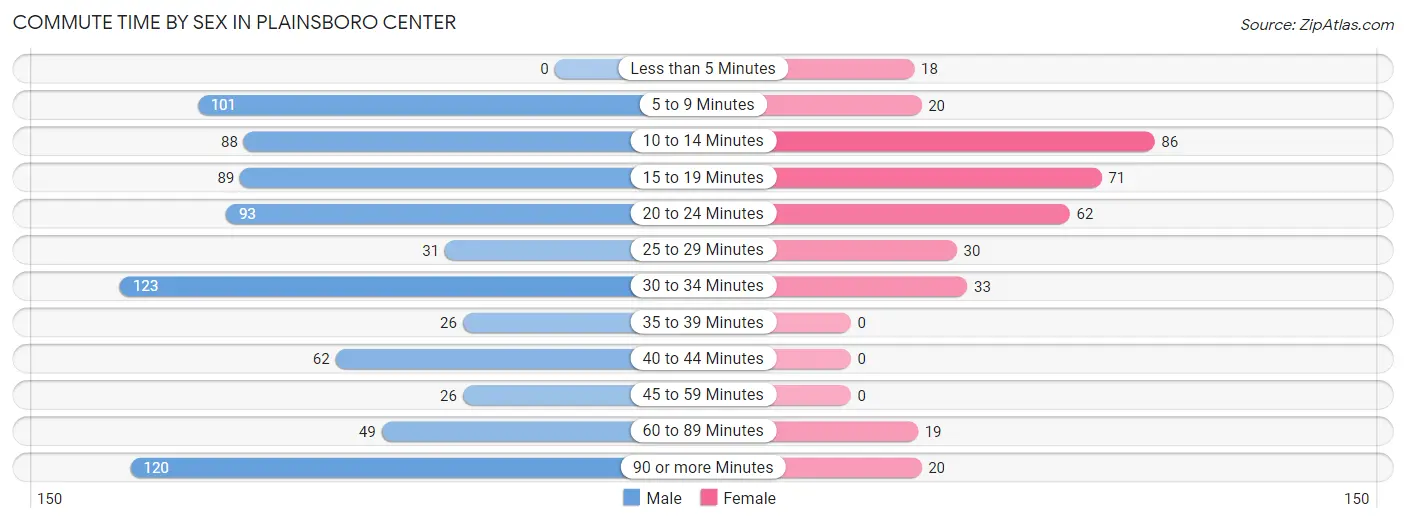
| Commute Time | Male | Female |
| Less than 5 Minutes | 0 (0.0%) | 18 (5.0%) |
| 5 to 9 Minutes | 101 (12.5%) | 20 (5.6%) |
| 10 to 14 Minutes | 88 (10.9%) | 86 (24.0%) |
| 15 to 19 Minutes | 89 (11.0%) | 71 (19.8%) |
| 20 to 24 Minutes | 93 (11.5%) | 62 (17.3%) |
| 25 to 29 Minutes | 31 (3.8%) | 30 (8.4%) |
| 30 to 34 Minutes | 123 (15.2%) | 33 (9.2%) |
| 35 to 39 Minutes | 26 (3.2%) | 0 (0.0%) |
| 40 to 44 Minutes | 62 (7.7%) | 0 (0.0%) |
| 45 to 59 Minutes | 26 (3.2%) | 0 (0.0%) |
| 60 to 89 Minutes | 49 (6.1%) | 19 (5.3%) |
| 90 or more Minutes | 120 (14.8%) | 20 (5.6%) |
Time of Departure to Work by Sex in Plainsboro Center
The most frequent times of departure to work in Plainsboro Center are 7:00 AM to 7:29 AM (227, 28.1%) for males and 8:00 AM to 8:29 AM (65, 18.1%) for females.
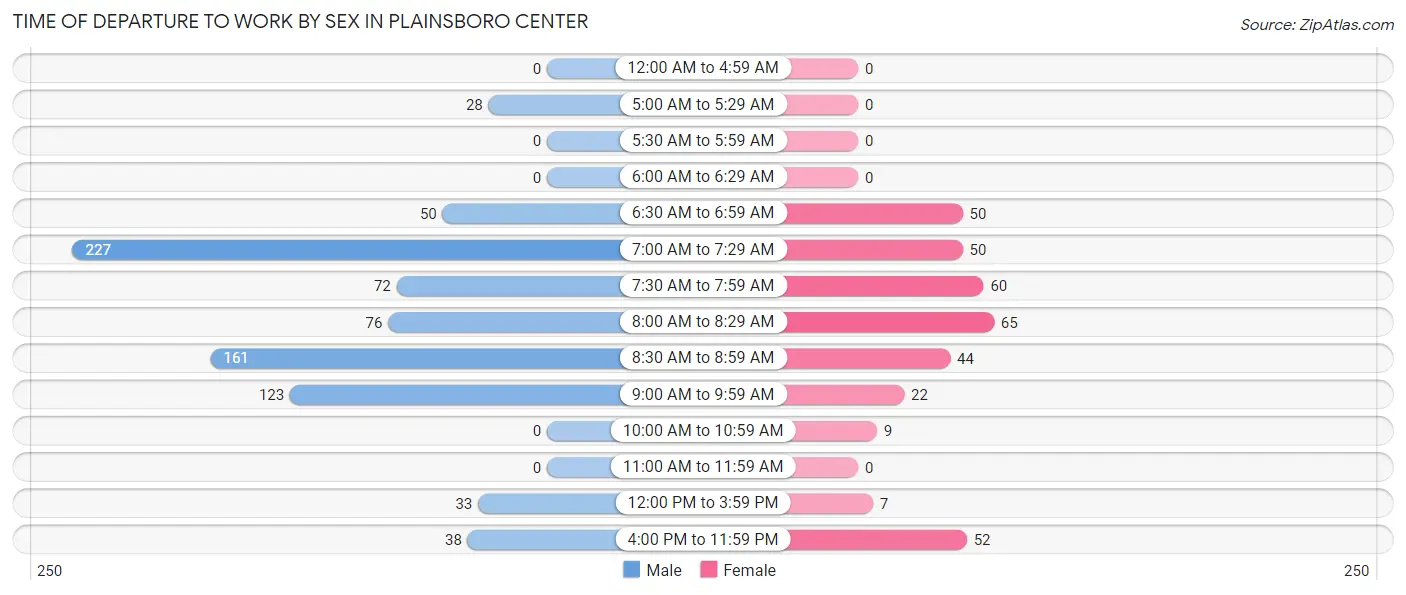
| Time of Departure | Male | Female |
| 12:00 AM to 4:59 AM | 0 (0.0%) | 0 (0.0%) |
| 5:00 AM to 5:29 AM | 28 (3.5%) | 0 (0.0%) |
| 5:30 AM to 5:59 AM | 0 (0.0%) | 0 (0.0%) |
| 6:00 AM to 6:29 AM | 0 (0.0%) | 0 (0.0%) |
| 6:30 AM to 6:59 AM | 50 (6.2%) | 50 (13.9%) |
| 7:00 AM to 7:29 AM | 227 (28.1%) | 50 (13.9%) |
| 7:30 AM to 7:59 AM | 72 (8.9%) | 60 (16.7%) |
| 8:00 AM to 8:29 AM | 76 (9.4%) | 65 (18.1%) |
| 8:30 AM to 8:59 AM | 161 (19.9%) | 44 (12.3%) |
| 9:00 AM to 9:59 AM | 123 (15.2%) | 22 (6.1%) |
| 10:00 AM to 10:59 AM | 0 (0.0%) | 9 (2.5%) |
| 11:00 AM to 11:59 AM | 0 (0.0%) | 0 (0.0%) |
| 12:00 PM to 3:59 PM | 33 (4.1%) | 7 (1.9%) |
| 4:00 PM to 11:59 PM | 38 (4.7%) | 52 (14.5%) |
| Total | 808 (100.0%) | 359 (100.0%) |
Housing Occupancy in Plainsboro Center
Occupancy by Ownership in Plainsboro Center
Of the total 1,456 dwellings in Plainsboro Center, owner-occupied units account for 466 (32.0%), while renter-occupied units make up 990 (68.0%).
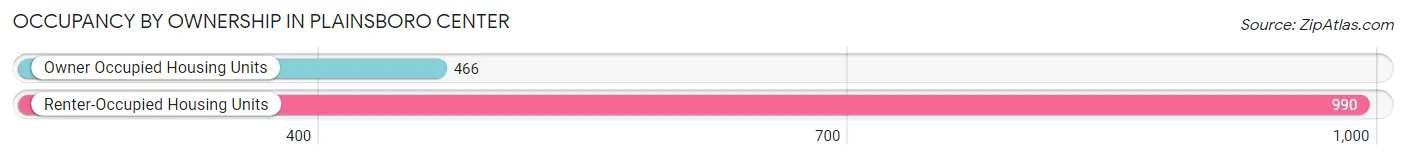
| Occupancy | # Housing Units | % Housing Units |
| Owner Occupied Housing Units | 466 | 32.0% |
| Renter-Occupied Housing Units | 990 | 68.0% |
| Total Occupied Housing Units | 1,456 | 100.0% |
Occupancy by Household Size in Plainsboro Center
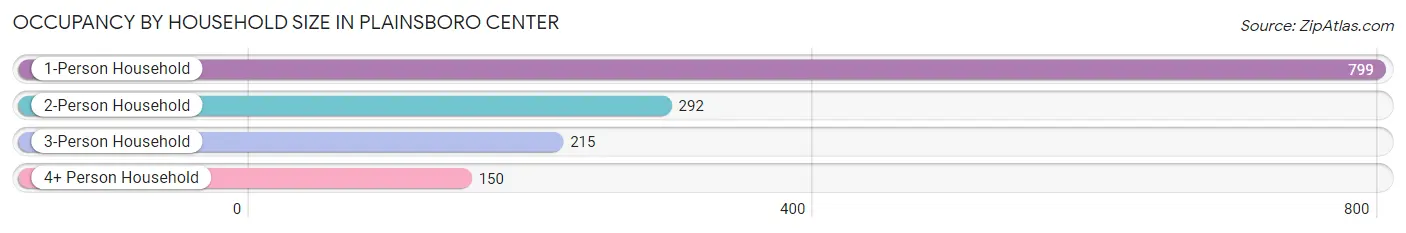
| Household Size | # Housing Units | % Housing Units |
| 1-Person Household | 799 | 54.9% |
| 2-Person Household | 292 | 20.1% |
| 3-Person Household | 215 | 14.8% |
| 4+ Person Household | 150 | 10.3% |
| Total Housing Units | 1,456 | 100.0% |
Occupancy by Ownership by Household Size in Plainsboro Center
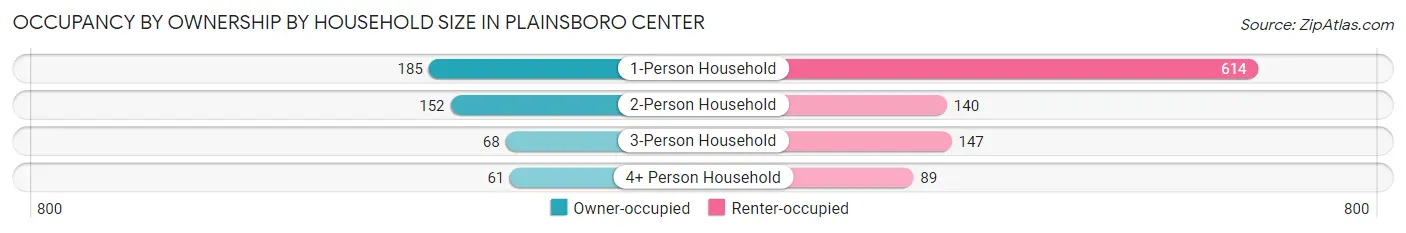
| Household Size | Owner-occupied | Renter-occupied |
| 1-Person Household | 185 (23.2%) | 614 (76.8%) |
| 2-Person Household | 152 (52.0%) | 140 (47.9%) |
| 3-Person Household | 68 (31.6%) | 147 (68.4%) |
| 4+ Person Household | 61 (40.7%) | 89 (59.3%) |
| Total Housing Units | 466 (32.0%) | 990 (68.0%) |
Occupancy by Educational Attainment in Plainsboro Center
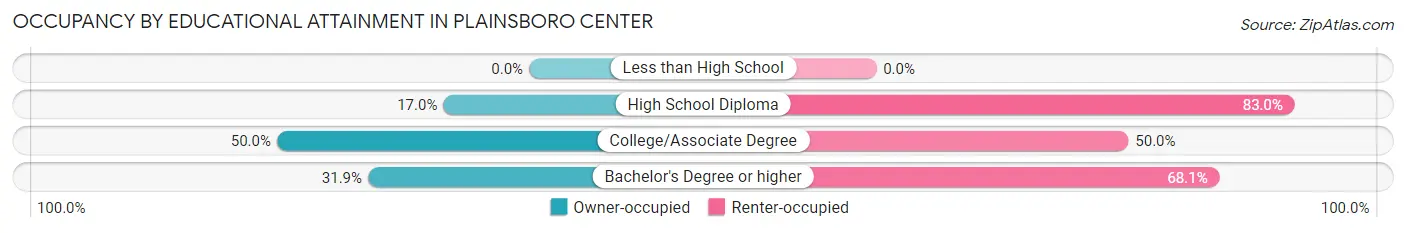
| Household Size | Owner-occupied | Renter-occupied |
| Less than High School | 0 (0.0%) | 0 (0.0%) |
| High School Diploma | 17 (17.0%) | 83 (83.0%) |
| College/Associate Degree | 44 (50.0%) | 44 (50.0%) |
| Bachelor's Degree or higher | 405 (31.9%) | 863 (68.1%) |
Occupancy by Age of Householder in Plainsboro Center
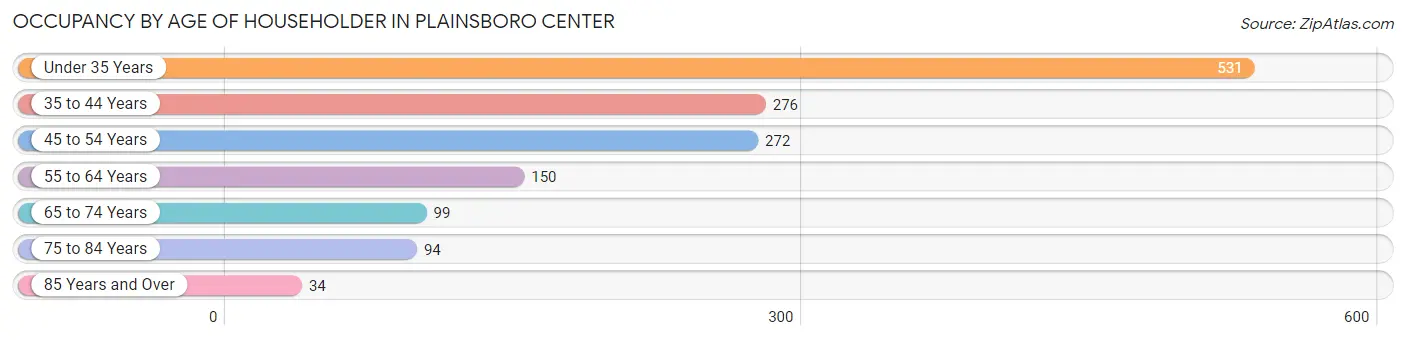
| Age Bracket | # Households | % Households |
| Under 35 Years | 531 | 36.5% |
| 35 to 44 Years | 276 | 19.0% |
| 45 to 54 Years | 272 | 18.7% |
| 55 to 64 Years | 150 | 10.3% |
| 65 to 74 Years | 99 | 6.8% |
| 75 to 84 Years | 94 | 6.5% |
| 85 Years and Over | 34 | 2.3% |
| Total | 1,456 | 100.0% |
Housing Finances in Plainsboro Center
Median Income by Occupancy in Plainsboro Center
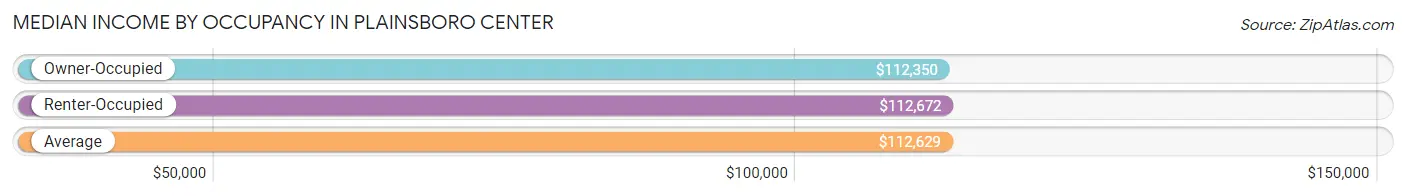
| Occupancy Type | # Households | Median Income |
| Owner-Occupied | 466 (32.0%) | $112,350 |
| Renter-Occupied | 990 (68.0%) | $112,672 |
| Average | 1,456 (100.0%) | $112,629 |
Occupancy by Householder Income Bracket in Plainsboro Center
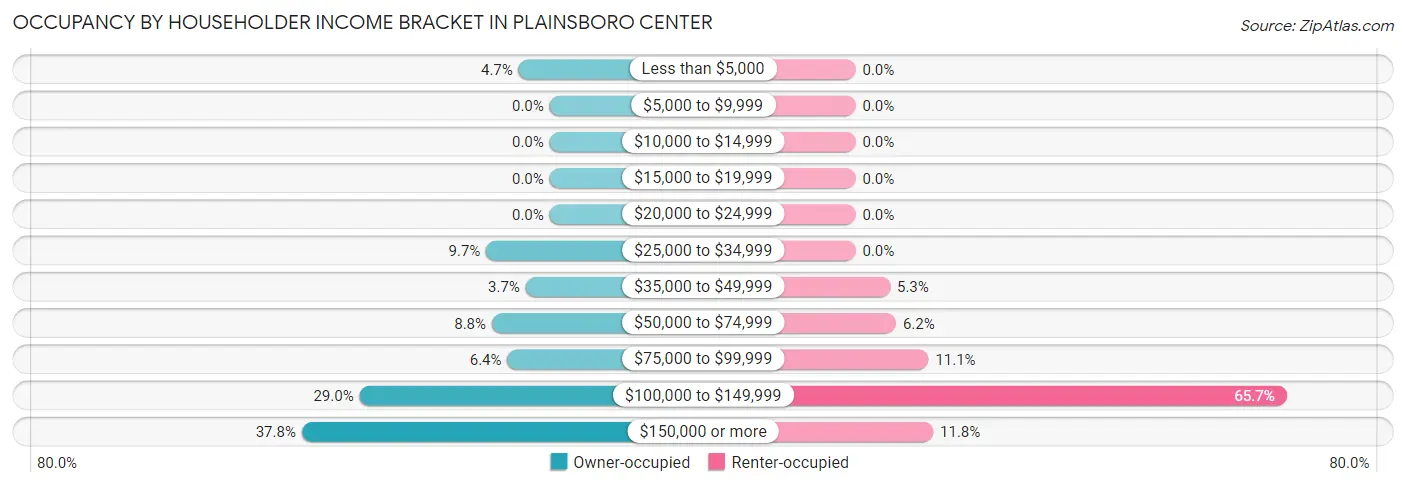
| Income Bracket | Owner-occupied | Renter-occupied |
| Less than $5,000 | 22 (4.7%) | 0 (0.0%) |
| $5,000 to $9,999 | 0 (0.0%) | 0 (0.0%) |
| $10,000 to $14,999 | 0 (0.0%) | 0 (0.0%) |
| $15,000 to $19,999 | 0 (0.0%) | 0 (0.0%) |
| $20,000 to $24,999 | 0 (0.0%) | 0 (0.0%) |
| $25,000 to $34,999 | 45 (9.7%) | 0 (0.0%) |
| $35,000 to $49,999 | 17 (3.6%) | 52 (5.2%) |
| $50,000 to $74,999 | 41 (8.8%) | 61 (6.2%) |
| $75,000 to $99,999 | 30 (6.4%) | 110 (11.1%) |
| $100,000 to $149,999 | 135 (29.0%) | 650 (65.7%) |
| $150,000 or more | 176 (37.8%) | 117 (11.8%) |
| Total | 466 (100.0%) | 990 (100.0%) |
Monthly Housing Cost Tiers in Plainsboro Center
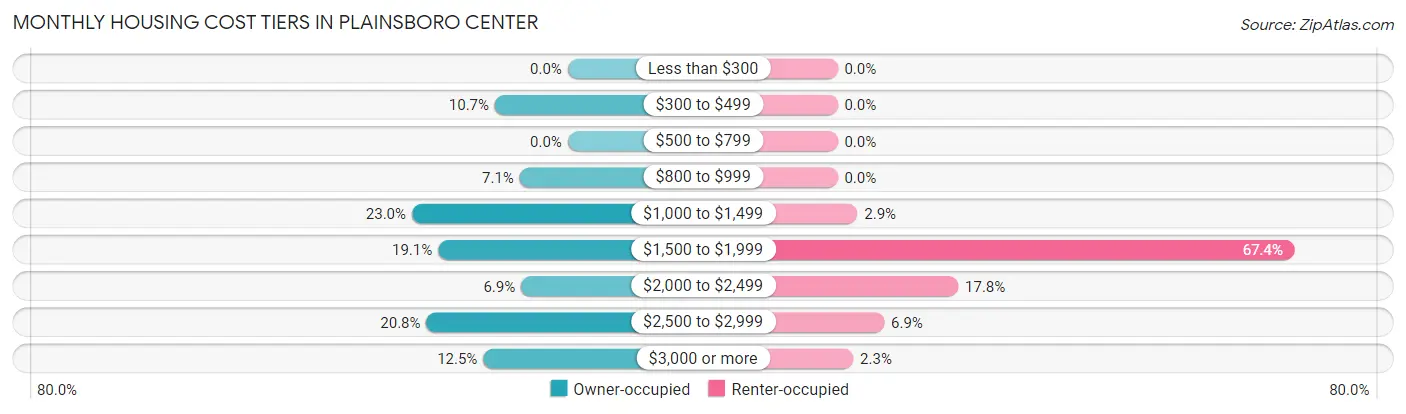
| Monthly Cost | Owner-occupied | Renter-occupied |
| Less than $300 | 0 (0.0%) | 0 (0.0%) |
| $300 to $499 | 50 (10.7%) | 0 (0.0%) |
| $500 to $799 | 0 (0.0%) | 0 (0.0%) |
| $800 to $999 | 33 (7.1%) | 0 (0.0%) |
| $1,000 to $1,499 | 107 (23.0%) | 29 (2.9%) |
| $1,500 to $1,999 | 89 (19.1%) | 667 (67.4%) |
| $2,000 to $2,499 | 32 (6.9%) | 176 (17.8%) |
| $2,500 to $2,999 | 97 (20.8%) | 68 (6.9%) |
| $3,000 or more | 58 (12.4%) | 23 (2.3%) |
| Total | 466 (100.0%) | 990 (100.0%) |
Physical Housing Characteristics in Plainsboro Center
Housing Structures in Plainsboro Center
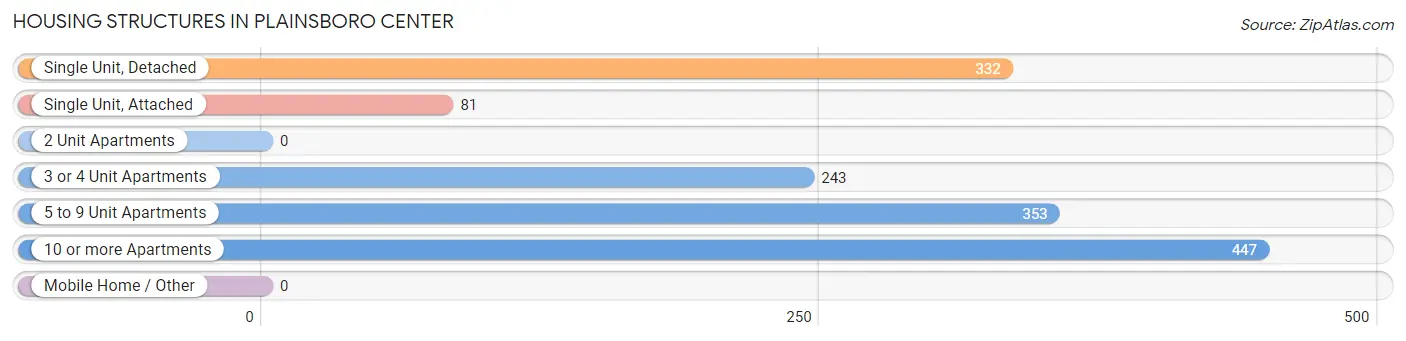
| Structure Type | # Housing Units | % Housing Units |
| Single Unit, Detached | 332 | 22.8% |
| Single Unit, Attached | 81 | 5.6% |
| 2 Unit Apartments | 0 | 0.0% |
| 3 or 4 Unit Apartments | 243 | 16.7% |
| 5 to 9 Unit Apartments | 353 | 24.2% |
| 10 or more Apartments | 447 | 30.7% |
| Mobile Home / Other | 0 | 0.0% |
| Total | 1,456 | 100.0% |
Housing Structures by Occupancy in Plainsboro Center
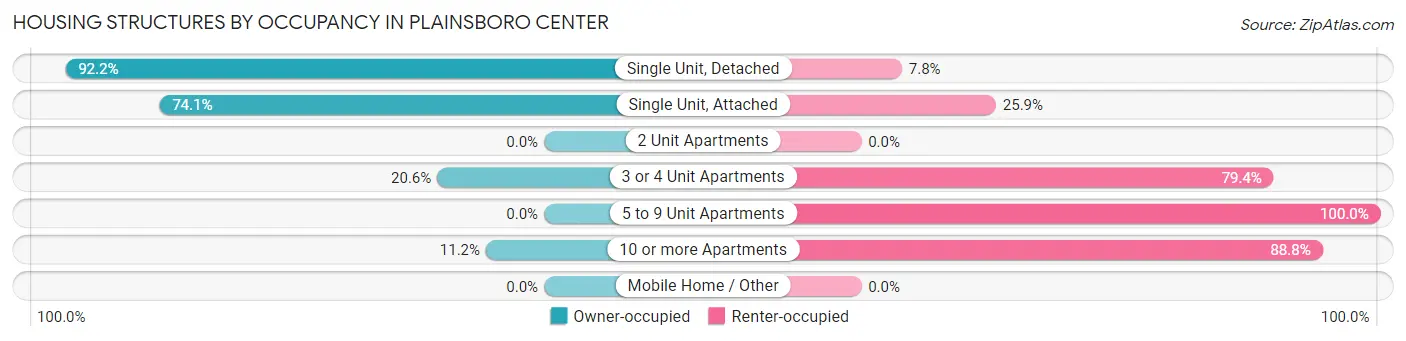
| Structure Type | Owner-occupied | Renter-occupied |
| Single Unit, Detached | 306 (92.2%) | 26 (7.8%) |
| Single Unit, Attached | 60 (74.1%) | 21 (25.9%) |
| 2 Unit Apartments | 0 (0.0%) | 0 (0.0%) |
| 3 or 4 Unit Apartments | 50 (20.6%) | 193 (79.4%) |
| 5 to 9 Unit Apartments | 0 (0.0%) | 353 (100.0%) |
| 10 or more Apartments | 50 (11.2%) | 397 (88.8%) |
| Mobile Home / Other | 0 (0.0%) | 0 (0.0%) |
| Total | 466 (32.0%) | 990 (68.0%) |
Housing Structures by Number of Rooms in Plainsboro Center
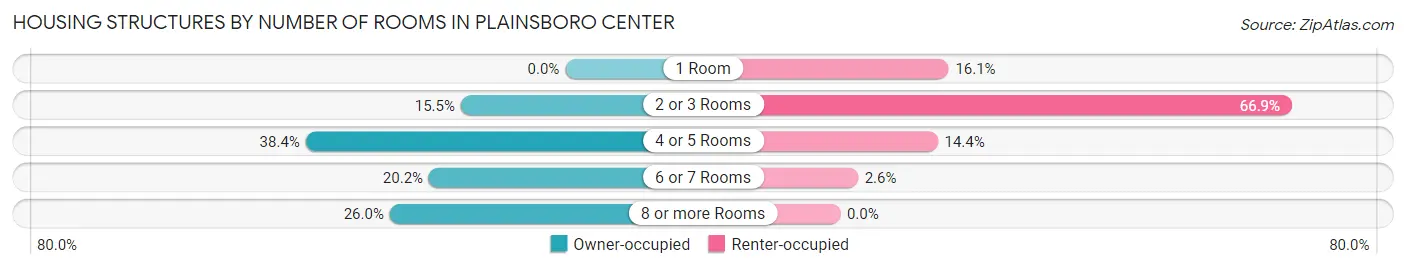
| Number of Rooms | Owner-occupied | Renter-occupied |
| 1 Room | 0 (0.0%) | 159 (16.1%) |
| 2 or 3 Rooms | 72 (15.4%) | 662 (66.9%) |
| 4 or 5 Rooms | 179 (38.4%) | 143 (14.4%) |
| 6 or 7 Rooms | 94 (20.2%) | 26 (2.6%) |
| 8 or more Rooms | 121 (26.0%) | 0 (0.0%) |
| Total | 466 (100.0%) | 990 (100.0%) |
Housing Structure by Heating Type in Plainsboro Center
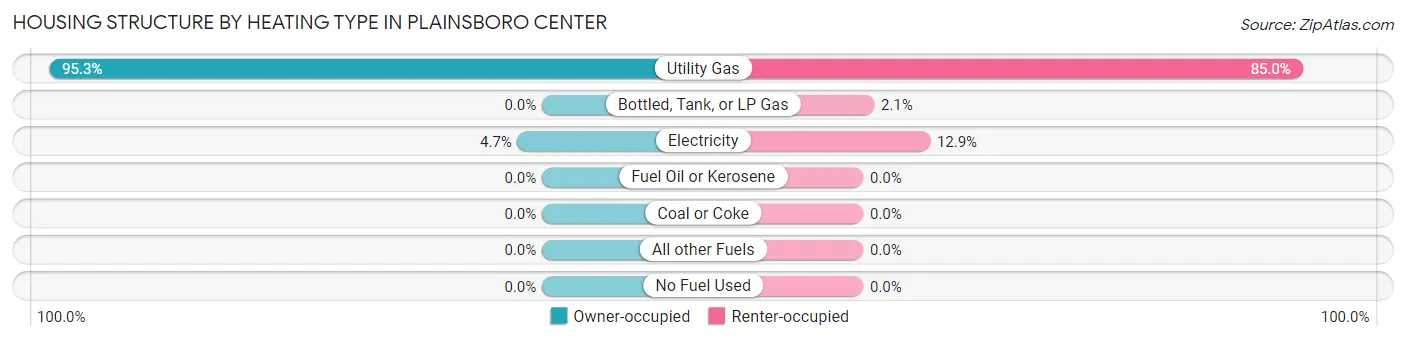
| Heating Type | Owner-occupied | Renter-occupied |
| Utility Gas | 444 (95.3%) | 841 (85.0%) |
| Bottled, Tank, or LP Gas | 0 (0.0%) | 21 (2.1%) |
| Electricity | 22 (4.7%) | 128 (12.9%) |
| Fuel Oil or Kerosene | 0 (0.0%) | 0 (0.0%) |
| Coal or Coke | 0 (0.0%) | 0 (0.0%) |
| All other Fuels | 0 (0.0%) | 0 (0.0%) |
| No Fuel Used | 0 (0.0%) | 0 (0.0%) |
| Total | 466 (100.0%) | 990 (100.0%) |
Household Vehicle Usage in Plainsboro Center
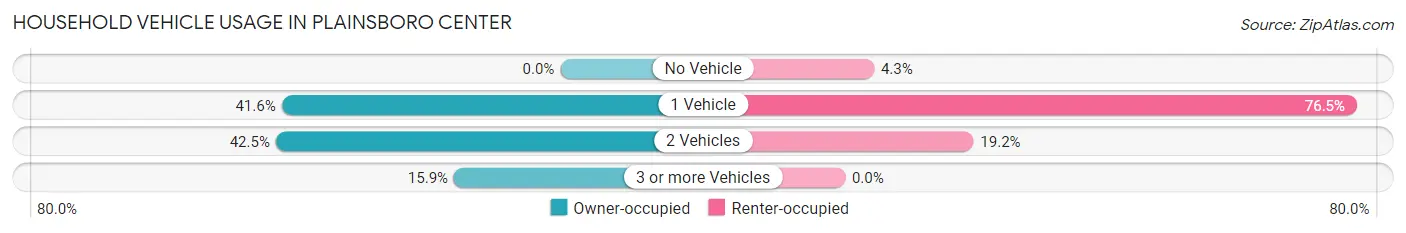
| Vehicles per Household | Owner-occupied | Renter-occupied |
| No Vehicle | 0 (0.0%) | 43 (4.3%) |
| 1 Vehicle | 194 (41.6%) | 757 (76.5%) |
| 2 Vehicles | 198 (42.5%) | 190 (19.2%) |
| 3 or more Vehicles | 74 (15.9%) | 0 (0.0%) |
| Total | 466 (100.0%) | 990 (100.0%) |
Real Estate & Mortgages in Plainsboro Center
Real Estate and Mortgage Overview in Plainsboro Center
| Characteristic | Without Mortgage | With Mortgage |
| Housing Units | 262 | 204 |
| Median Property Value | $428,700 | $517,500 |
| Median Household Income | $110,250 | $100 |
| Monthly Housing Costs | $1,135 | $58 |
| Real Estate Taxes | $10,001 | $0 |
Property Value by Mortgage Status in Plainsboro Center
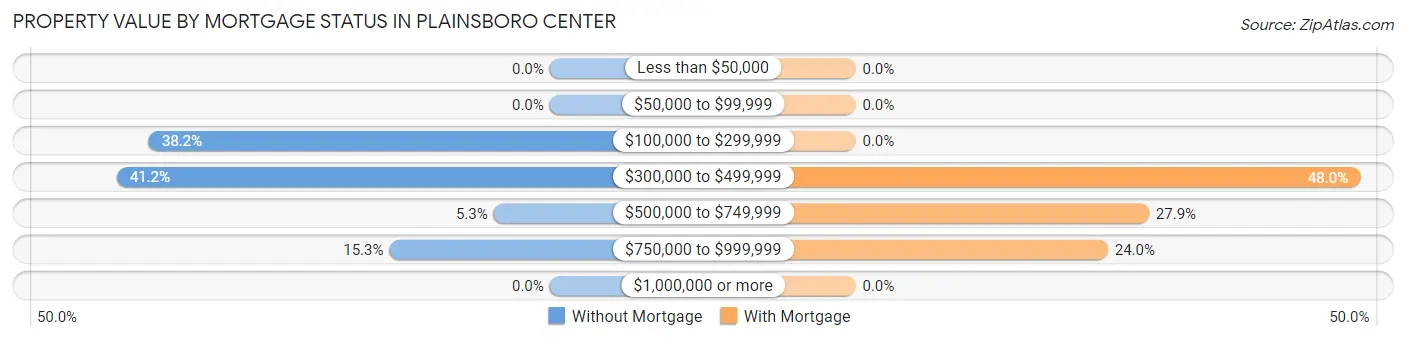
| Property Value | Without Mortgage | With Mortgage |
| Less than $50,000 | 0 (0.0%) | 0 (0.0%) |
| $50,000 to $99,999 | 0 (0.0%) | 0 (0.0%) |
| $100,000 to $299,999 | 100 (38.2%) | 0 (0.0%) |
| $300,000 to $499,999 | 108 (41.2%) | 98 (48.0%) |
| $500,000 to $749,999 | 14 (5.3%) | 57 (27.9%) |
| $750,000 to $999,999 | 40 (15.3%) | 49 (24.0%) |
| $1,000,000 or more | 0 (0.0%) | 0 (0.0%) |
| Total | 262 (100.0%) | 204 (100.0%) |
Household Income by Mortgage Status in Plainsboro Center
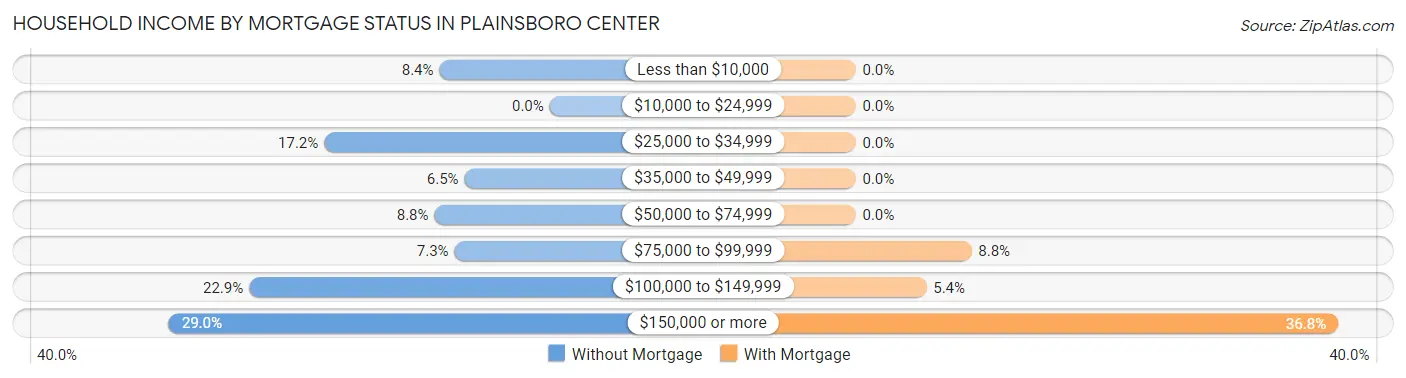
| Household Income | Without Mortgage | With Mortgage |
| Less than $10,000 | 22 (8.4%) | 0 (0.0%) |
| $10,000 to $24,999 | 0 (0.0%) | 0 (0.0%) |
| $25,000 to $34,999 | 45 (17.2%) | 0 (0.0%) |
| $35,000 to $49,999 | 17 (6.5%) | 0 (0.0%) |
| $50,000 to $74,999 | 23 (8.8%) | 0 (0.0%) |
| $75,000 to $99,999 | 19 (7.2%) | 18 (8.8%) |
| $100,000 to $149,999 | 60 (22.9%) | 11 (5.4%) |
| $150,000 or more | 76 (29.0%) | 75 (36.8%) |
| Total | 262 (100.0%) | 204 (100.0%) |
Property Value to Household Income Ratio in Plainsboro Center
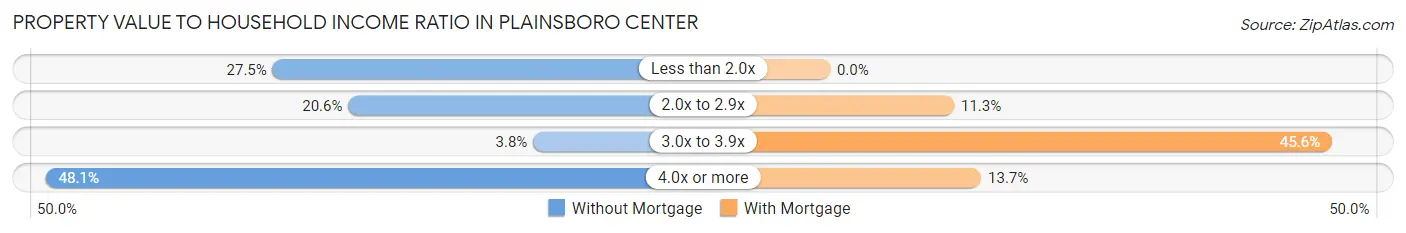
| Value-to-Income Ratio | Without Mortgage | With Mortgage |
| Less than 2.0x | 72 (27.5%) | 0 (0.0%) |
| 2.0x to 2.9x | 54 (20.6%) | 23 (11.3%) |
| 3.0x to 3.9x | 10 (3.8%) | 93 (45.6%) |
| 4.0x or more | 126 (48.1%) | 28 (13.7%) |
| Total | 262 (100.0%) | 204 (100.0%) |
Real Estate Taxes by Mortgage Status in Plainsboro Center
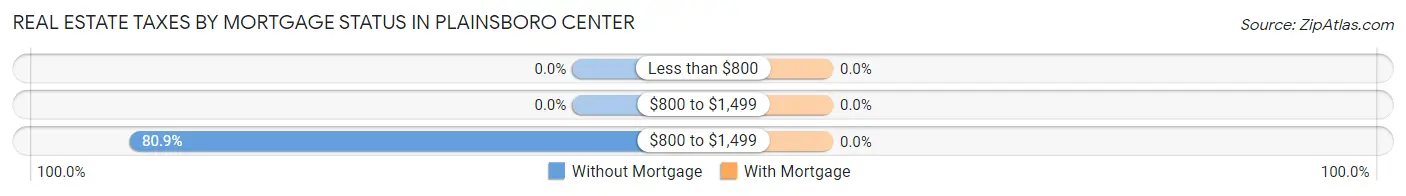
| Property Taxes | Without Mortgage | With Mortgage |
| Less than $800 | 0 (0.0%) | 0 (0.0%) |
| $800 to $1,499 | 0 (0.0%) | 0 (0.0%) |
| $800 to $1,499 | 212 (80.9%) | 0 (0.0%) |
| Total | 262 (100.0%) | 204 (100.0%) |
Health & Disability in Plainsboro Center
Health Insurance Coverage by Age in Plainsboro Center
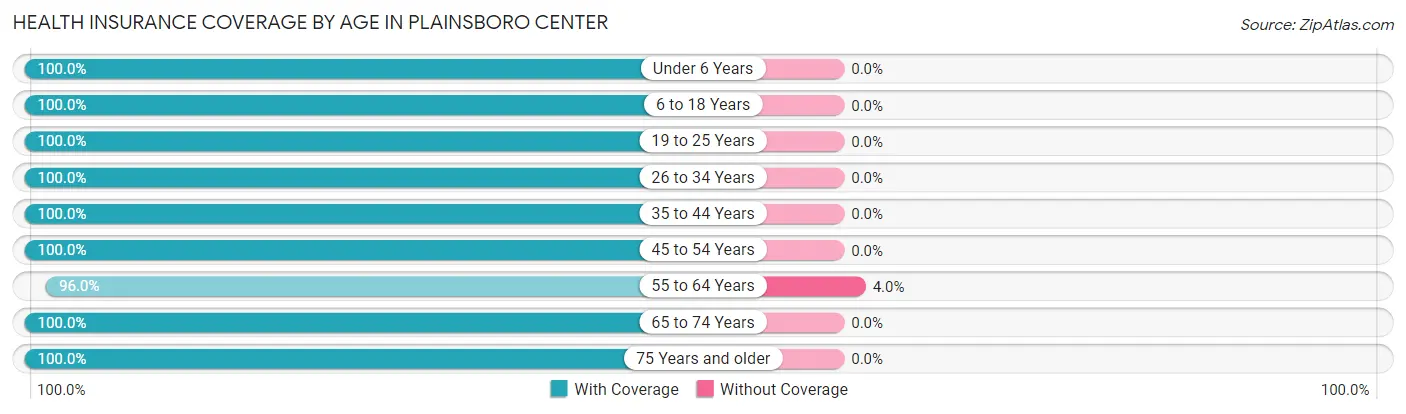
| Age Bracket | With Coverage | Without Coverage |
| Under 6 Years | 203 (100.0%) | 0 (0.0%) |
| 6 to 18 Years | 355 (100.0%) | 0 (0.0%) |
| 19 to 25 Years | 168 (100.0%) | 0 (0.0%) |
| 26 to 34 Years | 565 (100.0%) | 0 (0.0%) |
| 35 to 44 Years | 509 (100.0%) | 0 (0.0%) |
| 45 to 54 Years | 352 (100.0%) | 0 (0.0%) |
| 55 to 64 Years | 264 (96.0%) | 11 (4.0%) |
| 65 to 74 Years | 162 (100.0%) | 0 (0.0%) |
| 75 Years and older | 177 (100.0%) | 0 (0.0%) |
| Total | 2,755 (99.6%) | 11 (0.4%) |
Health Insurance Coverage by Citizenship Status in Plainsboro Center
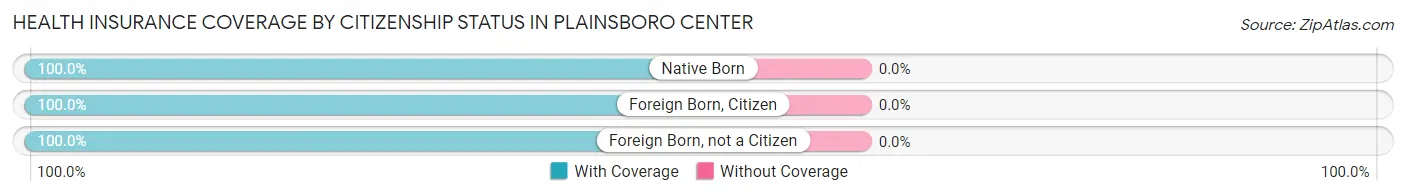
| Citizenship Status | With Coverage | Without Coverage |
| Native Born | 203 (100.0%) | 0 (0.0%) |
| Foreign Born, Citizen | 355 (100.0%) | 0 (0.0%) |
| Foreign Born, not a Citizen | 168 (100.0%) | 0 (0.0%) |
Health Insurance Coverage by Household Income in Plainsboro Center
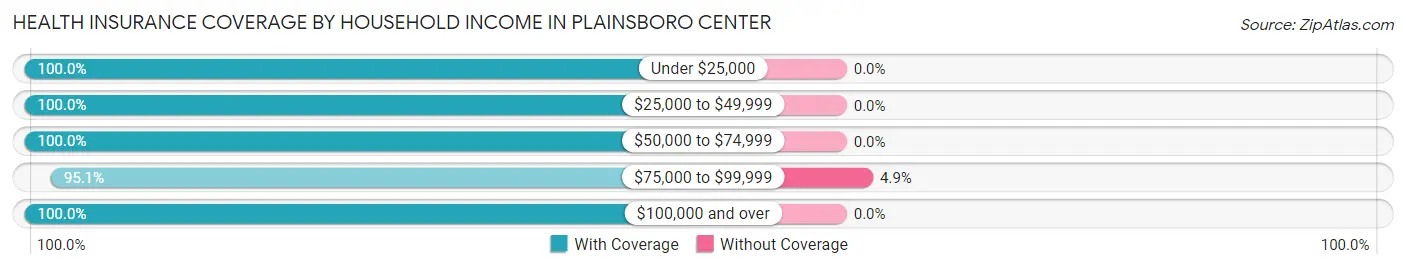
| Household Income | With Coverage | Without Coverage |
| Under $25,000 | 22 (100.0%) | 0 (0.0%) |
| $25,000 to $49,999 | 149 (100.0%) | 0 (0.0%) |
| $50,000 to $74,999 | 155 (100.0%) | 0 (0.0%) |
| $75,000 to $99,999 | 212 (95.1%) | 11 (4.9%) |
| $100,000 and over | 2,217 (100.0%) | 0 (0.0%) |
Public vs Private Health Insurance Coverage by Age in Plainsboro Center
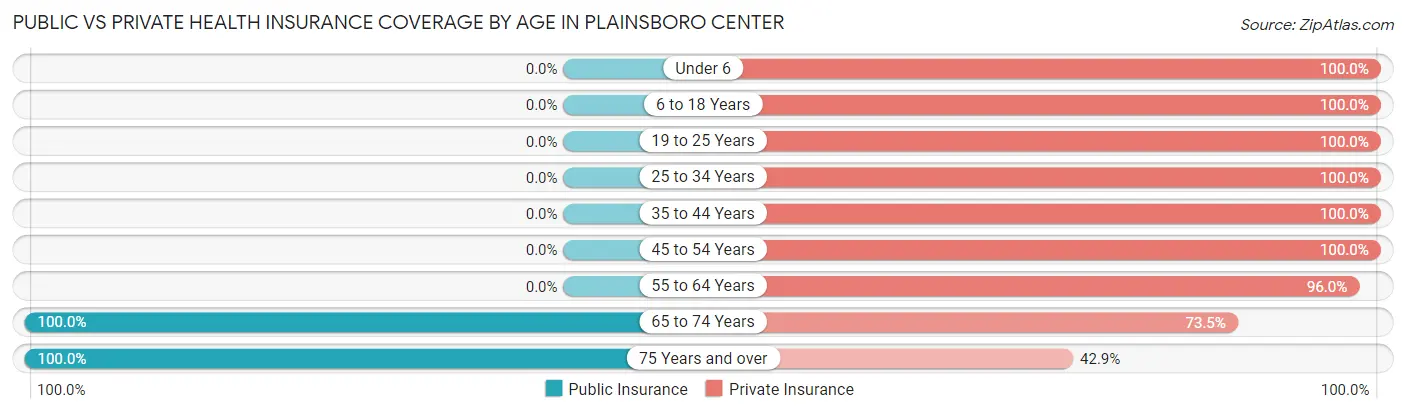
| Age Bracket | Public Insurance | Private Insurance |
| Under 6 | 0 (0.0%) | 203 (100.0%) |
| 6 to 18 Years | 0 (0.0%) | 355 (100.0%) |
| 19 to 25 Years | 0 (0.0%) | 168 (100.0%) |
| 25 to 34 Years | 0 (0.0%) | 565 (100.0%) |
| 35 to 44 Years | 0 (0.0%) | 509 (100.0%) |
| 45 to 54 Years | 0 (0.0%) | 352 (100.0%) |
| 55 to 64 Years | 0 (0.0%) | 264 (96.0%) |
| 65 to 74 Years | 162 (100.0%) | 119 (73.5%) |
| 75 Years and over | 177 (100.0%) | 76 (42.9%) |
| Total | 339 (12.3%) | 2,611 (94.4%) |
Disability Status by Sex by Age in Plainsboro Center
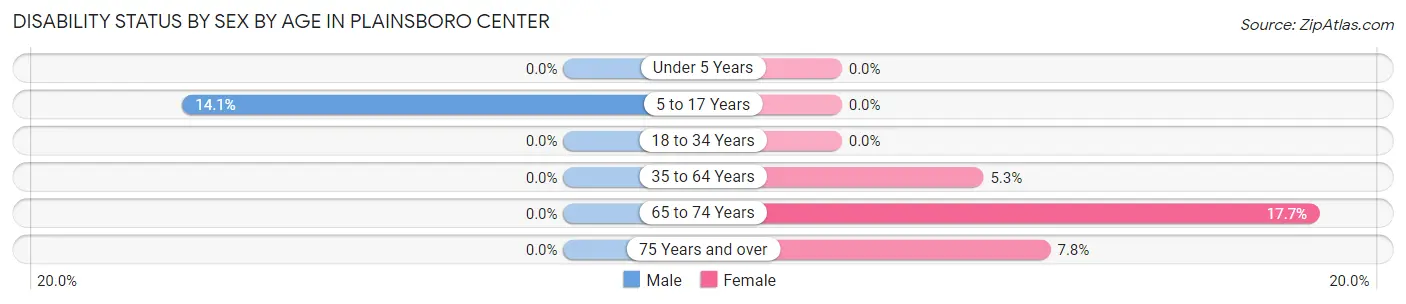
| Age Bracket | Male | Female |
| Under 5 Years | 0 (0.0%) | 0 (0.0%) |
| 5 to 17 Years | 27 (14.1%) | 0 (0.0%) |
| 18 to 34 Years | 0 (0.0%) | 0 (0.0%) |
| 35 to 64 Years | 0 (0.0%) | 23 (5.3%) |
| 65 to 74 Years | 0 (0.0%) | 17 (17.7%) |
| 75 Years and over | 0 (0.0%) | 11 (7.7%) |
Disability Class by Sex by Age in Plainsboro Center
Disability Class: Hearing Difficulty
| Age Bracket | Male | Female |
| Under 5 Years | 0 (0.0%) | 0 (0.0%) |
| 5 to 17 Years | 0 (0.0%) | 0 (0.0%) |
| 18 to 34 Years | 0 (0.0%) | 0 (0.0%) |
| 35 to 64 Years | 0 (0.0%) | 0 (0.0%) |
| 65 to 74 Years | 0 (0.0%) | 0 (0.0%) |
| 75 Years and over | 0 (0.0%) | 0 (0.0%) |
Disability Class: Vision Difficulty
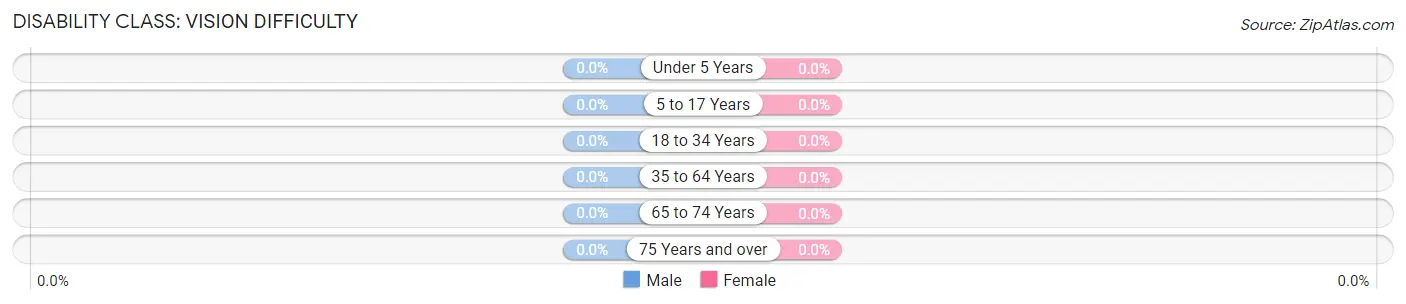
| Age Bracket | Male | Female |
| Under 5 Years | 0 (0.0%) | 0 (0.0%) |
| 5 to 17 Years | 0 (0.0%) | 0 (0.0%) |
| 18 to 34 Years | 0 (0.0%) | 0 (0.0%) |
| 35 to 64 Years | 0 (0.0%) | 0 (0.0%) |
| 65 to 74 Years | 0 (0.0%) | 0 (0.0%) |
| 75 Years and over | 0 (0.0%) | 0 (0.0%) |
Disability Class: Cognitive Difficulty
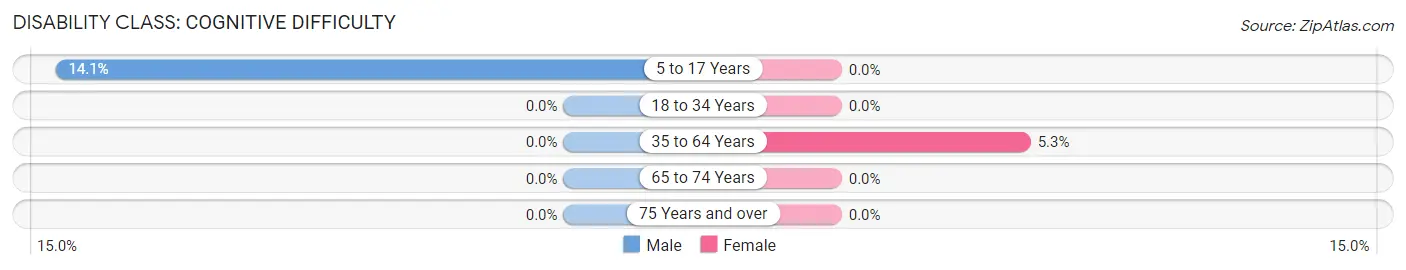
| Age Bracket | Male | Female |
| 5 to 17 Years | 27 (14.1%) | 0 (0.0%) |
| 18 to 34 Years | 0 (0.0%) | 0 (0.0%) |
| 35 to 64 Years | 0 (0.0%) | 23 (5.3%) |
| 65 to 74 Years | 0 (0.0%) | 0 (0.0%) |
| 75 Years and over | 0 (0.0%) | 0 (0.0%) |
Disability Class: Ambulatory Difficulty
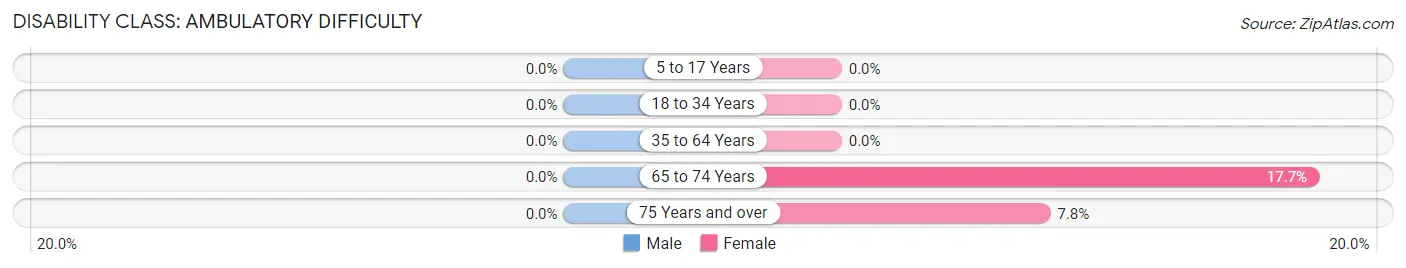
| Age Bracket | Male | Female |
| 5 to 17 Years | 0 (0.0%) | 0 (0.0%) |
| 18 to 34 Years | 0 (0.0%) | 0 (0.0%) |
| 35 to 64 Years | 0 (0.0%) | 0 (0.0%) |
| 65 to 74 Years | 0 (0.0%) | 17 (17.7%) |
| 75 Years and over | 0 (0.0%) | 11 (7.7%) |
Disability Class: Self-Care Difficulty
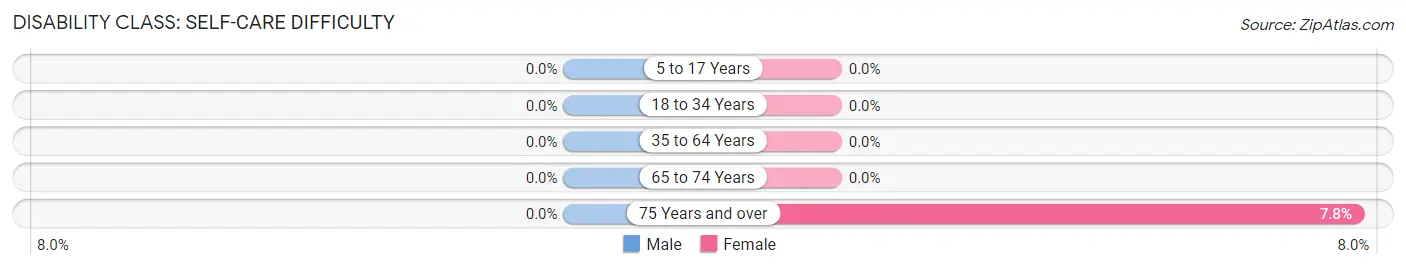
| Age Bracket | Male | Female |
| 5 to 17 Years | 0 (0.0%) | 0 (0.0%) |
| 18 to 34 Years | 0 (0.0%) | 0 (0.0%) |
| 35 to 64 Years | 0 (0.0%) | 0 (0.0%) |
| 65 to 74 Years | 0 (0.0%) | 0 (0.0%) |
| 75 Years and over | 0 (0.0%) | 11 (7.7%) |
Technology Access in Plainsboro Center
Computing Device Access in Plainsboro Center
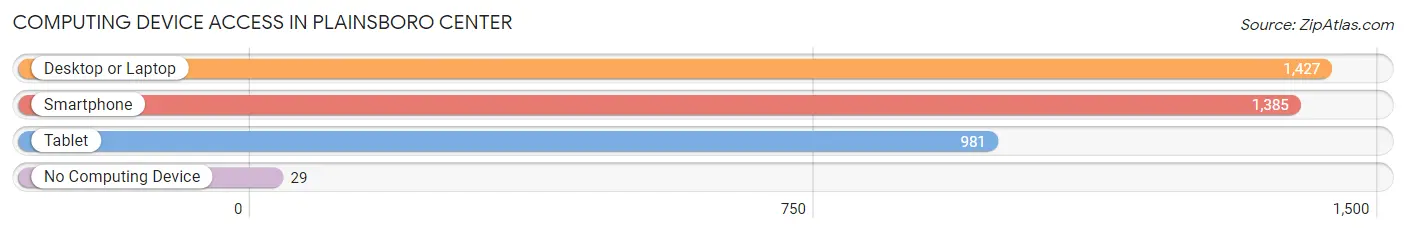
| Device Type | # Households | % Households |
| Desktop or Laptop | 1,427 | 98.0% |
| Smartphone | 1,385 | 95.1% |
| Tablet | 981 | 67.4% |
| No Computing Device | 29 | 2.0% |
| Total | 1,456 | 100.0% |
Internet Access in Plainsboro Center
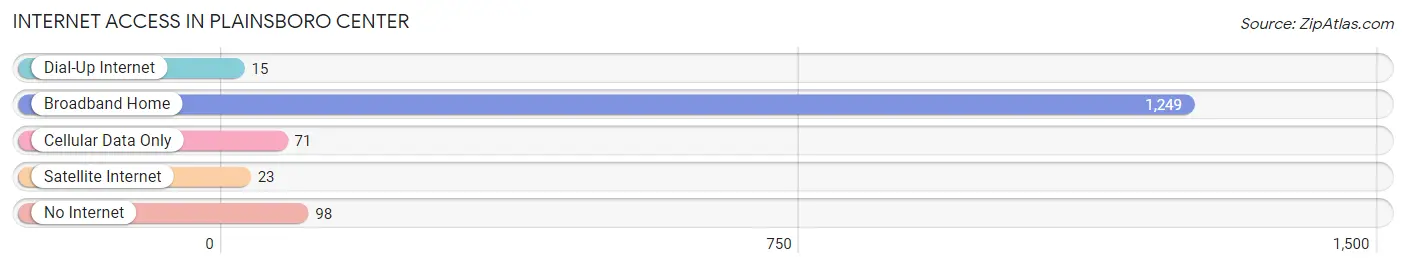
| Internet Type | # Households | % Households |
| Dial-Up Internet | 15 | 1.0% |
| Broadband Home | 1,249 | 85.8% |
| Cellular Data Only | 71 | 4.9% |
| Satellite Internet | 23 | 1.6% |
| No Internet | 98 | 6.7% |
| Total | 1,456 | 100.0% |
Plainsboro Center Summary
Plainsboro Center is a census-designated place (CDP) located in Middlesex County, New Jersey, United States. As of the 2010 United States Census, the CDP's population was 5,213.
Geography
Plainsboro Center is located at 40 21 17 North 74 35 17 West 40 354722 74 588333
According to the United States Census Bureau, the CDP had a total area of 1.945 square miles (5.033 km2), including 1.944 square miles (5.030 km2) of land and 0.001 square miles (0.003 km2) of water (0.05%).
History
Plainsboro Center was originally part of the large area of land known as the Plainsboro Township. The area was first settled in the late 1700s by Dutch and English settlers. The area was known as the "Plains" because of its flat terrain. The area was officially incorporated as Plainsboro Township in 1919.
In the 1950s, the area began to experience rapid growth due to the development of the nearby Princeton University and the surrounding area. This growth led to the creation of the Plainsboro Center CDP in 1980.
Economy
Plainsboro Center is home to a variety of businesses, including retail stores, restaurants, and professional services. The area is also home to several corporate offices, including those of Bristol-Myers Squibb, Johnson & Johnson, and Siemens.
Demographics
As of the 2010 United States Census, there were 5,213 people, 1,945 households, and 1,521 families residing in the CDP. The population density was 2,683.3 per square mile (1,037.2/km2). There were 2,039 housing units at an average density of 1,051.2 per square mile (406.3/km2). The racial makeup of the CDP was 68.2% White, 11.2% African American, 0.2% Native American, 15.7% Asian, 0.1% Pacific Islander, 2.2% from other races, and 2.5% from two or more races. Hispanic or Latino of any race were 8.2% of the population.
There were 1,945 households, out of which 37.2% had children under the age of 18 living with them, 63.2% were married couples living together, 8.2% had a female householder with no husband present, and 25.2% were non-families. 20.2% of all households were made up of individuals, and 6.2% had someone living alone who was 65 years of age or older. The average household size was 2.68 and the average family size was 3.13.
In the CDP, the population was spread out, with 25.2% under the age of 18, 6.2% from 18 to 24, 33.2% from 25 to 44, 24.2% from 45 to 64, and 11.2% who were 65 years of age or older. The median age was 37 years. For every 100 females, there were 94.2 males. For every 100 females age 18 and over, there were 91.2 males.
The median income for a household in the CDP was $90,972, and the median income for a family was $103,972. Males had a median income of $71,972 versus $50,972 for females. The per capita income for the CDP was $41,972. About 2.2% of families and 3.2% of the population were below the poverty line, including 3.2% of those under age 18 and 4.2% of those age 65 or over.
Common Questions
What is Per Capita Income in Plainsboro Center?
Per Capita income in Plainsboro Center is $72,247.
What is the Median Family Income in Plainsboro Center?
Median Family Income in Plainsboro Center is $150,040.
What is the Median Household income in Plainsboro Center?
Median Household Income in Plainsboro Center is $112,629.
What is Income or Wage Gap in Plainsboro Center?
Income or Wage Gap in Plainsboro Center is 40.0%.
Women in Plainsboro Center earn 60.0 cents for every dollar earned by a man.
What is Inequality or Gini Index in Plainsboro Center?
Inequality or Gini Index in Plainsboro Center is 0.30.
What is the Total Population of Plainsboro Center?
Total Population of Plainsboro Center is 2,766.
What is the Total Male Population of Plainsboro Center?
Total Male Population of Plainsboro Center is 1,587.
What is the Total Female Population of Plainsboro Center?
Total Female Population of Plainsboro Center is 1,179.
What is the Ratio of Males per 100 Females in Plainsboro Center?
There are 134.61 Males per 100 Females in Plainsboro Center.
What is the Ratio of Females per 100 Males in Plainsboro Center?
There are 74.29 Females per 100 Males in Plainsboro Center.
What is the Median Population Age in Plainsboro Center?
Median Population Age in Plainsboro Center is 36.7 Years.
What is the Average Family Size in Plainsboro Center
Average Family Size in Plainsboro Center is 3.1 People.
What is the Average Household Size in Plainsboro Center
Average Household Size in Plainsboro Center is 1.9 People.
How Large is the Labor Force in Plainsboro Center?
There are 1,766 People in the Labor Forcein in Plainsboro Center.
What is the Percentage of People in the Labor Force in Plainsboro Center?
77.9% of People are in the Labor Force in Plainsboro Center.
What is the Unemployment Rate in Plainsboro Center?
Unemployment Rate in Plainsboro Center is 2.7%.