Cities with the Highest Percentage of Eastern European Population in New Jersey
RELATED REPORTS & OPTIONS
Eastern European
New Jersey
Compare Cities
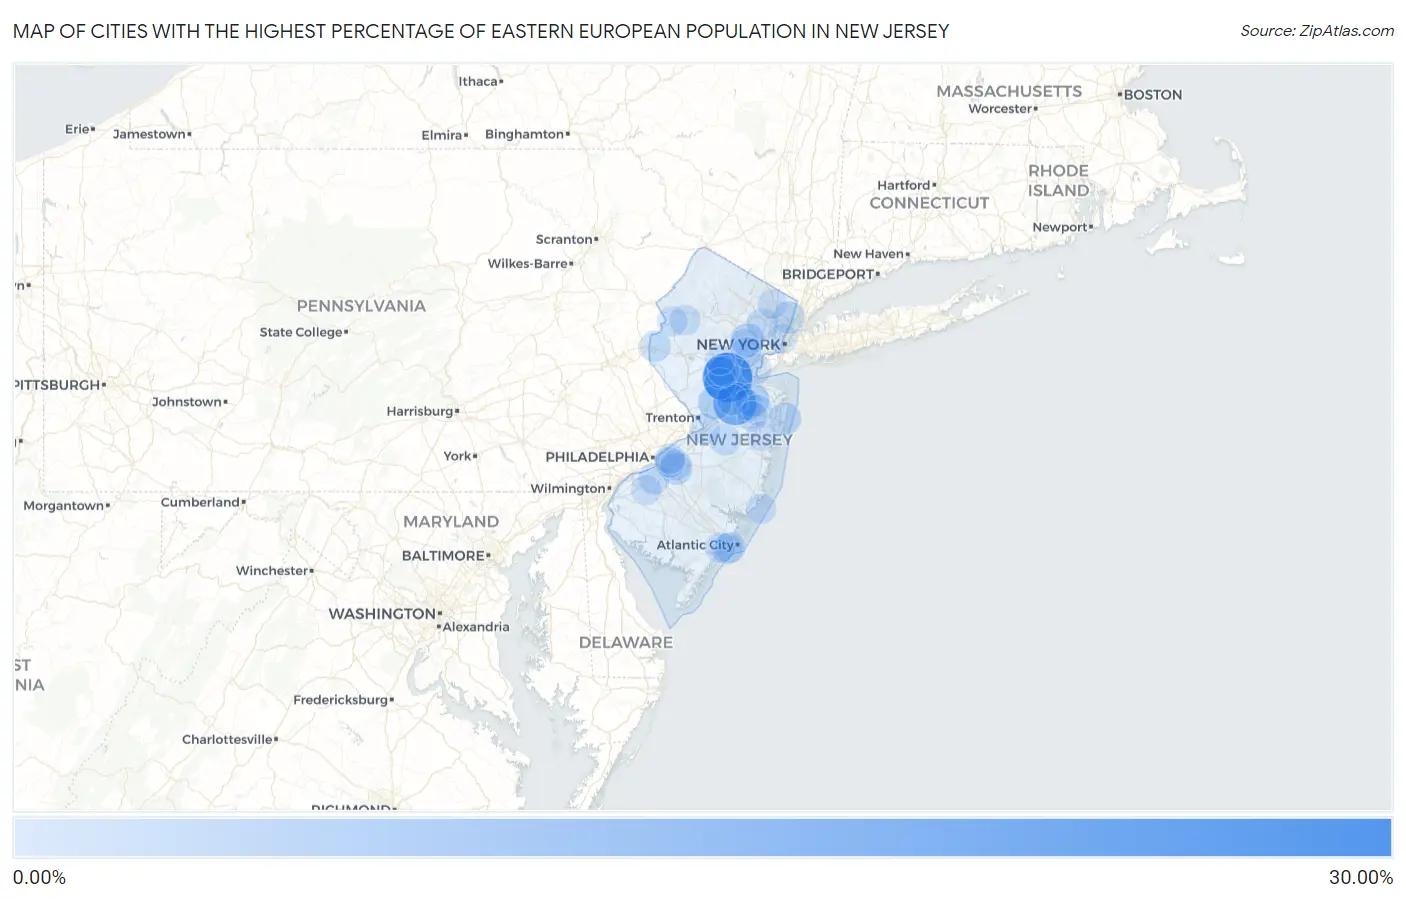
Map of Cities with the Highest Percentage of Eastern European Population in New Jersey
0.00%
30.00%
Cities with the Highest Percentage of Eastern European Population in New Jersey
| City | Eastern European | vs State | vs National | |
| 1. | Clyde | 27.63% | 0.66%(+27.0)#1 | 0.30%(+27.3)#14 |
| 2. | Windsor | 27.13% | 0.66%(+26.5)#2 | 0.30%(+26.8)#15 |
| 3. | Stonebridge | 21.66% | 0.66%(+21.0)#3 | 0.30%(+21.4)#19 |
| 4. | Concordia | 18.63% | 0.66%(+18.0)#4 | 0.30%(+18.3)#21 |
| 5. | Pottersville | 16.24% | 0.66%(+15.6)#5 | 0.30%(+15.9)#29 |
| 6. | Oldwick | 10.78% | 0.66%(+10.1)#6 | 0.30%(+10.5)#42 |
| 7. | Glen Rock Borough | 8.06% | 0.66%(+7.40)#7 | 0.30%(+7.76)#61 |
| 8. | The Ponds | 6.98% | 0.66%(+6.32)#8 | 0.30%(+6.68)#82 |
| 9. | Princeton Junction | 6.38% | 0.66%(+5.72)#9 | 0.30%(+6.08)#90 |
| 10. | Robertsville | 6.10% | 0.66%(+5.45)#10 | 0.30%(+5.80)#101 |
| 11. | Pleasantdale | 5.65% | 0.66%(+4.99)#11 | 0.30%(+5.34)#118 |
| 12. | Short Hills | 5.45% | 0.66%(+4.80)#12 | 0.30%(+5.15)#126 |
| 13. | Tenafly Borough | 4.77% | 0.66%(+4.11)#13 | 0.30%(+4.47)#172 |
| 14. | Ship Bottom Borough | 4.72% | 0.66%(+4.07)#14 | 0.30%(+4.42)#176 |
| 15. | Woodcliff Lake Borough | 4.45% | 0.66%(+3.79)#15 | 0.30%(+4.14)#200 |
| 16. | Englewood | 4.38% | 0.66%(+3.72)#16 | 0.30%(+4.08)#207 |
| 17. | Ocean Grove | 4.35% | 0.66%(+3.69)#17 | 0.30%(+4.04)#211 |
| 18. | Demarest Borough | 4.12% | 0.66%(+3.46)#18 | 0.30%(+3.81)#227 |
| 19. | Springdale | 4.03% | 0.66%(+3.37)#19 | 0.30%(+3.72)#239 |
| 20. | Franklin Lakes Borough | 4.00% | 0.66%(+3.34)#20 | 0.30%(+3.69)#242 |
| 21. | Weston | 3.78% | 0.66%(+3.12)#21 | 0.30%(+3.47)#266 |
| 22. | Oceanport Borough | 3.64% | 0.66%(+2.99)#22 | 0.30%(+3.34)#279 |
| 23. | Longport Borough | 3.48% | 0.66%(+2.82)#23 | 0.30%(+3.18)#301 |
| 24. | Newfoundland | 3.42% | 0.66%(+2.77)#24 | 0.30%(+3.12)#312 |
| 25. | Regency At Monroe | 3.36% | 0.66%(+2.71)#25 | 0.30%(+3.06)#319 |
| 26. | Towaco | 3.33% | 0.66%(+2.67)#26 | 0.30%(+3.03)#323 |
| 27. | Closter Borough | 3.13% | 0.66%(+2.47)#27 | 0.30%(+2.83)#351 |
| 28. | Lopatcong Overlook | 3.06% | 0.66%(+2.41)#28 | 0.30%(+2.76)#366 |
| 29. | Green | 3.06% | 0.66%(+2.40)#29 | 0.30%(+2.76)#367 |
| 30. | Pleasant Plains | 3.05% | 0.66%(+2.39)#30 | 0.30%(+2.74)#369 |
| 31. | Shrewsbury Borough | 3.00% | 0.66%(+2.34)#31 | 0.30%(+2.69)#379 |
| 32. | Upper Montclair | 2.98% | 0.66%(+2.32)#32 | 0.30%(+2.68)#381 |
| 33. | Oak Valley | 2.97% | 0.66%(+2.31)#33 | 0.30%(+2.66)#383 |
| 34. | Deans | 2.76% | 0.66%(+2.11)#34 | 0.30%(+2.46)#418 |
| 35. | Margate City | 2.72% | 0.66%(+2.06)#35 | 0.30%(+2.42)#431 |
| 36. | New Egypt | 2.71% | 0.66%(+2.05)#36 | 0.30%(+2.40)#436 |
| 37. | River Edge Borough | 2.69% | 0.66%(+2.03)#37 | 0.30%(+2.38)#439 |
| 38. | Lyons | 2.69% | 0.66%(+2.03)#38 | 0.30%(+2.38)#440 |
| 39. | Titusville | 2.68% | 0.66%(+2.02)#39 | 0.30%(+2.38)#441 |
| 40. | Lake Como Borough | 2.63% | 0.66%(+1.97)#40 | 0.30%(+2.33)#452 |
| 41. | Stanhope Borough | 2.55% | 0.66%(+1.89)#41 | 0.30%(+2.24)#474 |
| 42. | Encore At Monroe | 2.55% | 0.66%(+1.89)#42 | 0.30%(+2.24)#475 |
| 43. | Vienna | 2.48% | 0.66%(+1.82)#43 | 0.30%(+2.18)#487 |
| 44. | Rockleigh Borough | 2.47% | 0.66%(+1.81)#44 | 0.30%(+2.17)#491 |
| 45. | Renaissance At Monroe | 2.46% | 0.66%(+1.80)#45 | 0.30%(+2.16)#497 |
| 46. | South Seaville | 2.45% | 0.66%(+1.79)#46 | 0.30%(+2.14)#504 |
| 47. | Allenhurst Borough | 2.43% | 0.66%(+1.77)#47 | 0.30%(+2.12)#508 |
| 48. | North Caldwell Borough | 2.42% | 0.66%(+1.76)#48 | 0.30%(+2.11)#512 |
| 49. | Yorketown | 2.41% | 0.66%(+1.76)#49 | 0.30%(+2.11)#513 |
| 50. | Rossmoor | 2.34% | 0.66%(+1.69)#50 | 0.30%(+2.04)#540 |
| 51. | Franklin Center | 2.33% | 0.66%(+1.67)#51 | 0.30%(+2.02)#543 |
| 52. | Greentree | 2.31% | 0.66%(+1.66)#52 | 0.30%(+2.01)#551 |
| 53. | Lake Hopatcong | 2.28% | 0.66%(+1.62)#53 | 0.30%(+1.98)#567 |
| 54. | East Freehold | 2.25% | 0.66%(+1.59)#54 | 0.30%(+1.95)#587 |
| 55. | Atlantic Highlands Borough | 2.25% | 0.66%(+1.59)#55 | 0.30%(+1.94)#591 |
| 56. | Ventnor City | 2.20% | 0.66%(+1.54)#56 | 0.30%(+1.89)#611 |
| 57. | Harrington Park Borough | 2.20% | 0.66%(+1.54)#57 | 0.30%(+1.89)#612 |
| 58. | Sewaren | 2.19% | 0.66%(+1.53)#58 | 0.30%(+1.89)#614 |
| 59. | Bordentown | 2.18% | 0.66%(+1.52)#59 | 0.30%(+1.88)#616 |
| 60. | Rocky Hill Borough | 2.14% | 0.66%(+1.48)#60 | 0.30%(+1.84)#632 |
| 61. | Watchung Borough | 2.10% | 0.66%(+1.45)#61 | 0.30%(+1.80)#646 |
| 62. | Ellisburg | 2.10% | 0.66%(+1.44)#62 | 0.30%(+1.80)#647 |
| 63. | Ledgewood | 2.09% | 0.66%(+1.44)#63 | 0.30%(+1.79)#650 |
| 64. | Westfield | 2.09% | 0.66%(+1.43)#64 | 0.30%(+1.78)#656 |
| 65. | Westville Borough | 2.08% | 0.66%(+1.42)#65 | 0.30%(+1.78)#660 |
| 66. | Audubon Park Borough | 2.04% | 0.66%(+1.38)#66 | 0.30%(+1.73)#682 |
| 67. | Califon Borough | 2.02% | 0.66%(+1.37)#67 | 0.30%(+1.72)#693 |
| 68. | Linwood | 1.97% | 0.66%(+1.31)#68 | 0.30%(+1.67)#713 |
| 69. | Highland Park Borough | 1.96% | 0.66%(+1.30)#69 | 0.30%(+1.66)#720 |
| 70. | Summit | 1.96% | 0.66%(+1.30)#70 | 0.30%(+1.66)#721 |
| 71. | Mullica Hill | 1.95% | 0.66%(+1.30)#71 | 0.30%(+1.65)#730 |
| 72. | Oradell Borough | 1.95% | 0.66%(+1.29)#72 | 0.30%(+1.65)#733 |
| 73. | Cherry Hill Mall | 1.94% | 0.66%(+1.29)#73 | 0.30%(+1.64)#740 |
| 74. | Gillette | 1.92% | 0.66%(+1.26)#74 | 0.30%(+1.62)#749 |
| 75. | North Beach Haven | 1.91% | 0.66%(+1.25)#75 | 0.30%(+1.61)#752 |
| 76. | Metuchen Borough | 1.88% | 0.66%(+1.22)#76 | 0.30%(+1.57)#770 |
| 77. | Fair Lawn Borough | 1.87% | 0.66%(+1.21)#77 | 0.30%(+1.56)#775 |
| 78. | Alpine Borough | 1.86% | 0.66%(+1.21)#78 | 0.30%(+1.56)#780 |
| 79. | Mountain Lake | 1.84% | 0.66%(+1.18)#79 | 0.30%(+1.54)#790 |
| 80. | Oceanville | 1.82% | 0.66%(+1.16)#80 | 0.30%(+1.51)#806 |
| 81. | Sussex Borough | 1.72% | 0.66%(+1.06)#81 | 0.30%(+1.42)#852 |
| 82. | The Hills | 1.72% | 0.66%(+1.06)#82 | 0.30%(+1.42)#853 |
| 83. | Ringoes | 1.68% | 0.66%(+1.02)#83 | 0.30%(+1.38)#873 |
| 84. | West Freehold | 1.64% | 0.66%(+0.982)#84 | 0.30%(+1.34)#903 |
| 85. | Ogdensburg Borough | 1.63% | 0.66%(+0.967)#85 | 0.30%(+1.32)#915 |
| 86. | Morris Plains Borough | 1.62% | 0.66%(+0.964)#86 | 0.30%(+1.32)#918 |
| 87. | Ridgewood | 1.62% | 0.66%(+0.958)#87 | 0.30%(+1.31)#920 |
| 88. | Lakewood | 1.60% | 0.66%(+0.946)#88 | 0.30%(+1.30)#931 |
| 89. | Woodstown Borough | 1.55% | 0.66%(+0.891)#89 | 0.30%(+1.25)#968 |
| 90. | Brielle Borough | 1.53% | 0.66%(+0.875)#90 | 0.30%(+1.23)#994 |
| 91. | Oak Ridge | 1.53% | 0.66%(+0.870)#91 | 0.30%(+1.22)#996 |
| 92. | Wildwood Crest Borough | 1.51% | 0.66%(+0.856)#92 | 0.30%(+1.21)#1,014 |
| 93. | Medford Lakes Borough | 1.48% | 0.66%(+0.820)#93 | 0.30%(+1.17)#1,039 |
| 94. | Bradley Beach Borough | 1.45% | 0.66%(+0.794)#94 | 0.30%(+1.15)#1,061 |
| 95. | Milford Borough | 1.45% | 0.66%(+0.789)#95 | 0.30%(+1.14)#1,063 |
| 96. | Bergenfield Borough | 1.43% | 0.66%(+0.777)#96 | 0.30%(+1.13)#1,072 |
| 97. | Far Hills Borough | 1.43% | 0.66%(+0.774)#97 | 0.30%(+1.13)#1,075 |
| 98. | Hoboken | 1.43% | 0.66%(+0.770)#98 | 0.30%(+1.12)#1,078 |
| 99. | Beach Haven Borough | 1.41% | 0.66%(+0.756)#99 | 0.30%(+1.11)#1,084 |
| 100. | Martinsville | 1.41% | 0.66%(+0.748)#100 | 0.30%(+1.10)#1,095 |
Common Questions
What are the Top 10 Cities with the Highest Percentage of Eastern European Population in New Jersey?
Top 10 Cities with the Highest Percentage of Eastern European Population in New Jersey are:
#1
27.63%
#2
18.63%
#3
6.38%
#4
6.10%
#5
5.45%
#6
4.38%
#7
4.35%
#8
4.03%
#9
3.78%
#10
3.06%
What city has the Highest Percentage of Eastern European Population in New Jersey?
Clyde has the Highest Percentage of Eastern European Population in New Jersey with 27.63%.
What is the Percentage of Eastern European Population in the State of New Jersey?
Percentage of Eastern European Population in New Jersey is 0.66%.
What is the Percentage of Eastern European Population in the United States?
Percentage of Eastern European Population in the United States is 0.30%.