Florham Park borough, NJ Map & Demographics
Florham Park borough Overview
$66,939
PER CAPITA INCOME
$179,750
AVG FAMILY INCOME
$141,620
AVG HOUSEHOLD INCOME
30.2%
WAGE / INCOME GAP [ % ]
69.8¢/ $1
WAGE / INCOME GAP [ $ ]
0.45
INEQUALITY / GINI INDEX
12,790
TOTAL POPULATION
6,269
MALE POPULATION
6,521
FEMALE POPULATION
96.14
MALES / 100 FEMALES
104.02
FEMALES / 100 MALES
41.7
MEDIAN AGE
3.1
AVG FAMILY SIZE
2.4
AVG HOUSEHOLD SIZE
7,013
LABOR FORCE [ PEOPLE ]
62.7%
PERCENT IN LABOR FORCE
3.4%
UNEMPLOYMENT RATE
Income in Florham Park borough
Income Overview in Florham Park borough
Per Capita Income in Florham Park borough is $66,939, while median incomes of families and households are $179,750 and $141,620 respectively.
| Characteristic | Number | Measure |
| Per Capita Income | 12,790 | $66,939 |
| Median Family Income | 2,944 | $179,750 |
| Mean Family Income | 2,944 | $221,714 |
| Median Household Income | 4,530 | $141,620 |
| Mean Household Income | 4,530 | $183,050 |
| Income Deficit | 2,944 | $0 |
| Wage / Income Gap (%) | 12,790 | 30.19% |
| Wage / Income Gap ($) | 12,790 | 69.81¢ per $1 |
| Gini / Inequality Index | 12,790 | 0.45 |
Earnings by Sex in Florham Park borough
Average Earnings in Florham Park borough are $51,605, $57,641 for men and $40,242 for women, a difference of 30.2%.
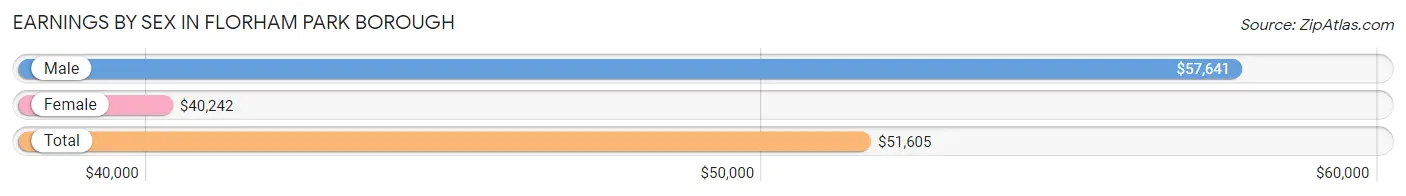
| Sex | Number | Average Earnings |
| Male | 4,140 (51.8%) | $57,641 |
| Female | 3,858 (48.2%) | $40,242 |
| Total | 7,998 (100.0%) | $51,605 |
Earnings by Sex by Income Bracket in Florham Park borough
The most common earnings brackets in Florham Park borough are $100,000+ for men (1,666 | 40.2%) and $100,000+ for women (833 | 21.6%).
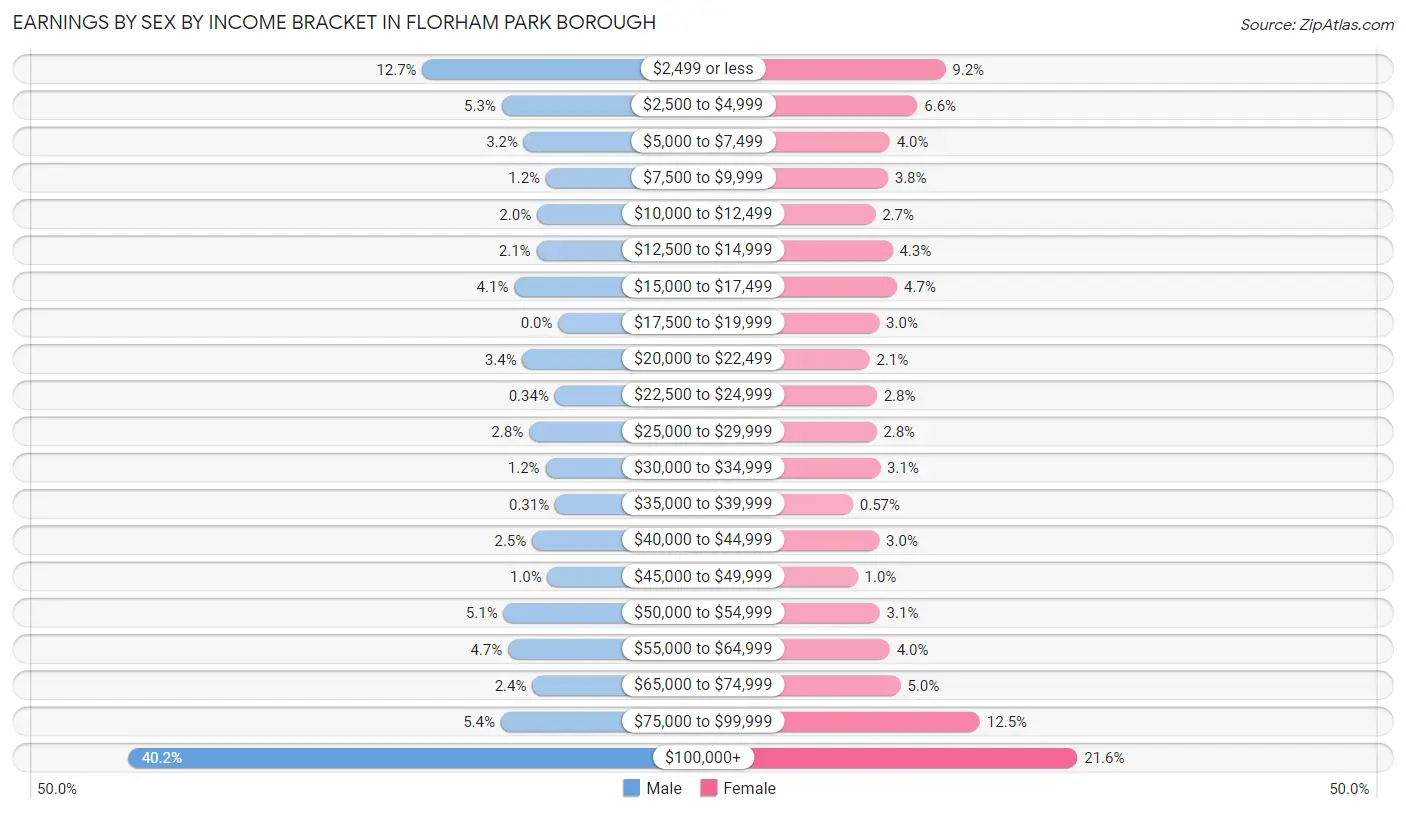
| Income | Male | Female |
| $2,499 or less | 527 (12.7%) | 356 (9.2%) |
| $2,500 to $4,999 | 220 (5.3%) | 255 (6.6%) |
| $5,000 to $7,499 | 134 (3.2%) | 155 (4.0%) |
| $7,500 to $9,999 | 48 (1.2%) | 148 (3.8%) |
| $10,000 to $12,499 | 83 (2.0%) | 103 (2.7%) |
| $12,500 to $14,999 | 85 (2.1%) | 165 (4.3%) |
| $15,000 to $17,499 | 171 (4.1%) | 182 (4.7%) |
| $17,500 to $19,999 | 0 (0.0%) | 117 (3.0%) |
| $20,000 to $22,499 | 139 (3.4%) | 82 (2.1%) |
| $22,500 to $24,999 | 14 (0.3%) | 108 (2.8%) |
| $25,000 to $29,999 | 114 (2.8%) | 107 (2.8%) |
| $30,000 to $34,999 | 50 (1.2%) | 120 (3.1%) |
| $35,000 to $39,999 | 13 (0.3%) | 22 (0.6%) |
| $40,000 to $44,999 | 102 (2.5%) | 117 (3.0%) |
| $45,000 to $49,999 | 42 (1.0%) | 39 (1.0%) |
| $50,000 to $54,999 | 213 (5.1%) | 119 (3.1%) |
| $55,000 to $64,999 | 195 (4.7%) | 155 (4.0%) |
| $65,000 to $74,999 | 101 (2.4%) | 194 (5.0%) |
| $75,000 to $99,999 | 223 (5.4%) | 481 (12.5%) |
| $100,000+ | 1,666 (40.2%) | 833 (21.6%) |
| Total | 4,140 (100.0%) | 3,858 (100.0%) |
Earnings by Sex by Educational Attainment in Florham Park borough
Average earnings in Florham Park borough are $112,188 for men and $67,041 for women, a difference of 40.2%. Men with an educational attainment of graduate degree enjoy the highest average annual earnings of $132,883, while those with high school diploma education earn the least with $22,969. Women with an educational attainment of graduate degree earn the most with the average annual earnings of $86,944, while those with high school diploma education have the smallest earnings of $20,804.
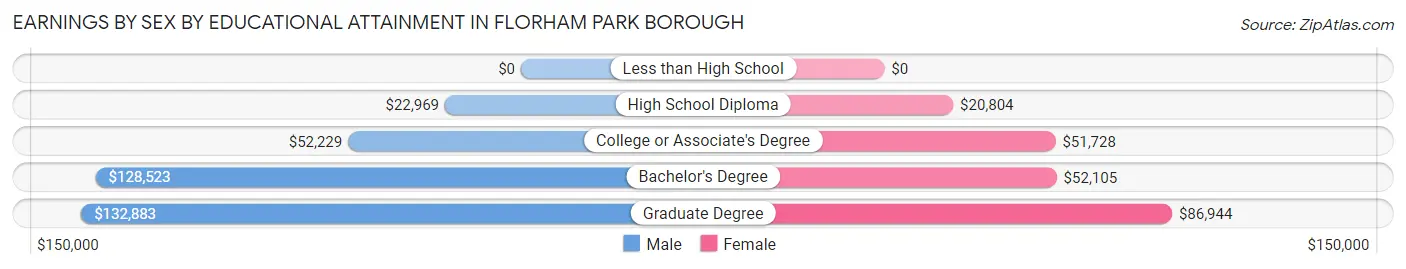
| Educational Attainment | Male Income | Female Income |
| Less than High School | - | - |
| High School Diploma | $22,969 | $20,804 |
| College or Associate's Degree | $52,229 | $51,728 |
| Bachelor's Degree | $128,523 | $52,105 |
| Graduate Degree | $132,883 | $86,944 |
| Total | $112,188 | $67,041 |
Family Income in Florham Park borough
Family Income Brackets in Florham Park borough
According to the Florham Park borough family income data, there are 1,328 families falling into the $200,000+ income range, which is the most common income bracket and makes up 45.1% of all families.
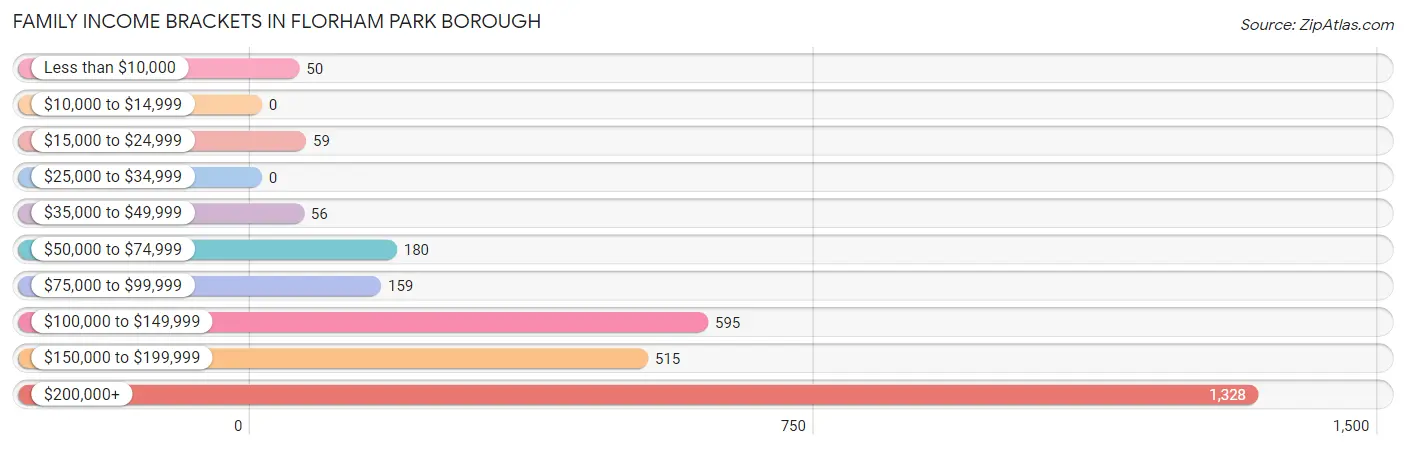
| Income Bracket | # Families | % Families |
| Less than $10,000 | 50 | 1.7% |
| $10,000 to $14,999 | 0 | 0.0% |
| $15,000 to $24,999 | 59 | 2.0% |
| $25,000 to $34,999 | 0 | 0.0% |
| $35,000 to $49,999 | 56 | 1.9% |
| $50,000 to $74,999 | 180 | 6.1% |
| $75,000 to $99,999 | 159 | 5.4% |
| $100,000 to $149,999 | 595 | 20.2% |
| $150,000 to $199,999 | 515 | 17.5% |
| $200,000+ | 1,328 | 45.1% |
Family Income by Famaliy Size in Florham Park borough
5-person families (192 | 6.5%) account for the highest median family income in Florham Park borough with $250,001 per family, while 2-person families (1,286 | 43.7%) have the highest median income of $75,600 per family member.
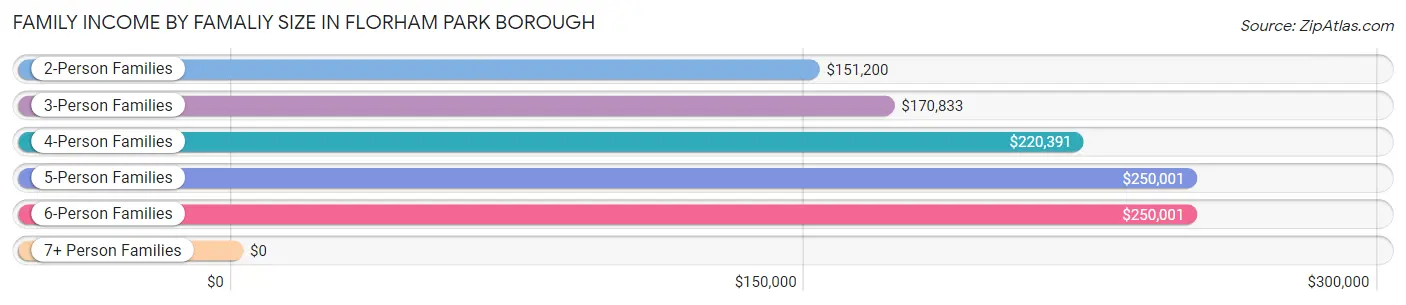
| Income Bracket | # Families | Median Income |
| 2-Person Families | 1,286 (43.7%) | $151,200 |
| 3-Person Families | 680 (23.1%) | $170,833 |
| 4-Person Families | 697 (23.7%) | $220,391 |
| 5-Person Families | 192 (6.5%) | $250,001 |
| 6-Person Families | 75 (2.5%) | $250,001 |
| 7+ Person Families | 14 (0.5%) | $0 |
| Total | 2,944 (100.0%) | $179,750 |
Family Income by Number of Earners in Florham Park borough
The median family income in Florham Park borough is $179,750, with families comprising 3+ earners (591) having the highest median family income of $209,844, while families with no earners (448) have the lowest median family income of $100,909, accounting for 20.1% and 15.2% of families, respectively.
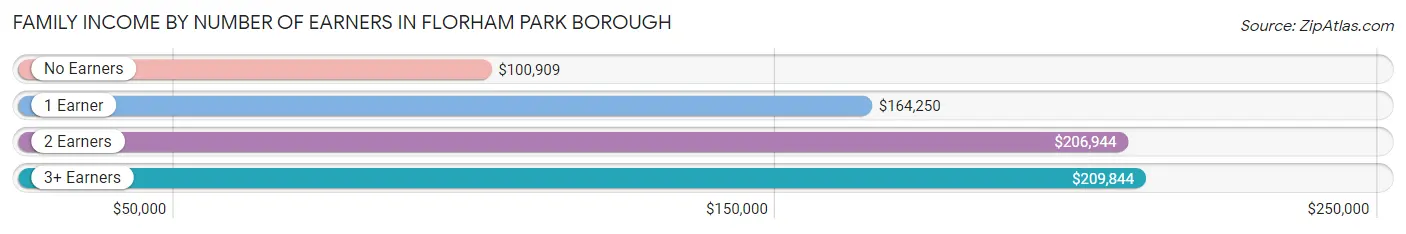
| Number of Earners | # Families | Median Income |
| No Earners | 448 (15.2%) | $100,909 |
| 1 Earner | 653 (22.2%) | $164,250 |
| 2 Earners | 1,252 (42.5%) | $206,944 |
| 3+ Earners | 591 (20.1%) | $209,844 |
| Total | 2,944 (100.0%) | $179,750 |
Household Income in Florham Park borough
Household Income Brackets in Florham Park borough
With 1,450 households falling in the category, the $200,000+ income range is the most frequent in Florham Park borough, accounting for 32.0% of all households.
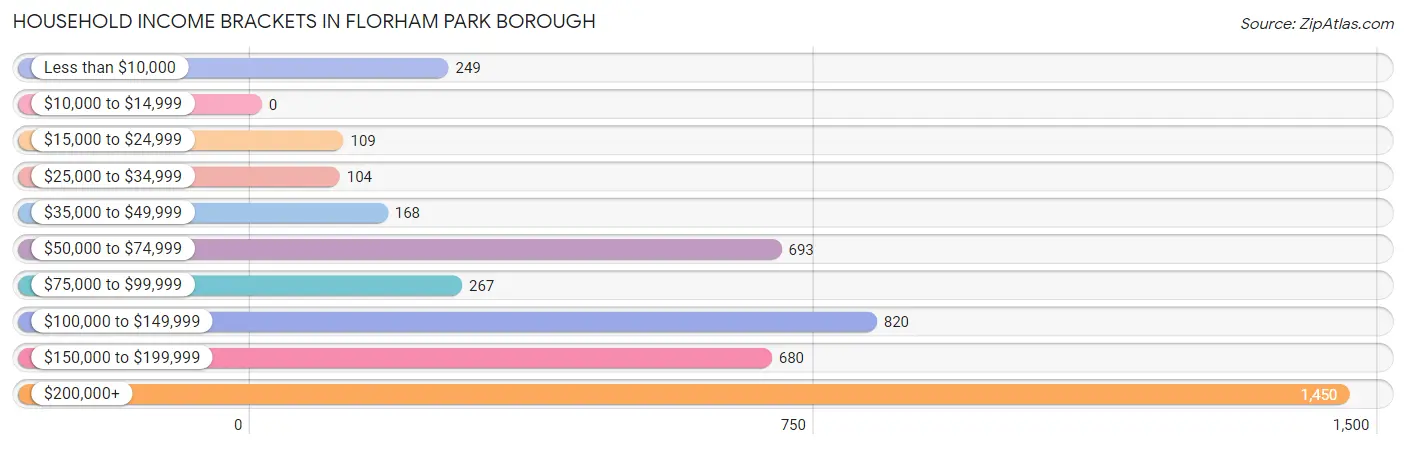
| Income Bracket | # Households | % Households |
| Less than $10,000 | 249 | 5.5% |
| $10,000 to $14,999 | 0 | 0.0% |
| $15,000 to $24,999 | 109 | 2.4% |
| $25,000 to $34,999 | 104 | 2.3% |
| $35,000 to $49,999 | 168 | 3.7% |
| $50,000 to $74,999 | 693 | 15.3% |
| $75,000 to $99,999 | 267 | 5.9% |
| $100,000 to $149,999 | 820 | 18.1% |
| $150,000 to $199,999 | 680 | 15.0% |
| $200,000+ | 1,450 | 32.0% |
Household Income by Householder Age in Florham Park borough
The median household income in Florham Park borough is $141,620, with the highest median household income of $174,363 found in the 45 to 64 years age bracket for the primary householder. A total of 1,863 households (41.1%) fall into this category.
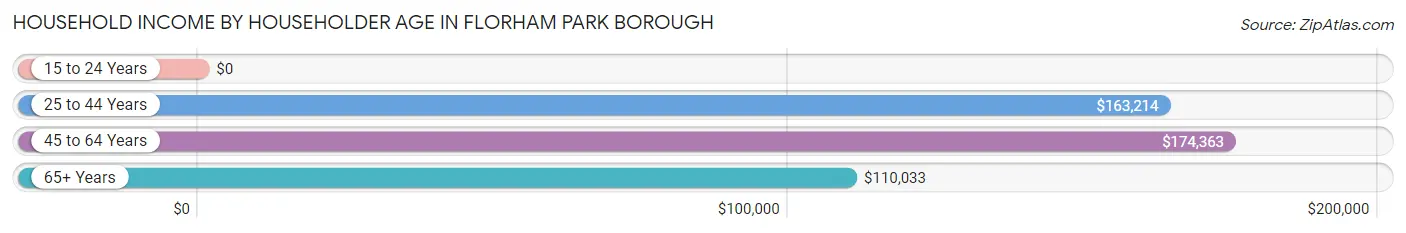
| Income Bracket | # Households | Median Income |
| 15 to 24 Years | 0 (0.0%) | $0 |
| 25 to 44 Years | 1,046 (23.1%) | $163,214 |
| 45 to 64 Years | 1,863 (41.1%) | $174,363 |
| 65+ Years | 1,621 (35.8%) | $110,033 |
| Total | 4,530 (100.0%) | $141,620 |
Poverty in Florham Park borough
Income Below Poverty by Sex and Age in Florham Park borough
With 2.5% poverty level for males and 5.6% for females among the residents of Florham Park borough, 5 year old males and 75 year old and over females are the most vulnerable to poverty, with 12 males (12.9%) and 154 females (20.1%) in their respective age groups living below the poverty level.
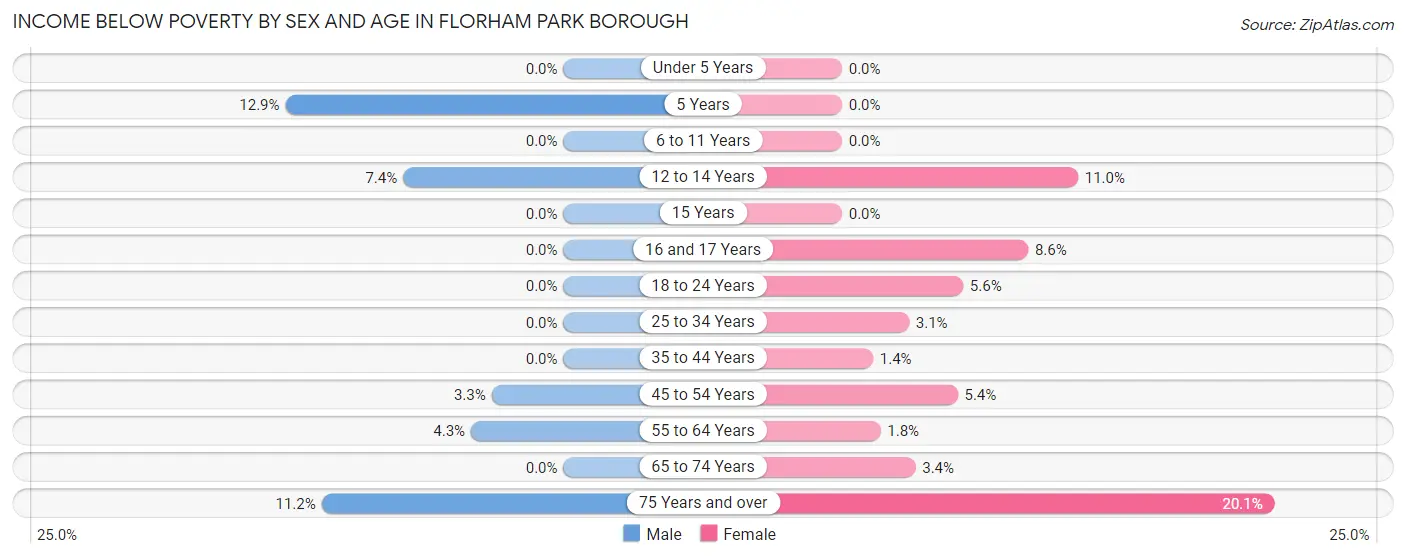
| Age Bracket | Male | Female |
| Under 5 Years | 0 (0.0%) | 0 (0.0%) |
| 5 Years | 12 (12.9%) | 0 (0.0%) |
| 6 to 11 Years | 0 (0.0%) | 0 (0.0%) |
| 12 to 14 Years | 16 (7.4%) | 15 (11.0%) |
| 15 Years | 0 (0.0%) | 0 (0.0%) |
| 16 and 17 Years | 0 (0.0%) | 14 (8.6%) |
| 18 to 24 Years | 0 (0.0%) | 15 (5.6%) |
| 25 to 34 Years | 0 (0.0%) | 14 (3.1%) |
| 35 to 44 Years | 0 (0.0%) | 11 (1.4%) |
| 45 to 54 Years | 24 (3.3%) | 44 (5.4%) |
| 55 to 64 Years | 33 (4.3%) | 16 (1.8%) |
| 65 to 74 Years | 0 (0.0%) | 26 (3.4%) |
| 75 Years and over | 57 (11.2%) | 154 (20.1%) |
| Total | 142 (2.5%) | 309 (5.6%) |
Income Above Poverty by Sex and Age in Florham Park borough
According to the poverty statistics in Florham Park borough, males aged under 5 years and females aged under 5 years are the age groups that are most secure financially, with 100.0% of males and 100.0% of females in these age groups living above the poverty line.
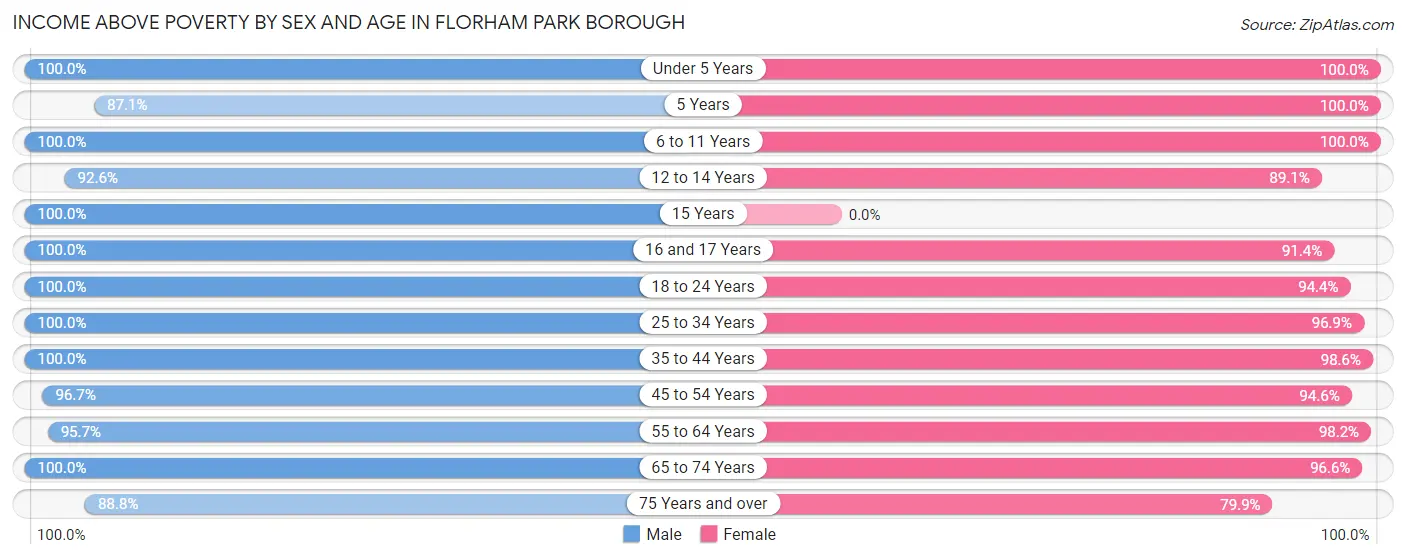
| Age Bracket | Male | Female |
| Under 5 Years | 287 (100.0%) | 161 (100.0%) |
| 5 Years | 81 (87.1%) | 46 (100.0%) |
| 6 to 11 Years | 318 (100.0%) | 321 (100.0%) |
| 12 to 14 Years | 199 (92.6%) | 122 (89.0%) |
| 15 Years | 26 (100.0%) | 0 (0.0%) |
| 16 and 17 Years | 314 (100.0%) | 148 (91.4%) |
| 18 to 24 Years | 543 (100.0%) | 252 (94.4%) |
| 25 to 34 Years | 697 (100.0%) | 436 (96.9%) |
| 35 to 44 Years | 513 (100.0%) | 751 (98.6%) |
| 45 to 54 Years | 696 (96.7%) | 775 (94.6%) |
| 55 to 64 Years | 737 (95.7%) | 877 (98.2%) |
| 65 to 74 Years | 583 (100.0%) | 737 (96.6%) |
| 75 Years and over | 451 (88.8%) | 613 (79.9%) |
| Total | 5,445 (97.5%) | 5,239 (94.4%) |
Income Below Poverty Among Married-Couple Families in Florham Park borough
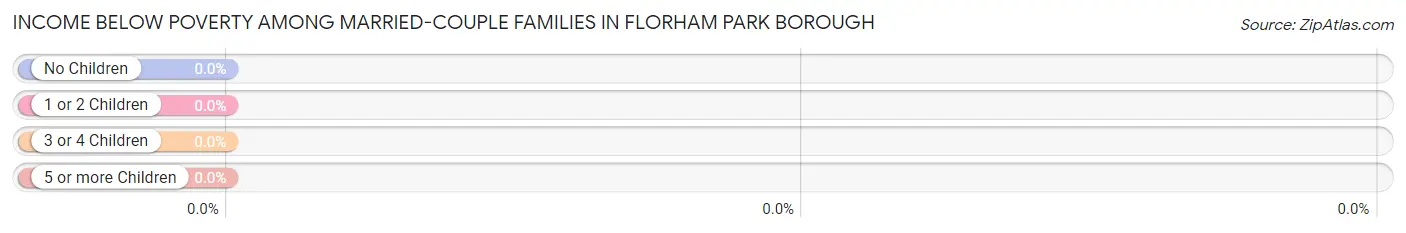
| Children | Above Poverty | Below Poverty |
| No Children | 1,414 (100.0%) | 0 (0.0%) |
| 1 or 2 Children | 970 (100.0%) | 0 (0.0%) |
| 3 or 4 Children | 83 (100.0%) | 0 (0.0%) |
| 5 or more Children | 0 (0.0%) | 0 (0.0%) |
| Total | 2,467 (100.0%) | 0 (0.0%) |
Income Below Poverty Among Single-Parent Households in Florham Park borough
According to the poverty data in Florham Park borough, 16.8% or 20 single-father households and 8.4% or 30 single-mother households are living below the poverty line. Among single-father households, those with no children have the highest poverty rate, with 20 households (29.0%) experiencing poverty. Likewise, among single-mother households, those with 3 or 4 children have the highest poverty rate, with 19 households (67.9%) falling below the poverty line.
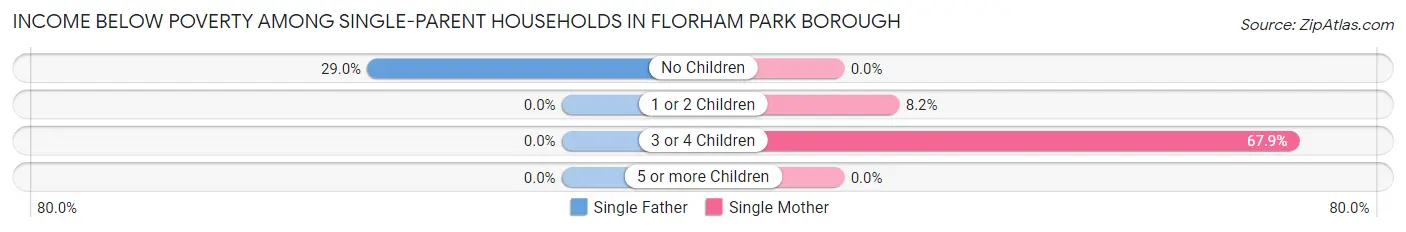
| Children | Single Father | Single Mother |
| No Children | 20 (29.0%) | 0 (0.0%) |
| 1 or 2 Children | 0 (0.0%) | 11 (8.2%) |
| 3 or 4 Children | 0 (0.0%) | 19 (67.9%) |
| 5 or more Children | 0 (0.0%) | 0 (0.0%) |
| Total | 20 (16.8%) | 30 (8.4%) |
Income Below Poverty Among Married-Couple vs Single-Parent Households in Florham Park borough
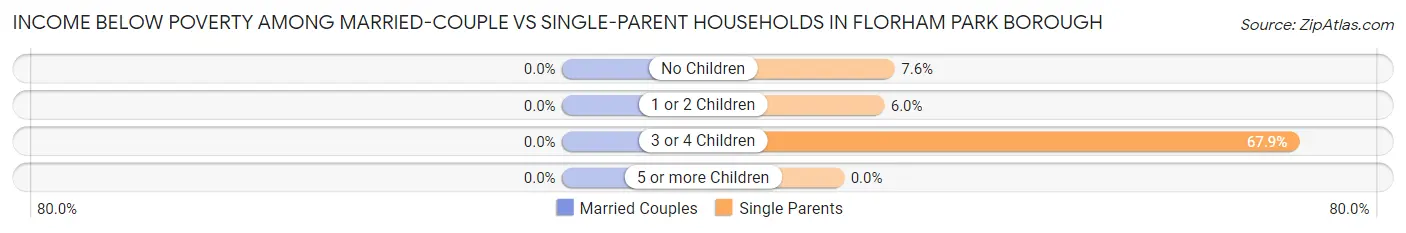
| Children | Married-Couple Families | Single-Parent Households |
| No Children | 0 (0.0%) | 20 (7.5%) |
| 1 or 2 Children | 0 (0.0%) | 11 (6.0%) |
| 3 or 4 Children | 0 (0.0%) | 19 (67.9%) |
| 5 or more Children | 0 (0.0%) | 0 (0.0%) |
| Total | 0 (0.0%) | 50 (10.5%) |
Race in Florham Park borough
The most populous races in Florham Park borough are White / Caucasian (9,747 | 76.2%), Hispanic or Latino (1,343 | 10.5%), and Asian (1,188 | 9.3%).
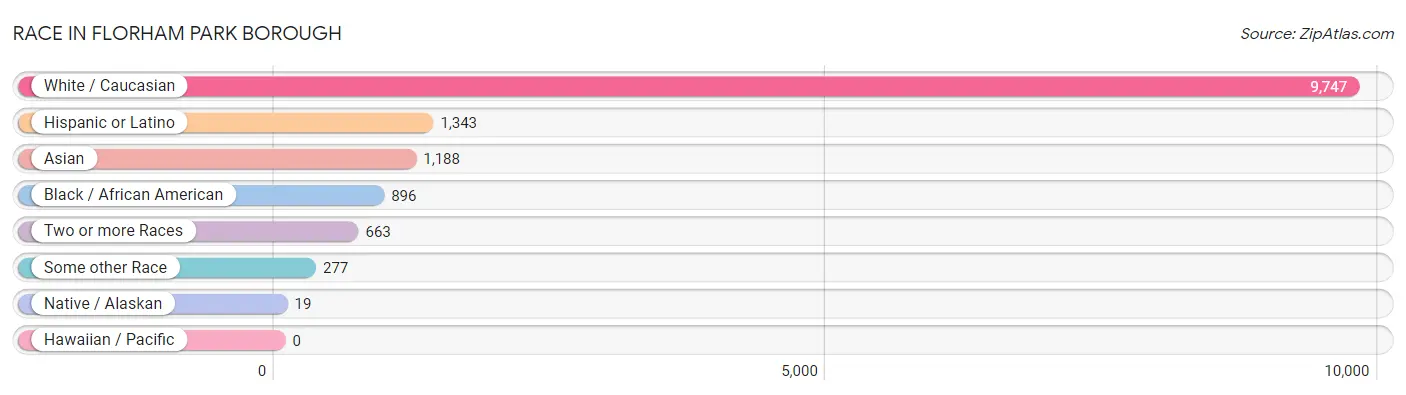
| Race | # Population | % Population |
| Asian | 1,188 | 9.3% |
| Black / African American | 896 | 7.0% |
| Hawaiian / Pacific | 0 | 0.0% |
| Hispanic or Latino | 1,343 | 10.5% |
| Native / Alaskan | 19 | 0.2% |
| White / Caucasian | 9,747 | 76.2% |
| Two or more Races | 663 | 5.2% |
| Some other Race | 277 | 2.2% |
| Total | 12,790 | 100.0% |
Ancestry in Florham Park borough
The most populous ancestries reported in Florham Park borough are Italian (3,044 | 23.8%), Irish (1,937 | 15.1%), German (1,264 | 9.9%), Polish (624 | 4.9%), and Scottish (610 | 4.8%), together accounting for 58.5% of all Florham Park borough residents.
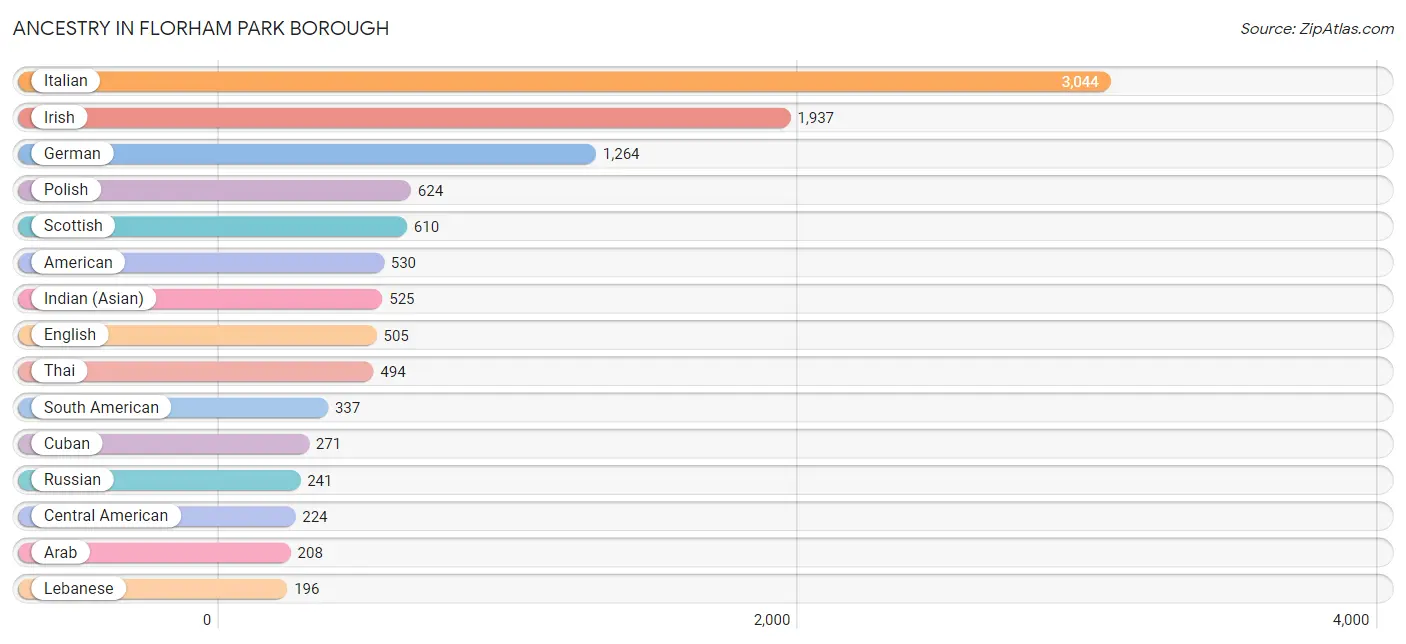
| Ancestry | # Population | % Population |
| African | 184 | 1.4% |
| Albanian | 53 | 0.4% |
| American | 530 | 4.1% |
| Arab | 208 | 1.6% |
| Austrian | 49 | 0.4% |
| Brazilian | 41 | 0.3% |
| British | 23 | 0.2% |
| Burmese | 151 | 1.2% |
| Canadian | 39 | 0.3% |
| Central American | 224 | 1.8% |
| Central American Indian | 19 | 0.2% |
| Cherokee | 7 | 0.1% |
| Colombian | 62 | 0.5% |
| Costa Rican | 147 | 1.1% |
| Croatian | 26 | 0.2% |
| Cuban | 271 | 2.1% |
| Czech | 20 | 0.2% |
| Czechoslovakian | 61 | 0.5% |
| Danish | 67 | 0.5% |
| Dominican | 129 | 1.0% |
| Dutch | 131 | 1.0% |
| Eastern European | 93 | 0.7% |
| Ecuadorian | 179 | 1.4% |
| English | 505 | 4.0% |
| Ethiopian | 8 | 0.1% |
| European | 126 | 1.0% |
| Filipino | 7 | 0.1% |
| Finnish | 14 | 0.1% |
| French | 126 | 1.0% |
| French Canadian | 35 | 0.3% |
| German | 1,264 | 9.9% |
| Greek | 123 | 1.0% |
| Guatemalan | 10 | 0.1% |
| Guyanese | 16 | 0.1% |
| Haitian | 45 | 0.4% |
| Hungarian | 94 | 0.7% |
| Indian (Asian) | 525 | 4.1% |
| Iranian | 70 | 0.5% |
| Irish | 1,937 | 15.1% |
| Israeli | 13 | 0.1% |
| Italian | 3,044 | 23.8% |
| Jamaican | 37 | 0.3% |
| Korean | 131 | 1.0% |
| Latvian | 86 | 0.7% |
| Lebanese | 196 | 1.5% |
| Lithuanian | 48 | 0.4% |
| Malaysian | 11 | 0.1% |
| Mexican | 43 | 0.3% |
| Nicaraguan | 67 | 0.5% |
| Northern European | 11 | 0.1% |
| Norwegian | 1 | 0.0% |
| Pennsylvania German | 10 | 0.1% |
| Peruvian | 96 | 0.7% |
| Polish | 624 | 4.9% |
| Portuguese | 188 | 1.5% |
| Puerto Rican | 188 | 1.5% |
| Russian | 241 | 1.9% |
| Scotch-Irish | 13 | 0.1% |
| Scottish | 610 | 4.8% |
| Slavic | 25 | 0.2% |
| Slovak | 11 | 0.1% |
| South American | 337 | 2.6% |
| Spaniard | 66 | 0.5% |
| Spanish | 48 | 0.4% |
| Sri Lankan | 18 | 0.1% |
| Subsaharan African | 192 | 1.5% |
| Swedish | 60 | 0.5% |
| Syrian | 59 | 0.5% |
| Thai | 494 | 3.9% |
| Turkish | 33 | 0.3% |
| Ukrainian | 55 | 0.4% |
| Welsh | 124 | 1.0% |
| Yugoslavian | 31 | 0.2% | View All 73 Rows |
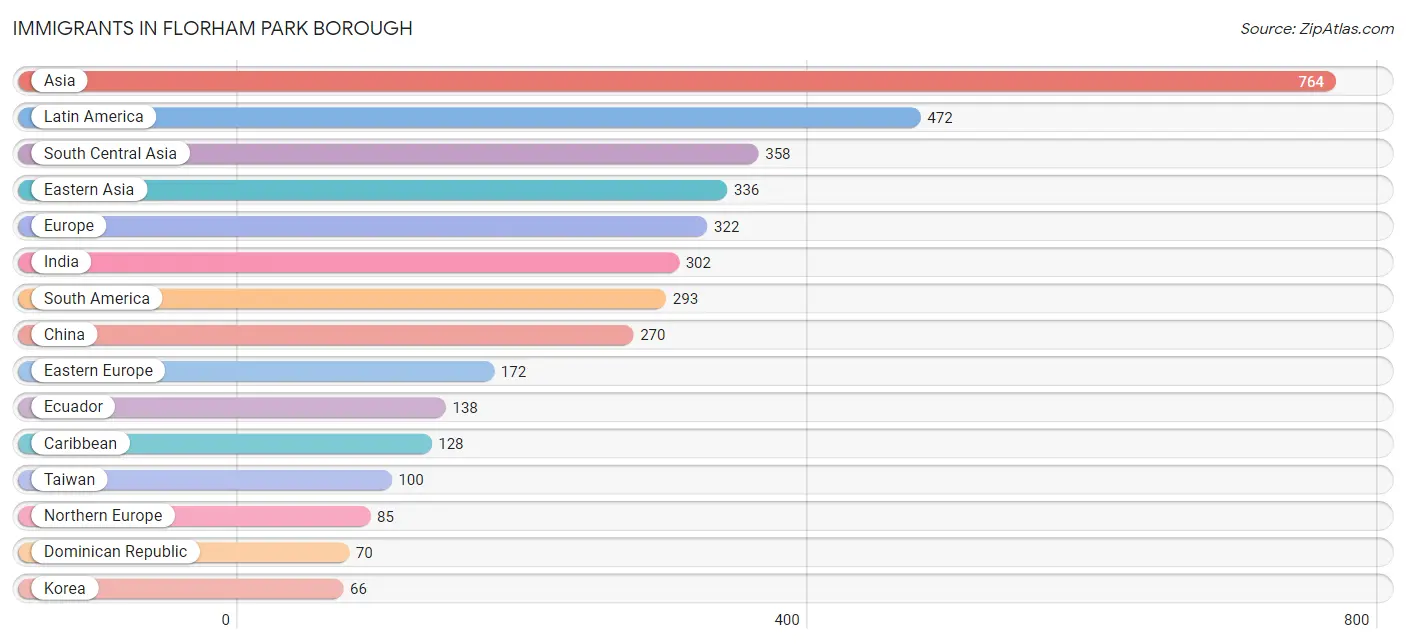
Immigrants in Florham Park borough
The most numerous immigrant groups reported in Florham Park borough came from Asia (764 | 6.0%), Latin America (472 | 3.7%), South Central Asia (358 | 2.8%), Eastern Asia (336 | 2.6%), and Europe (322 | 2.5%), together accounting for 17.6% of all Florham Park borough residents.
| Immigration Origin | # Population | % Population |
| Africa | 14 | 0.1% |
| Asia | 764 | 6.0% |
| Bosnia and Herzegovina | 15 | 0.1% |
| Brazil | 40 | 0.3% |
| Canada | 51 | 0.4% |
| Caribbean | 128 | 1.0% |
| Central America | 51 | 0.4% |
| China | 270 | 2.1% |
| Colombia | 49 | 0.4% |
| Costa Rica | 45 | 0.4% |
| Denmark | 36 | 0.3% |
| Dominican Republic | 70 | 0.5% |
| Eastern Africa | 10 | 0.1% |
| Eastern Asia | 336 | 2.6% |
| Eastern Europe | 172 | 1.3% |
| Ecuador | 138 | 1.1% |
| England | 2 | 0.0% |
| Eritrea | 8 | 0.1% |
| Europe | 322 | 2.5% |
| Guatemala | 6 | 0.1% |
| Guyana | 16 | 0.1% |
| Haiti | 21 | 0.2% |
| India | 302 | 2.4% |
| Iran | 56 | 0.4% |
| Ireland | 47 | 0.4% |
| Israel | 13 | 0.1% |
| Italy | 19 | 0.2% |
| Jamaica | 37 | 0.3% |
| Korea | 66 | 0.5% |
| Latin America | 472 | 3.7% |
| Nigeria | 4 | 0.0% |
| Northern Europe | 85 | 0.7% |
| Peru | 50 | 0.4% |
| Philippines | 41 | 0.3% |
| Poland | 28 | 0.2% |
| Portugal | 35 | 0.3% |
| Russia | 66 | 0.5% |
| South America | 293 | 2.3% |
| South Central Asia | 358 | 2.8% |
| South Eastern Asia | 48 | 0.4% |
| Southern Europe | 54 | 0.4% |
| Switzerland | 11 | 0.1% |
| Taiwan | 100 | 0.8% |
| Turkey | 9 | 0.1% |
| Ukraine | 16 | 0.1% |
| Vietnam | 7 | 0.1% |
| Western Africa | 4 | 0.0% |
| Western Asia | 22 | 0.2% |
| Western Europe | 11 | 0.1% | View All 49 Rows |
Sex and Age in Florham Park borough
Sex and Age in Florham Park borough
The most populous age groups in Florham Park borough are 20 to 24 Years (822 | 13.1%) for men and 20 to 24 Years (841 | 12.9%) for women.
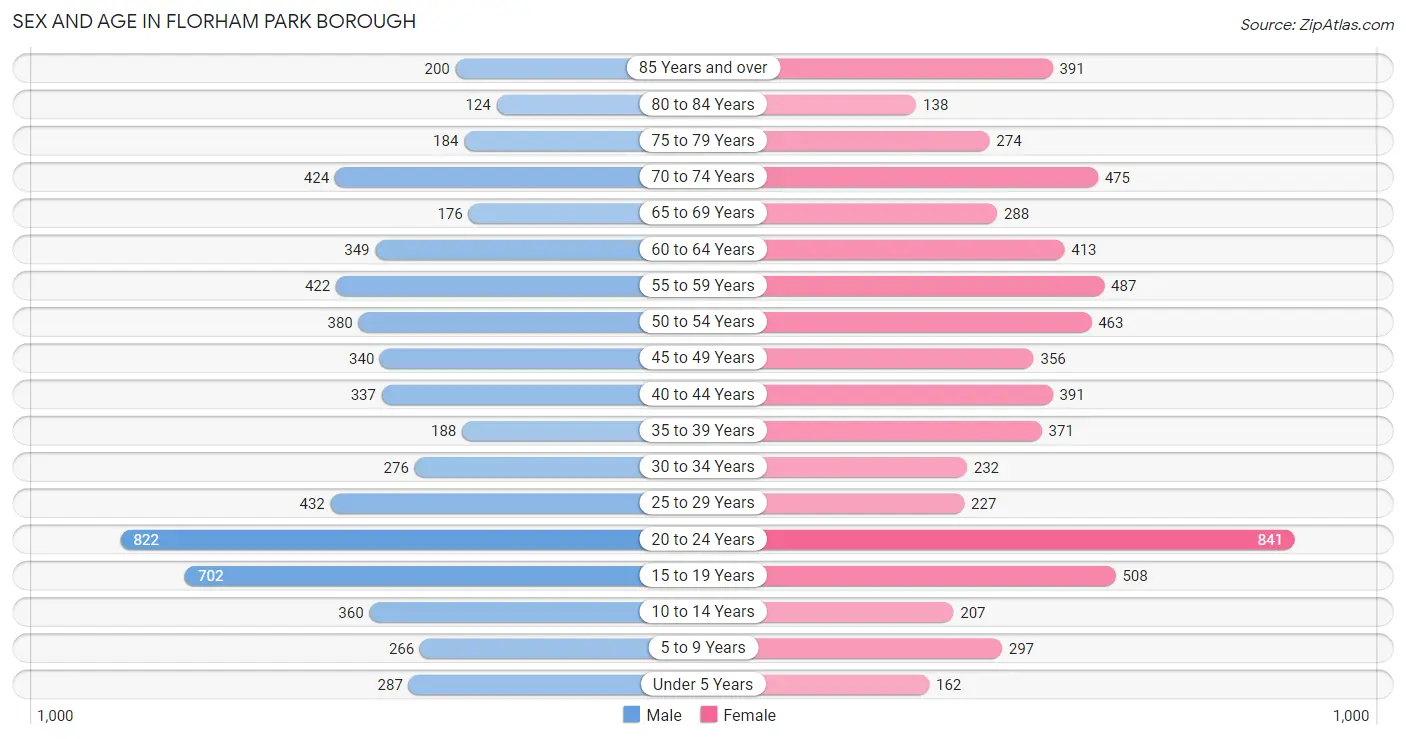
| Age Bracket | Male | Female |
| Under 5 Years | 287 (4.6%) | 162 (2.5%) |
| 5 to 9 Years | 266 (4.2%) | 297 (4.5%) |
| 10 to 14 Years | 360 (5.7%) | 207 (3.2%) |
| 15 to 19 Years | 702 (11.2%) | 508 (7.8%) |
| 20 to 24 Years | 822 (13.1%) | 841 (12.9%) |
| 25 to 29 Years | 432 (6.9%) | 227 (3.5%) |
| 30 to 34 Years | 276 (4.4%) | 232 (3.6%) |
| 35 to 39 Years | 188 (3.0%) | 371 (5.7%) |
| 40 to 44 Years | 337 (5.4%) | 391 (6.0%) |
| 45 to 49 Years | 340 (5.4%) | 356 (5.5%) |
| 50 to 54 Years | 380 (6.1%) | 463 (7.1%) |
| 55 to 59 Years | 422 (6.7%) | 487 (7.5%) |
| 60 to 64 Years | 349 (5.6%) | 413 (6.3%) |
| 65 to 69 Years | 176 (2.8%) | 288 (4.4%) |
| 70 to 74 Years | 424 (6.8%) | 475 (7.3%) |
| 75 to 79 Years | 184 (2.9%) | 274 (4.2%) |
| 80 to 84 Years | 124 (2.0%) | 138 (2.1%) |
| 85 Years and over | 200 (3.2%) | 391 (6.0%) |
| Total | 6,269 (100.0%) | 6,521 (100.0%) |
Families and Households in Florham Park borough
Median Family Size in Florham Park borough
The median family size in Florham Park borough is 3.15 persons per family, with married-couple families (2,467 | 83.8%) accounting for the largest median family size of 3.2 persons per family. On the other hand, single male/father families (119 | 4.0%) represent the smallest median family size with 2.36 persons per family.
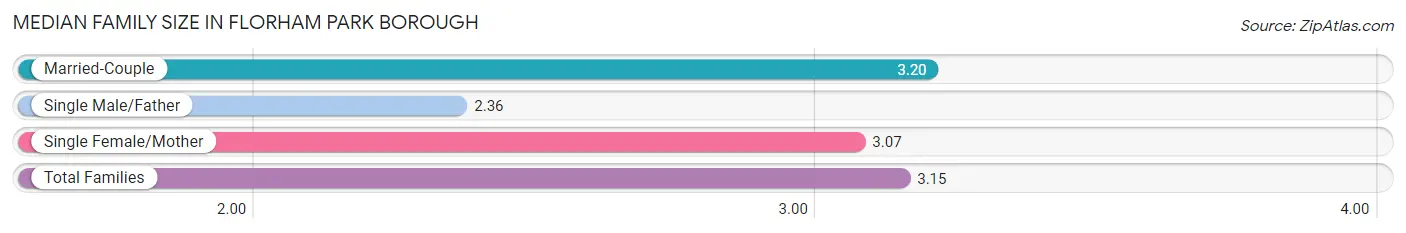
| Family Type | # Families | Family Size |
| Married-Couple | 2,467 (83.8%) | 3.20 |
| Single Male/Father | 119 (4.0%) | 2.36 |
| Single Female/Mother | 358 (12.2%) | 3.07 |
| Total Families | 2,944 (100.0%) | 3.15 |
Median Household Size in Florham Park borough
The median household size in Florham Park borough is 2.44 persons per household, with married-couple households (2,467 | 54.5%) accounting for the largest median household size of 3.21 persons per household. non-family households (1,586 | 35.0%) represent the smallest median household size with 1.09 persons per household.
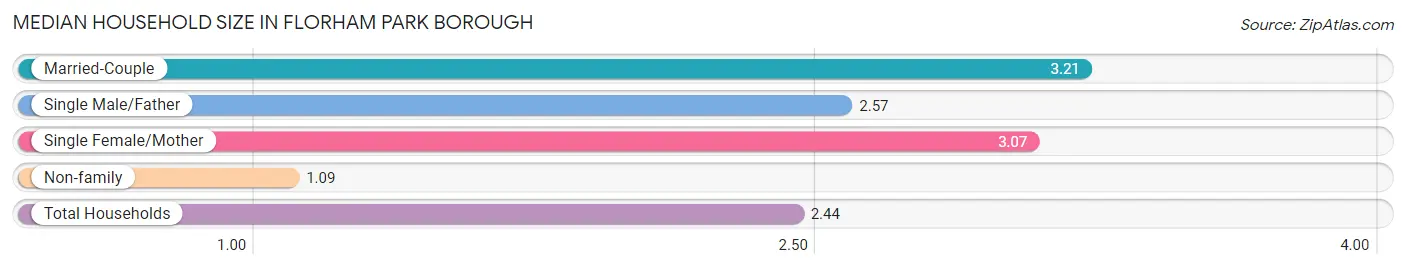
| Household Type | # Households | Household Size |
| Married-Couple | 2,467 (54.5%) | 3.21 |
| Single Male/Father | 119 (2.6%) | 2.57 |
| Single Female/Mother | 358 (7.9%) | 3.07 |
| Non-family | 1,586 (35.0%) | 1.09 |
| Total Households | 4,530 (100.0%) | 2.44 |
Household Size by Marriage Status in Florham Park borough
Out of a total of 4,530 households in Florham Park borough, 2,944 (65.0%) are family households, while 1,586 (35.0%) are nonfamily households. The most numerous type of family households are 2-person households, comprising 1,286, and the most common type of nonfamily households are 1-person households, comprising 1,432.
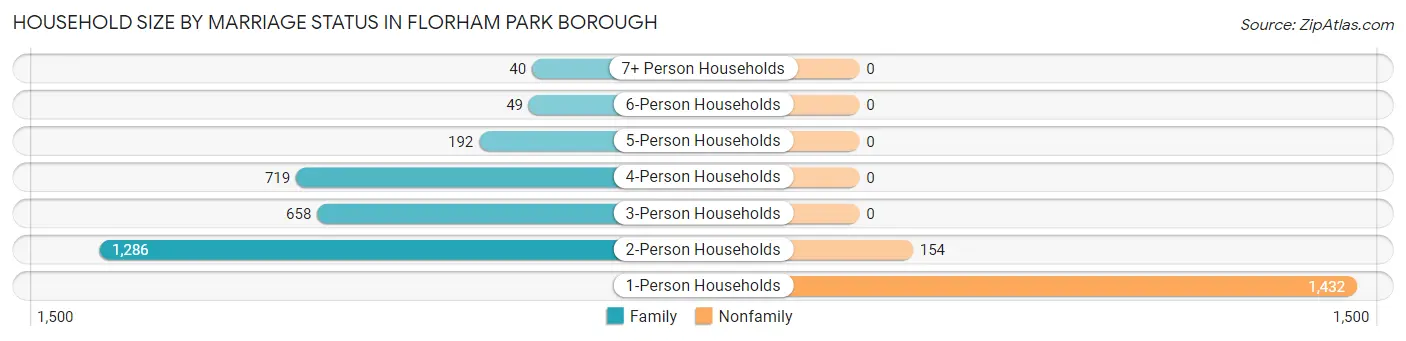
| Household Size | Family Households | Nonfamily Households |
| 1-Person Households | - | 1,432 (31.6%) |
| 2-Person Households | 1,286 (28.4%) | 154 (3.4%) |
| 3-Person Households | 658 (14.5%) | 0 (0.0%) |
| 4-Person Households | 719 (15.9%) | 0 (0.0%) |
| 5-Person Households | 192 (4.2%) | 0 (0.0%) |
| 6-Person Households | 49 (1.1%) | 0 (0.0%) |
| 7+ Person Households | 40 (0.9%) | 0 (0.0%) |
| Total | 2,944 (65.0%) | 1,586 (35.0%) |
Female Fertility in Florham Park borough
Fertility by Age in Florham Park borough
Average fertility rate in Florham Park borough is 36.0 births per 1,000 women. Women in the age bracket of 35 to 50 years have the highest fertility rate with 63.0 births per 1,000 women. Women in the age bracket of 35 to 50 years acount for 69.8% of all women with births.
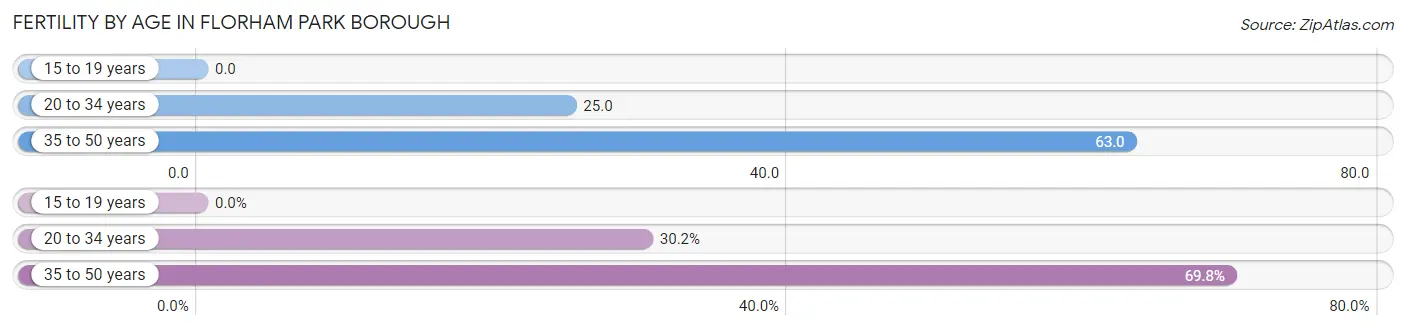
| Age Bracket | Women with Births | Births / 1,000 Women |
| 15 to 19 years | 0 (0.0%) | 0.0 |
| 20 to 34 years | 32 (30.2%) | 25.0 |
| 35 to 50 years | 74 (69.8%) | 63.0 |
| Total | 106 (100.0%) | 36.0 |
Fertility by Age by Marriage Status in Florham Park borough
89.6% of women with births (106) in Florham Park borough are married. The highest percentage of unmarried women with births falls into 35 to 50 years age bracket with 14.9% of them unmarried at the time of birth, while the lowest percentage of unmarried women with births belong to 20 to 34 years age bracket with 0.0% of them unmarried.
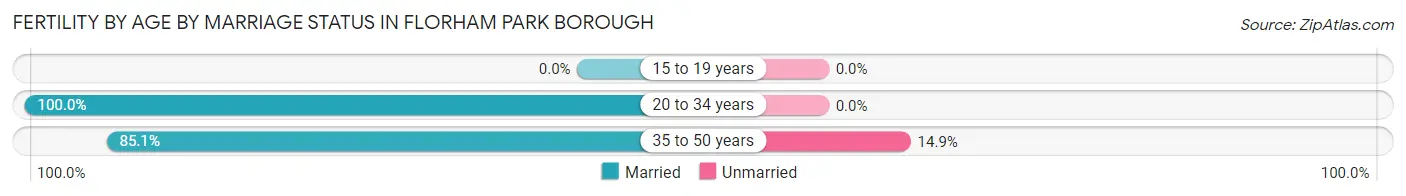
| Age Bracket | Married | Unmarried |
| 15 to 19 years | 0 (0.0%) | 0 (0.0%) |
| 20 to 34 years | 32 (100.0%) | 0 (0.0%) |
| 35 to 50 years | 63 (85.1%) | 11 (14.9%) |
| Total | 95 (89.6%) | 11 (10.4%) |
Fertility by Education in Florham Park borough
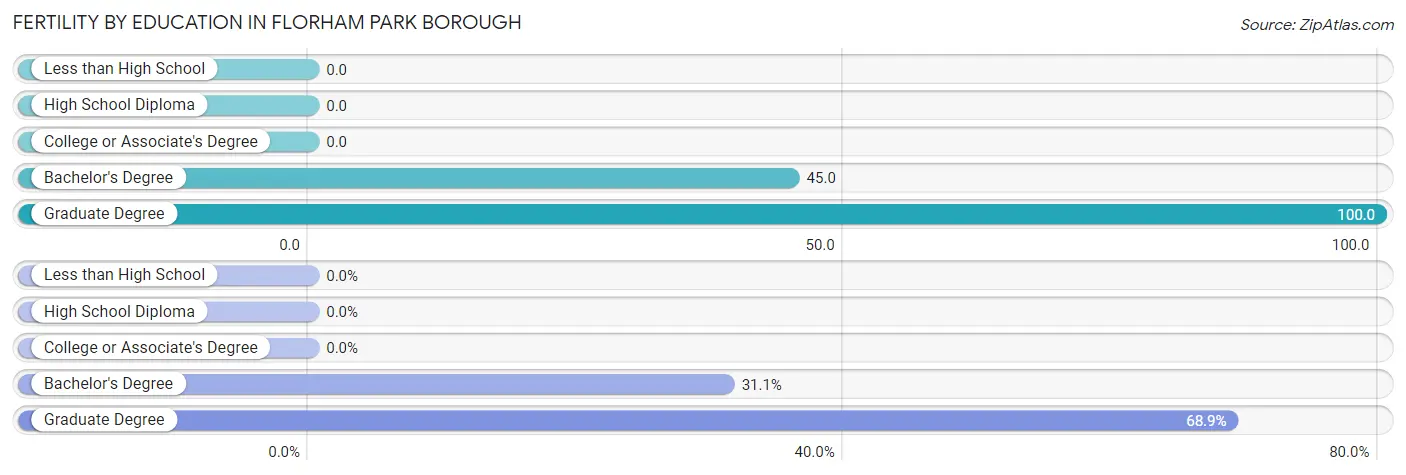
| Educational Attainment | Women with Births | Births / 1,000 Women |
| Less than High School | 0 (0.0%) | 0.0 |
| High School Diploma | 0 (0.0%) | 0.0 |
| College or Associate's Degree | 0 (0.0%) | 0.0 |
| Bachelor's Degree | 33 (31.1%) | 45.0 |
| Graduate Degree | 73 (68.9%) | 100.0 |
| Total | 106 (100.0%) | 36.0 |
Fertility by Education by Marriage Status in Florham Park borough
10.4% of women with births in Florham Park borough are unmarried. Women with the educational attainment of bachelor's degree are most likely to be married with 100.0% of them married at childbirth, while women with the educational attainment of graduate degree are least likely to be married with 15.1% of them unmarried at childbirth.
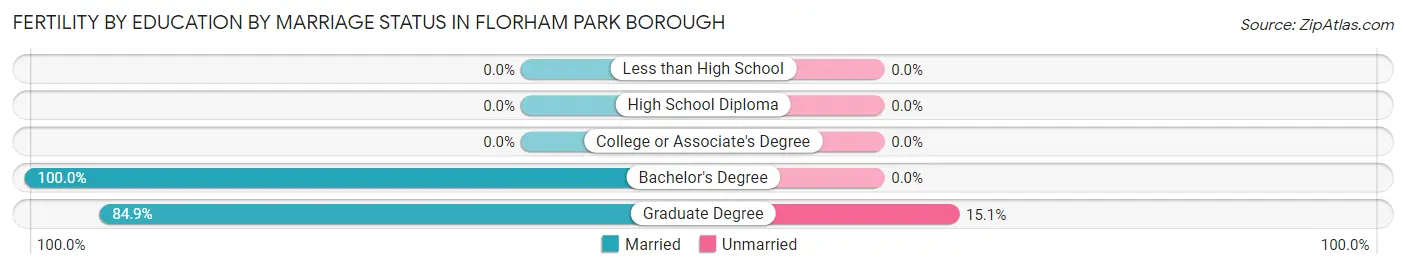
| Educational Attainment | Married | Unmarried |
| Less than High School | 0 (0.0%) | 0 (0.0%) |
| High School Diploma | 0 (0.0%) | 0 (0.0%) |
| College or Associate's Degree | 0 (0.0%) | 0 (0.0%) |
| Bachelor's Degree | 33 (100.0%) | 0 (0.0%) |
| Graduate Degree | 62 (84.9%) | 11 (15.1%) |
| Total | 95 (89.6%) | 11 (10.4%) |
Employment Characteristics in Florham Park borough
Employment by Class of Employer in Florham Park borough
Among the 6,624 employed individuals in Florham Park borough, private company employees (4,560 | 68.8%), self-employed (incorporated) (566 | 8.5%), and not-for-profit organizations (536 | 8.1%) make up the most common classes of employment.
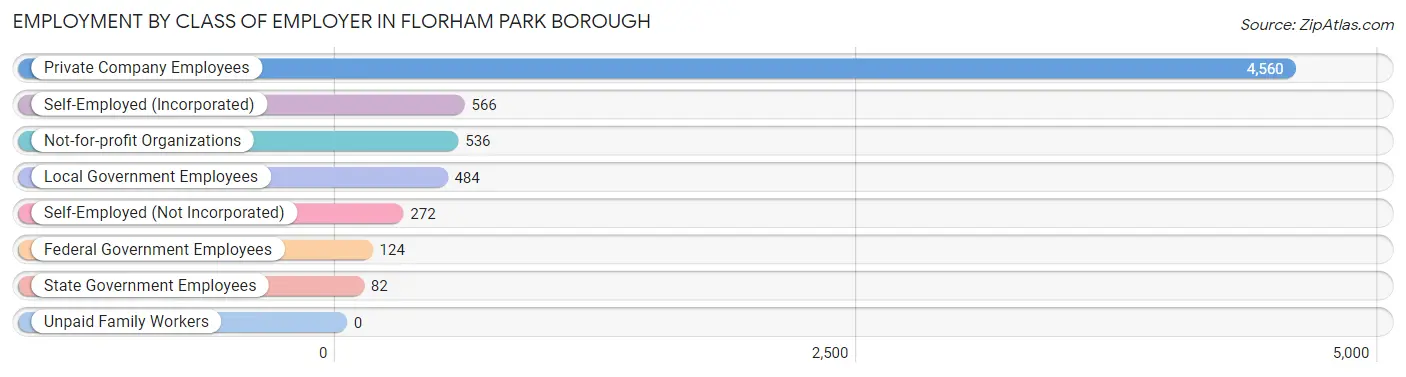
| Employer Class | # Employees | % Employees |
| Private Company Employees | 4,560 | 68.8% |
| Self-Employed (Incorporated) | 566 | 8.5% |
| Self-Employed (Not Incorporated) | 272 | 4.1% |
| Not-for-profit Organizations | 536 | 8.1% |
| Local Government Employees | 484 | 7.3% |
| State Government Employees | 82 | 1.2% |
| Federal Government Employees | 124 | 1.9% |
| Unpaid Family Workers | 0 | 0.0% |
| Total | 6,624 | 100.0% |
Employment Status by Age in Florham Park borough
According to the labor force statistics for Florham Park borough, out of the total population over 16 years of age (11,185), 62.7% or 7,013 individuals are in the labor force, with 3.4% or 238 of them unemployed. The age group with the highest labor force participation rate is 25 to 29 years, with 92.9% or 612 individuals in the labor force. Within the labor force, the 20 to 24 years age range has the highest percentage of unemployed individuals, with 6.5% or 73 of them being unemployed.
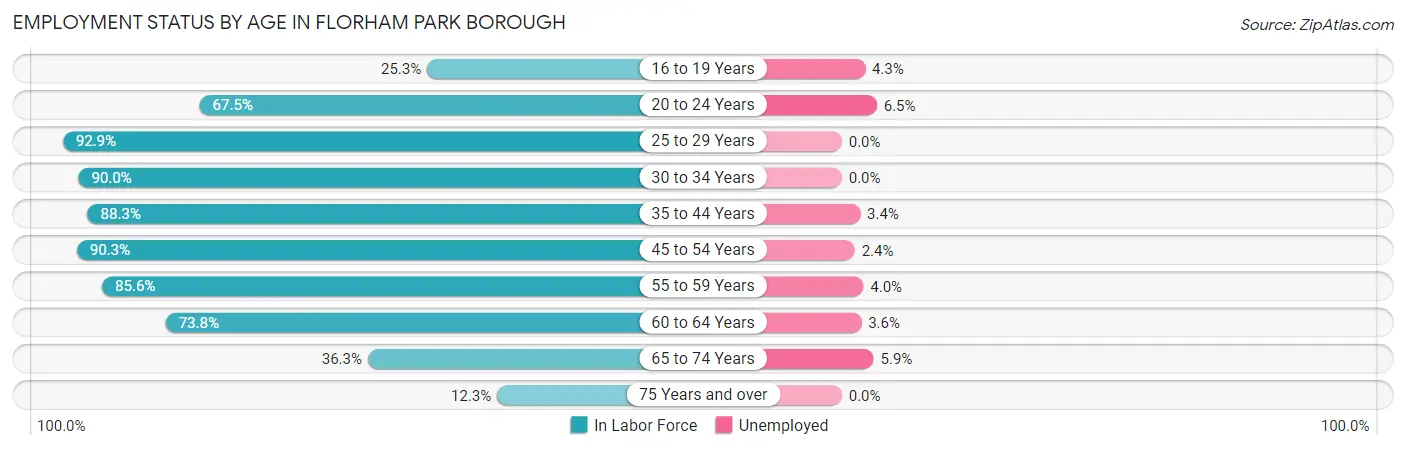
| Age Bracket | In Labor Force | Unemployed |
| 16 to 19 Years | 300 (25.3%) | 13 (4.3%) |
| 20 to 24 Years | 1,123 (67.5%) | 73 (6.5%) |
| 25 to 29 Years | 612 (92.9%) | 0 (0.0%) |
| 30 to 34 Years | 457 (90.0%) | 0 (0.0%) |
| 35 to 44 Years | 1,136 (88.3%) | 39 (3.4%) |
| 45 to 54 Years | 1,390 (90.3%) | 33 (2.4%) |
| 55 to 59 Years | 778 (85.6%) | 31 (4.0%) |
| 60 to 64 Years | 562 (73.8%) | 20 (3.6%) |
| 65 to 74 Years | 495 (36.3%) | 29 (5.9%) |
| 75 Years and over | 161 (12.3%) | 0 (0.0%) |
| Total | 7,013 (62.7%) | 238 (3.4%) |
Employment Status by Educational Attainment in Florham Park borough
According to labor force statistics for Florham Park borough, 87.1% of individuals (4,933) out of the total population between 25 and 64 years of age (5,664) are in the labor force, with 2.5% or 123 of them being unemployed. The group with the highest labor force participation rate are those with the educational attainment of bachelor's degree or higher, with 89.5% or 3,711 individuals in the labor force. Within the labor force, individuals with less than high school education have the highest percentage of unemployment, with 17.1% or 12 of them being unemployed.
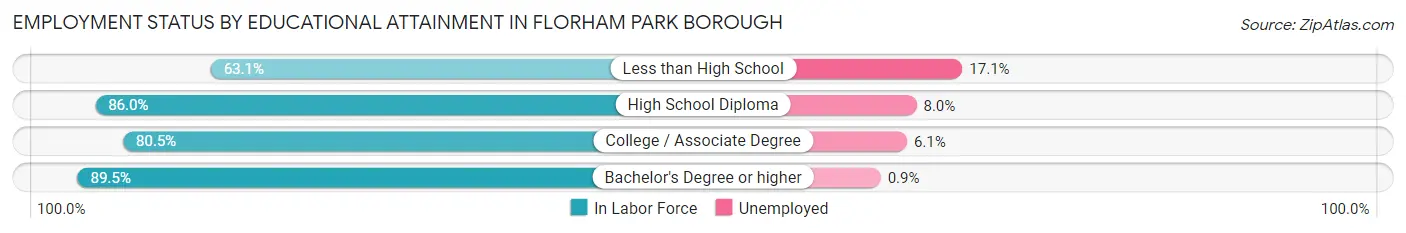
| Educational Attainment | In Labor Force | Unemployed |
| Less than High School | 70 (63.1%) | 19 (17.1%) |
| High School Diploma | 376 (86.0%) | 35 (8.0%) |
| College / Associate Degree | 781 (80.5%) | 59 (6.1%) |
| Bachelor's Degree or higher | 3,711 (89.5%) | 37 (0.9%) |
| Total | 4,933 (87.1%) | 142 (2.5%) |
Employment Occupations by Sex in Florham Park borough
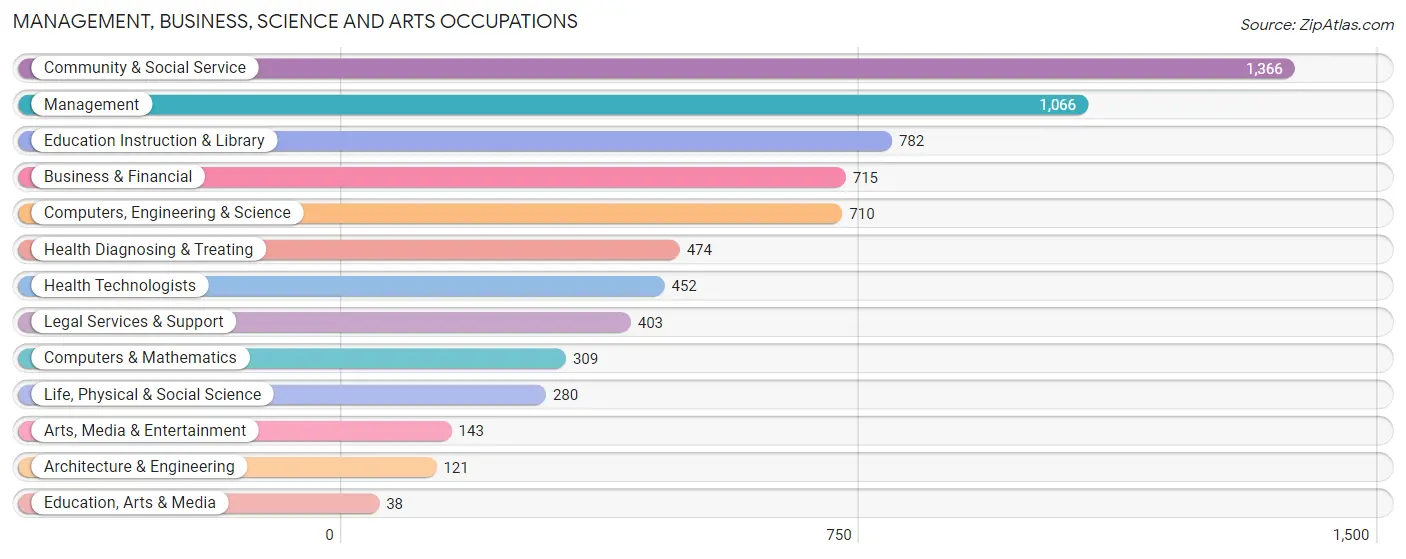
Management, Business, Science and Arts Occupations
The most common Management, Business, Science and Arts occupations in Florham Park borough are Community & Social Service (1,366 | 20.2%), Management (1,066 | 15.7%), Education Instruction & Library (782 | 11.5%), Business & Financial (715 | 10.6%), and Computers, Engineering & Science (710 | 10.5%).
Management, Business, Science and Arts Occupations by Sex
Within the Management, Business, Science and Arts occupations in Florham Park borough, the most male-oriented occupations are Architecture & Engineering (85.1%), Computers & Mathematics (69.9%), and Arts, Media & Entertainment (69.2%), while the most female-oriented occupations are Education Instruction & Library (79.8%), Education, Arts & Media (63.2%), and Community & Social Service (62.8%).
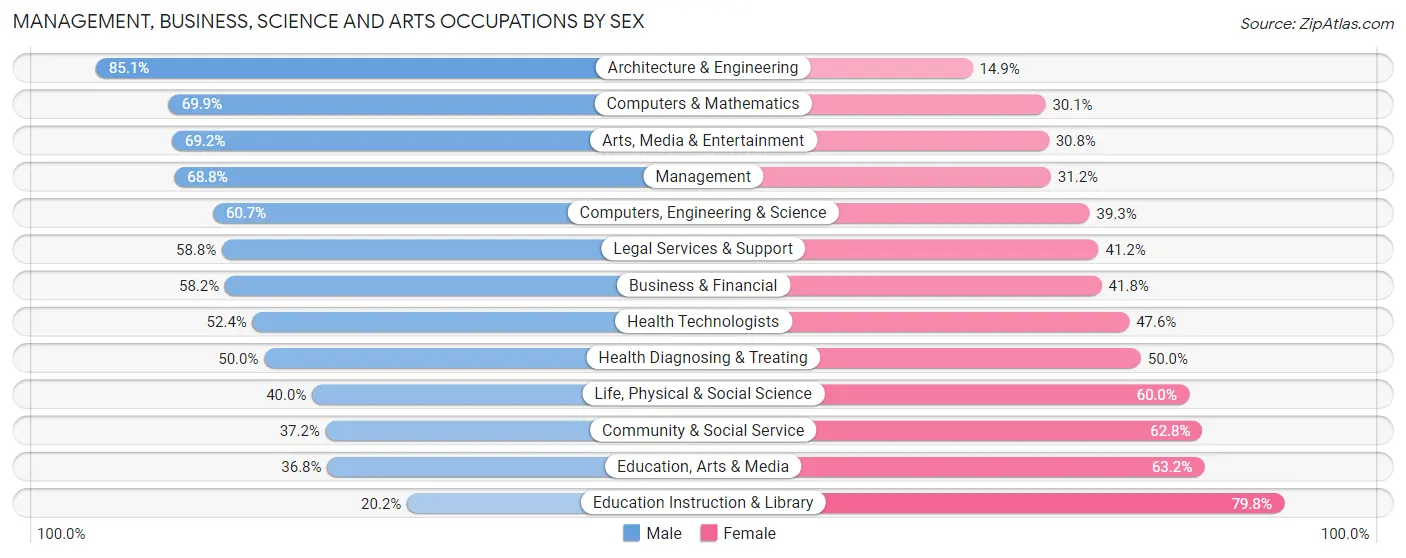
| Occupation | Male | Female |
| Management | 733 (68.8%) | 333 (31.2%) |
| Business & Financial | 416 (58.2%) | 299 (41.8%) |
| Computers, Engineering & Science | 431 (60.7%) | 279 (39.3%) |
| Computers & Mathematics | 216 (69.9%) | 93 (30.1%) |
| Architecture & Engineering | 103 (85.1%) | 18 (14.9%) |
| Life, Physical & Social Science | 112 (40.0%) | 168 (60.0%) |
| Community & Social Service | 508 (37.2%) | 858 (62.8%) |
| Education, Arts & Media | 14 (36.8%) | 24 (63.2%) |
| Legal Services & Support | 237 (58.8%) | 166 (41.2%) |
| Education Instruction & Library | 158 (20.2%) | 624 (79.8%) |
| Arts, Media & Entertainment | 99 (69.2%) | 44 (30.8%) |
| Health Diagnosing & Treating | 237 (50.0%) | 237 (50.0%) |
| Health Technologists | 237 (52.4%) | 215 (47.6%) |
| Total (Category) | 2,325 (53.7%) | 2,006 (46.3%) |
| Total (Overall) | 3,548 (52.4%) | 3,226 (47.6%) |
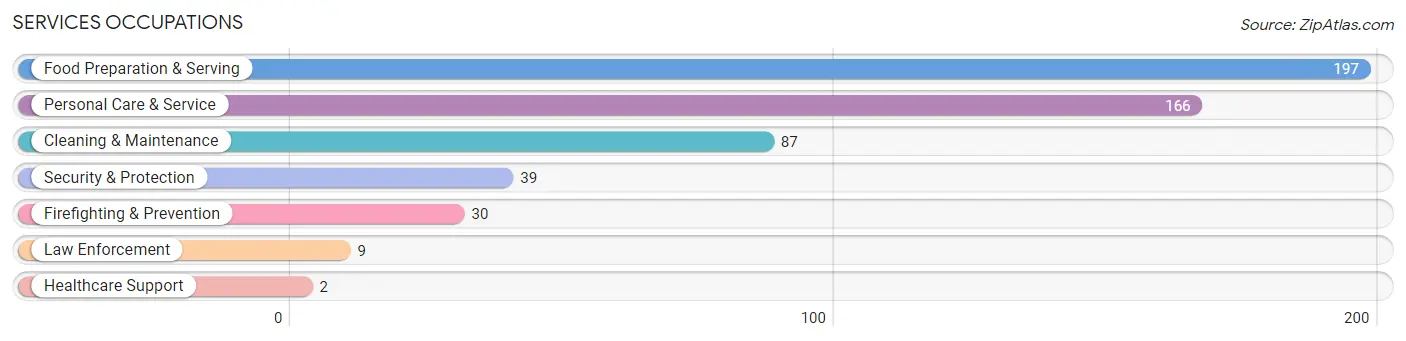
Services Occupations
The most common Services occupations in Florham Park borough are Food Preparation & Serving (197 | 2.9%), Personal Care & Service (166 | 2.5%), Cleaning & Maintenance (87 | 1.3%), Security & Protection (39 | 0.6%), and Firefighting & Prevention (30 | 0.4%).
Services Occupations by Sex
Within the Services occupations in Florham Park borough, the most male-oriented occupations are Law Enforcement (100.0%), Cleaning & Maintenance (82.8%), and Security & Protection (82.1%), while the most female-oriented occupations are Healthcare Support (100.0%), Personal Care & Service (66.3%), and Food Preparation & Serving (44.2%).
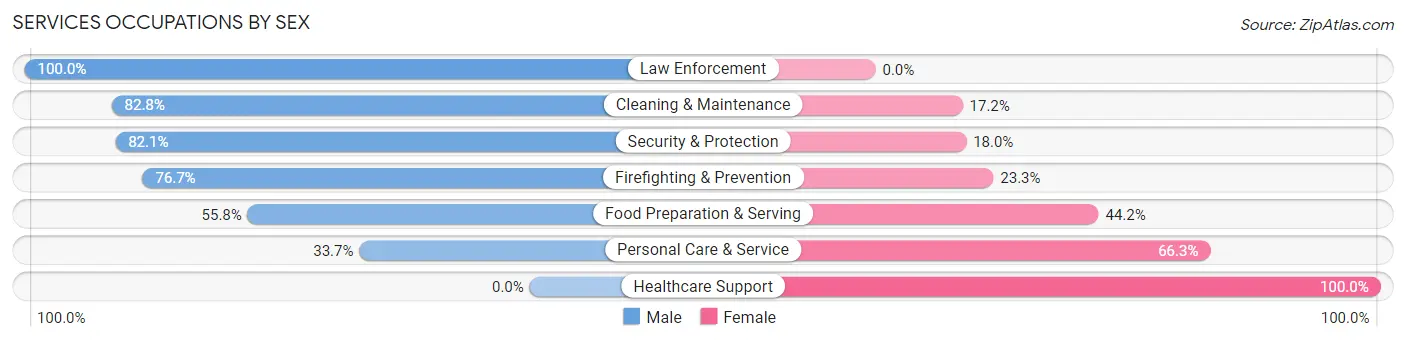
| Occupation | Male | Female |
| Healthcare Support | 0 (0.0%) | 2 (100.0%) |
| Security & Protection | 32 (82.1%) | 7 (17.9%) |
| Firefighting & Prevention | 23 (76.7%) | 7 (23.3%) |
| Law Enforcement | 9 (100.0%) | 0 (0.0%) |
| Food Preparation & Serving | 110 (55.8%) | 87 (44.2%) |
| Cleaning & Maintenance | 72 (82.8%) | 15 (17.2%) |
| Personal Care & Service | 56 (33.7%) | 110 (66.3%) |
| Total (Category) | 270 (55.0%) | 221 (45.0%) |
| Total (Overall) | 3,548 (52.4%) | 3,226 (47.6%) |
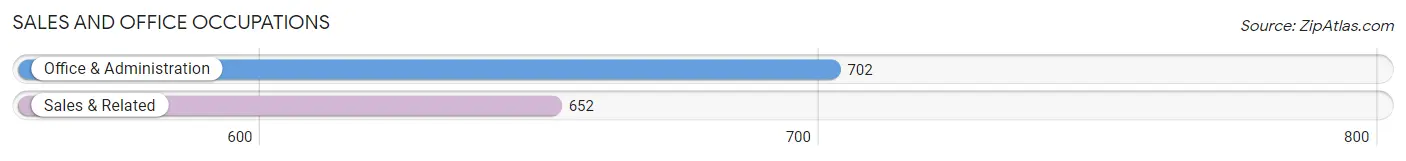
Sales and Office Occupations
The most common Sales and Office occupations in Florham Park borough are Office & Administration (702 | 10.4%), and Sales & Related (652 | 9.6%).
Sales and Office Occupations by Sex
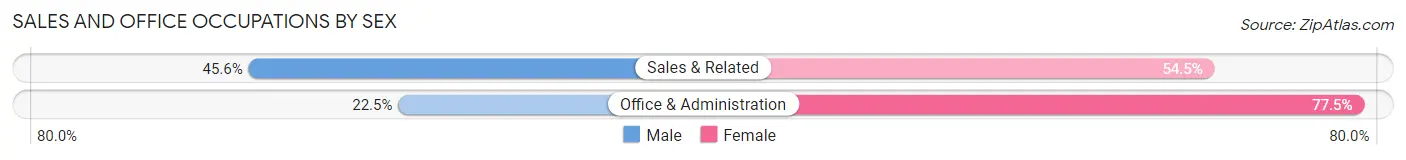
| Occupation | Male | Female |
| Sales & Related | 297 (45.6%) | 355 (54.4%) |
| Office & Administration | 158 (22.5%) | 544 (77.5%) |
| Total (Category) | 455 (33.6%) | 899 (66.4%) |
| Total (Overall) | 3,548 (52.4%) | 3,226 (47.6%) |
Natural Resources, Construction and Maintenance Occupations
The most common Natural Resources, Construction and Maintenance occupations in Florham Park borough are Construction & Extraction (160 | 2.4%), and Installation, Maintenance & Repair (128 | 1.9%).
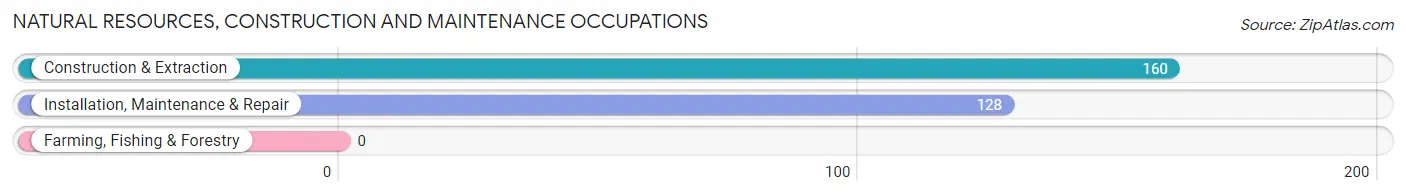
Natural Resources, Construction and Maintenance Occupations by Sex

| Occupation | Male | Female |
| Farming, Fishing & Forestry | 0 (0.0%) | 0 (0.0%) |
| Construction & Extraction | 160 (100.0%) | 0 (0.0%) |
| Installation, Maintenance & Repair | 128 (100.0%) | 0 (0.0%) |
| Total (Category) | 288 (100.0%) | 0 (0.0%) |
| Total (Overall) | 3,548 (52.4%) | 3,226 (47.6%) |
Production, Transportation and Moving Occupations
The most common Production, Transportation and Moving occupations in Florham Park borough are Transportation (153 | 2.3%), Material Moving (92 | 1.4%), and Production (65 | 1.0%).
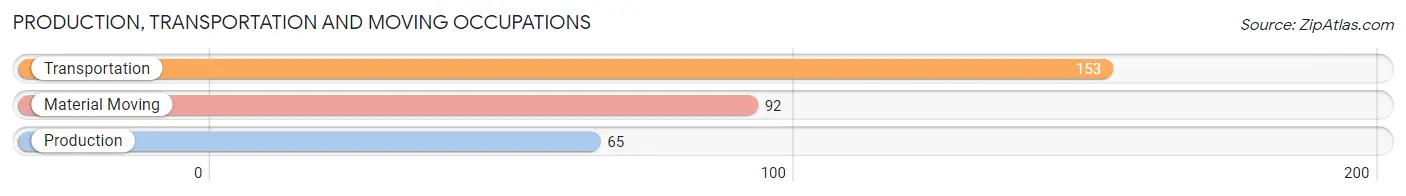
Production, Transportation and Moving Occupations by Sex
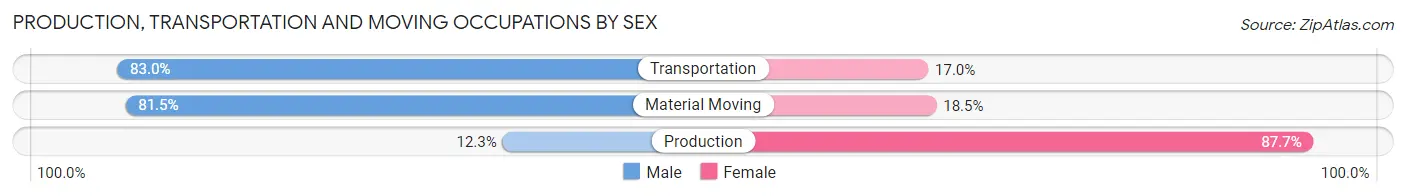
| Occupation | Male | Female |
| Production | 8 (12.3%) | 57 (87.7%) |
| Transportation | 127 (83.0%) | 26 (17.0%) |
| Material Moving | 75 (81.5%) | 17 (18.5%) |
| Total (Category) | 210 (67.7%) | 100 (32.3%) |
| Total (Overall) | 3,548 (52.4%) | 3,226 (47.6%) |
Employment Industries by Sex in Florham Park borough
Employment Industries in Florham Park borough
The major employment industries in Florham Park borough include Educational Services (1,105 | 16.3%), Professional & Scientific (902 | 13.3%), Health Care & Social Assistance (591 | 8.7%), Manufacturing (558 | 8.2%), and Retail Trade (485 | 7.2%).
Employment Industries by Sex in Florham Park borough
The Florham Park borough industries that see more men than women are Utilities (100.0%), Administrative & Support (82.3%), and Transportation & Warehousing (79.6%), whereas the industries that tend to have a higher number of women are Educational Services (77.4%), Retail Trade (69.3%), and Enterprise Management (64.9%).
| Industry | Male | Female |
| Agriculture, Fishing & Hunting | 0 (0.0%) | 0 (0.0%) |
| Mining, Quarrying, & Extraction | 0 (0.0%) | 0 (0.0%) |
| Construction | 344 (78.2%) | 96 (21.8%) |
| Manufacturing | 224 (40.1%) | 334 (59.9%) |
| Wholesale Trade | 109 (59.9%) | 73 (40.1%) |
| Retail Trade | 149 (30.7%) | 336 (69.3%) |
| Transportation & Warehousing | 296 (79.6%) | 76 (20.4%) |
| Utilities | 34 (100.0%) | 0 (0.0%) |
| Information | 108 (57.5%) | 80 (42.5%) |
| Finance & Insurance | 307 (69.6%) | 134 (30.4%) |
| Real Estate, Rental & Leasing | 42 (40.8%) | 61 (59.2%) |
| Professional & Scientific | 618 (68.5%) | 284 (31.5%) |
| Enterprise Management | 47 (35.1%) | 87 (64.9%) |
| Administrative & Support | 317 (82.3%) | 68 (17.7%) |
| Educational Services | 250 (22.6%) | 855 (77.4%) |
| Health Care & Social Assistance | 236 (39.9%) | 355 (60.1%) |
| Arts, Entertainment & Recreation | 53 (49.1%) | 55 (50.9%) |
| Accommodation & Food Services | 199 (75.7%) | 64 (24.3%) |
| Public Administration | 137 (68.5%) | 63 (31.5%) |
| Total | 3,548 (52.4%) | 3,226 (47.6%) |
Education in Florham Park borough
School Enrollment in Florham Park borough
The most common levels of schooling among the 4,034 students in Florham Park borough are college / undergraduate (1,871 | 46.4%), high school (630 | 15.6%), and middle school (448 | 11.1%).
| School Level | # Students | % Students |
| Nursery / Preschool | 307 | 7.6% |
| Kindergarten | 72 | 1.8% |
| Elementary School | 405 | 10.0% |
| Middle School | 448 | 11.1% |
| High School | 630 | 15.6% |
| College / Undergraduate | 1,871 | 46.4% |
| Graduate / Professional | 301 | 7.5% |
| Total | 4,034 | 100.0% |
School Enrollment by Age by Funding Source in Florham Park borough
Out of a total of 4,034 students who are enrolled in schools in Florham Park borough, 2,453 (60.8%) attend a private institution, while the remaining 1,581 (39.2%) are enrolled in public schools. The age group of 20 to 24 year olds has the highest likelihood of being enrolled in private schools, with 1,126 (88.7% in the age bracket) enrolled. Conversely, the age group of 15 to 17 year olds has the lowest likelihood of being enrolled in a private school, with 452 (89.1% in the age bracket) attending a public institution.
| Age Bracket | Public School | Private School |
| 3 to 4 Year Olds | 34 (15.6%) | 184 (84.4%) |
| 5 to 9 Year Old | 327 (59.4%) | 224 (40.6%) |
| 10 to 14 Year Olds | 422 (74.4%) | 145 (25.6%) |
| 15 to 17 Year Olds | 452 (89.1%) | 55 (10.8%) |
| 18 to 19 Year Olds | 109 (15.5%) | 594 (84.5%) |
| 20 to 24 Year Olds | 144 (11.3%) | 1,126 (88.7%) |
| 25 to 34 Year Olds | 76 (55.1%) | 62 (44.9%) |
| 35 Years and over | 18 (22.5%) | 62 (77.5%) |
| Total | 1,581 (39.2%) | 2,453 (60.8%) |
Educational Attainment by Field of Study in Florham Park borough
Business (1,279 | 21.2%), social sciences (619 | 10.3%), science & technology (616 | 10.2%), psychology (507 | 8.4%), and education (503 | 8.4%) are the most common fields of study among 6,026 individuals in Florham Park borough who have obtained a bachelor's degree or higher.
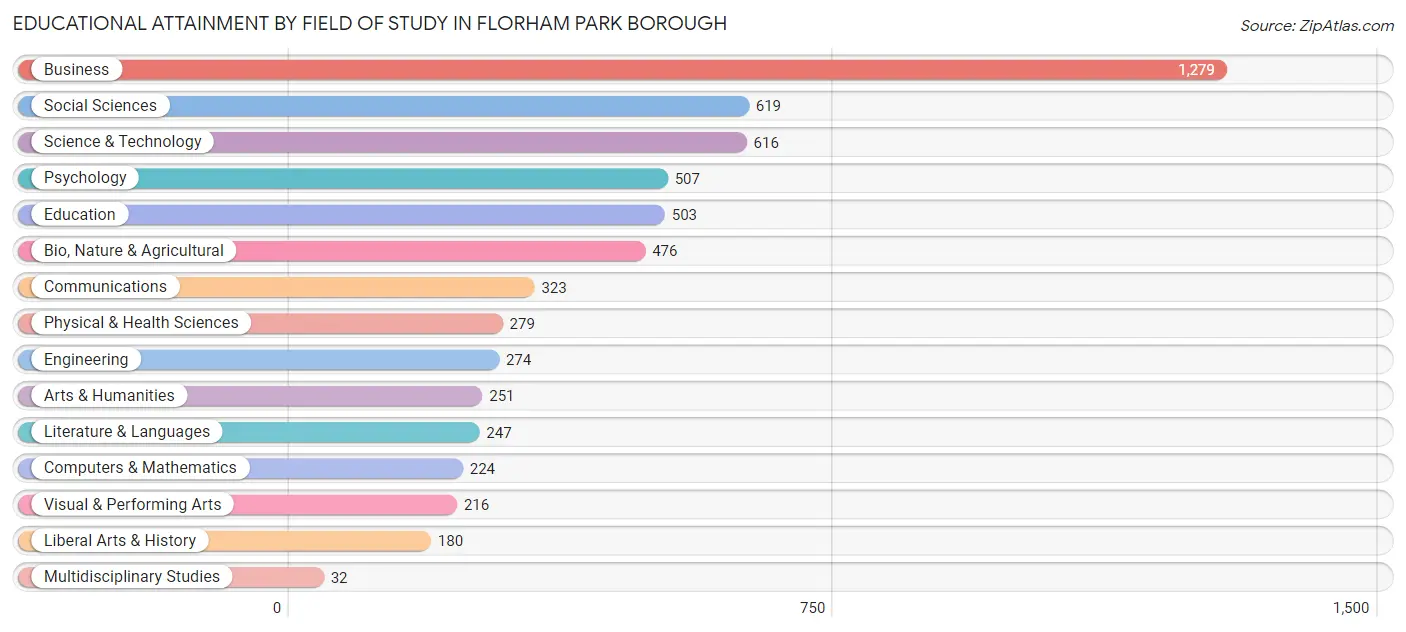
| Field of Study | # Graduates | % Graduates |
| Computers & Mathematics | 224 | 3.7% |
| Bio, Nature & Agricultural | 476 | 7.9% |
| Physical & Health Sciences | 279 | 4.6% |
| Psychology | 507 | 8.4% |
| Social Sciences | 619 | 10.3% |
| Engineering | 274 | 4.5% |
| Multidisciplinary Studies | 32 | 0.5% |
| Science & Technology | 616 | 10.2% |
| Business | 1,279 | 21.2% |
| Education | 503 | 8.4% |
| Literature & Languages | 247 | 4.1% |
| Liberal Arts & History | 180 | 3.0% |
| Visual & Performing Arts | 216 | 3.6% |
| Communications | 323 | 5.4% |
| Arts & Humanities | 251 | 4.2% |
| Total | 6,026 | 100.0% |
Transportation & Commute in Florham Park borough
Vehicle Availability by Sex in Florham Park borough
The most prevalent vehicle ownership categories in Florham Park borough are males with 2 vehicles (1,316, accounting for 41.9%) and females with 2 vehicles (1,075, making up 49.3%).
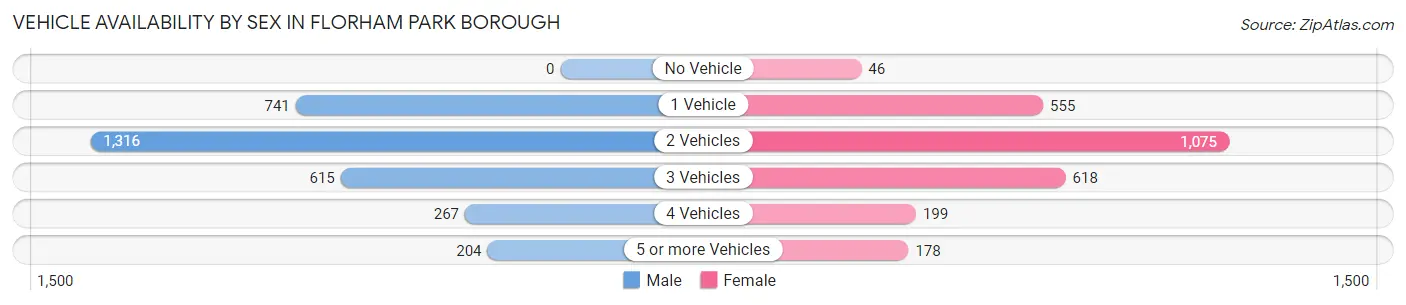
| Vehicles Available | Male | Female |
| No Vehicle | 0 (0.0%) | 46 (1.7%) |
| 1 Vehicle | 741 (23.6%) | 555 (20.8%) |
| 2 Vehicles | 1,316 (41.9%) | 1,075 (40.3%) |
| 3 Vehicles | 615 (19.6%) | 618 (23.1%) |
| 4 Vehicles | 267 (8.5%) | 199 (7.4%) |
| 5 or more Vehicles | 204 (6.5%) | 178 (6.7%) |
| Total | 3,143 (100.0%) | 2,671 (100.0%) |
Commute Time in Florham Park borough
The most frequently occuring commute durations in Florham Park borough are 15 to 19 minutes (939 commuters, 18.5%), 10 to 14 minutes (749 commuters, 14.7%), and 30 to 34 minutes (583 commuters, 11.5%).
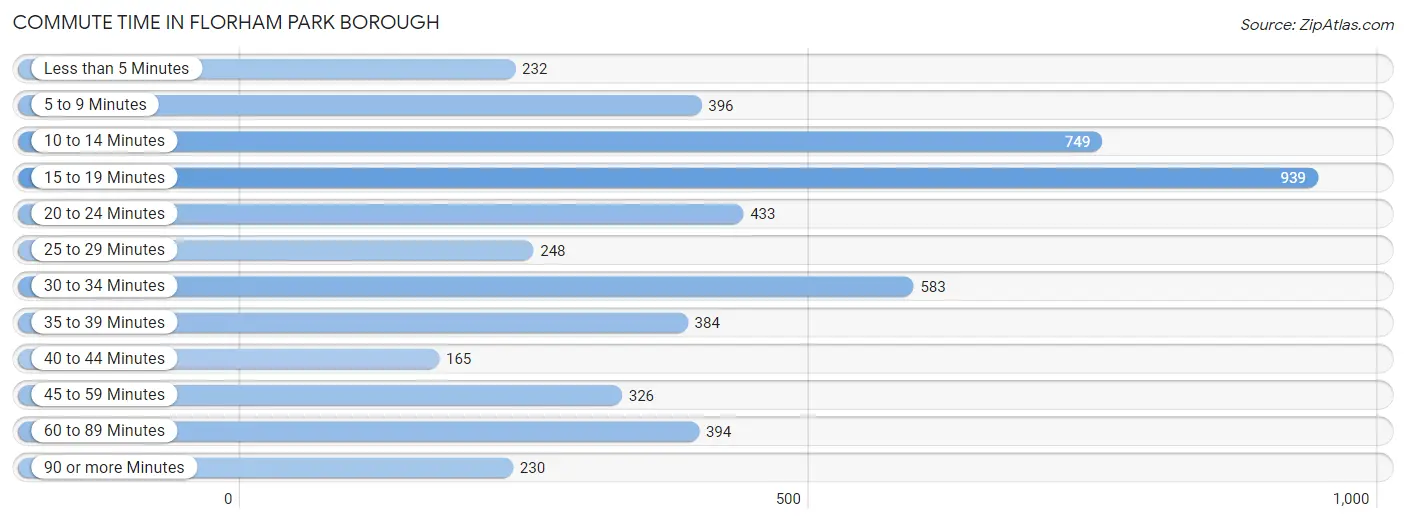
| Commute Time | # Commuters | % Commuters |
| Less than 5 Minutes | 232 | 4.6% |
| 5 to 9 Minutes | 396 | 7.8% |
| 10 to 14 Minutes | 749 | 14.7% |
| 15 to 19 Minutes | 939 | 18.5% |
| 20 to 24 Minutes | 433 | 8.5% |
| 25 to 29 Minutes | 248 | 4.9% |
| 30 to 34 Minutes | 583 | 11.5% |
| 35 to 39 Minutes | 384 | 7.6% |
| 40 to 44 Minutes | 165 | 3.3% |
| 45 to 59 Minutes | 326 | 6.4% |
| 60 to 89 Minutes | 394 | 7.8% |
| 90 or more Minutes | 230 | 4.5% |
Commute Time by Sex in Florham Park borough
The most common commute times in Florham Park borough are 15 to 19 minutes (413 commuters, 15.2%) for males and 15 to 19 minutes (526 commuters, 22.3%) for females.
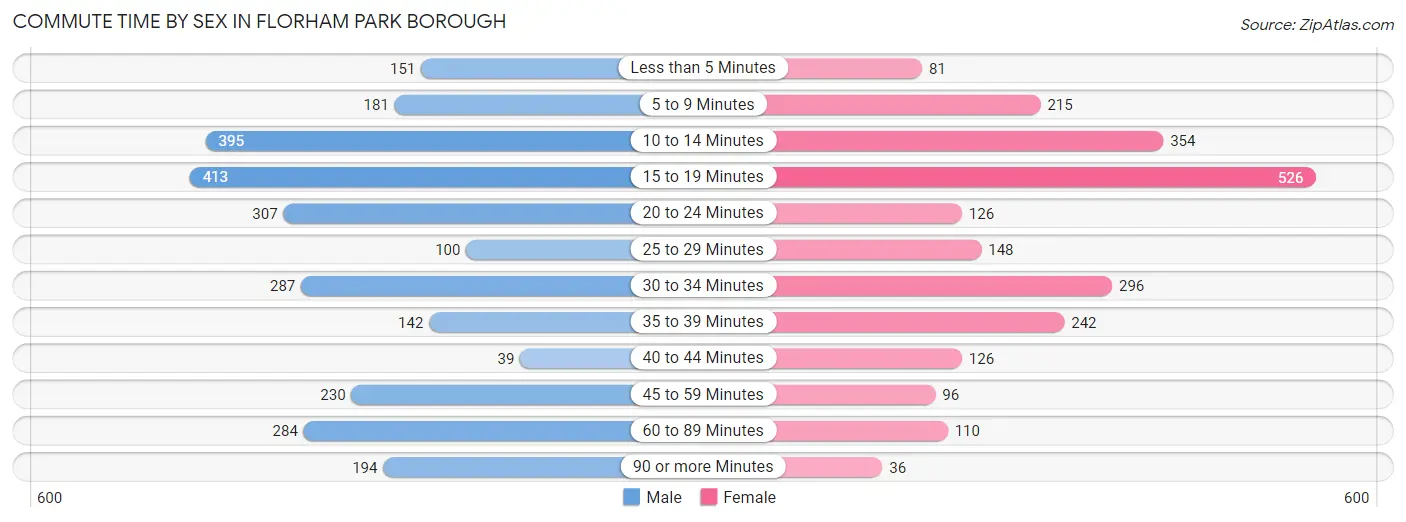
| Commute Time | Male | Female |
| Less than 5 Minutes | 151 (5.6%) | 81 (3.4%) |
| 5 to 9 Minutes | 181 (6.7%) | 215 (9.1%) |
| 10 to 14 Minutes | 395 (14.5%) | 354 (15.0%) |
| 15 to 19 Minutes | 413 (15.2%) | 526 (22.3%) |
| 20 to 24 Minutes | 307 (11.3%) | 126 (5.3%) |
| 25 to 29 Minutes | 100 (3.7%) | 148 (6.3%) |
| 30 to 34 Minutes | 287 (10.5%) | 296 (12.6%) |
| 35 to 39 Minutes | 142 (5.2%) | 242 (10.3%) |
| 40 to 44 Minutes | 39 (1.4%) | 126 (5.3%) |
| 45 to 59 Minutes | 230 (8.5%) | 96 (4.1%) |
| 60 to 89 Minutes | 284 (10.4%) | 110 (4.7%) |
| 90 or more Minutes | 194 (7.1%) | 36 (1.5%) |
Time of Departure to Work by Sex in Florham Park borough
The most frequent times of departure to work in Florham Park borough are 8:00 AM to 8:29 AM (440, 16.2%) for males and 7:30 AM to 7:59 AM (489, 20.8%) for females.
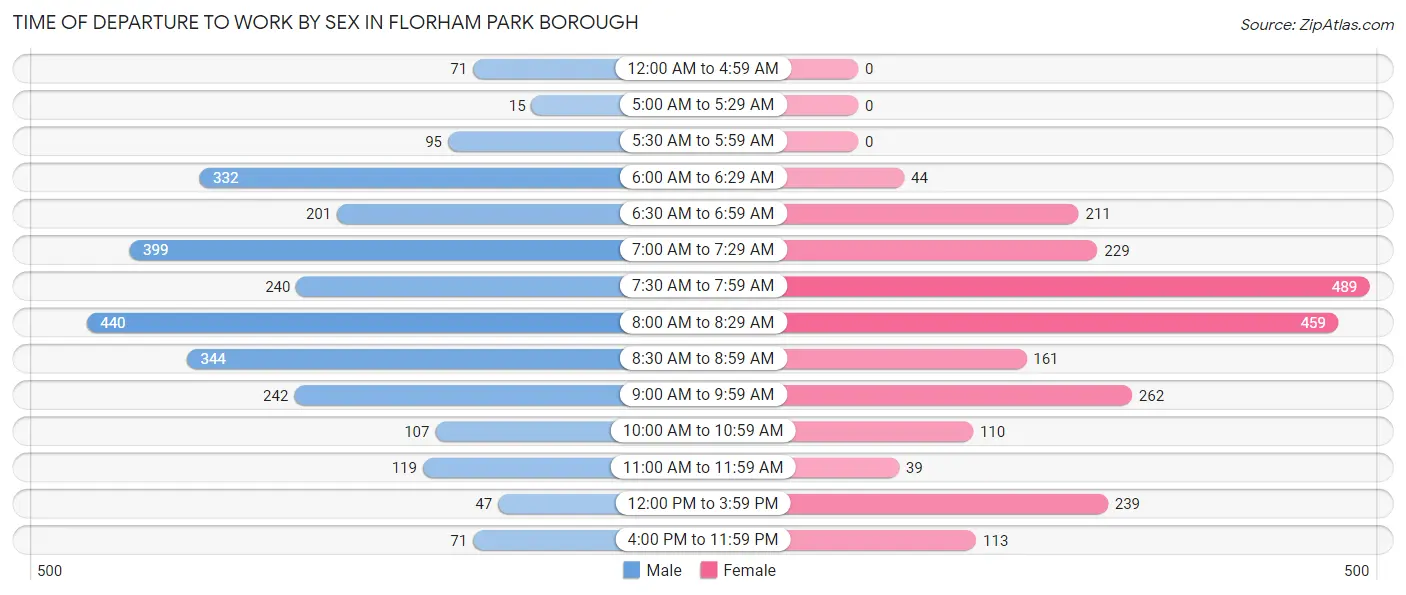
| Time of Departure | Male | Female |
| 12:00 AM to 4:59 AM | 71 (2.6%) | 0 (0.0%) |
| 5:00 AM to 5:29 AM | 15 (0.5%) | 0 (0.0%) |
| 5:30 AM to 5:59 AM | 95 (3.5%) | 0 (0.0%) |
| 6:00 AM to 6:29 AM | 332 (12.2%) | 44 (1.9%) |
| 6:30 AM to 6:59 AM | 201 (7.4%) | 211 (9.0%) |
| 7:00 AM to 7:29 AM | 399 (14.6%) | 229 (9.7%) |
| 7:30 AM to 7:59 AM | 240 (8.8%) | 489 (20.8%) |
| 8:00 AM to 8:29 AM | 440 (16.2%) | 459 (19.5%) |
| 8:30 AM to 8:59 AM | 344 (12.6%) | 161 (6.8%) |
| 9:00 AM to 9:59 AM | 242 (8.9%) | 262 (11.1%) |
| 10:00 AM to 10:59 AM | 107 (3.9%) | 110 (4.7%) |
| 11:00 AM to 11:59 AM | 119 (4.4%) | 39 (1.7%) |
| 12:00 PM to 3:59 PM | 47 (1.7%) | 239 (10.1%) |
| 4:00 PM to 11:59 PM | 71 (2.6%) | 113 (4.8%) |
| Total | 2,723 (100.0%) | 2,356 (100.0%) |
Housing Occupancy in Florham Park borough
Occupancy by Ownership in Florham Park borough
Of the total 4,530 dwellings in Florham Park borough, owner-occupied units account for 3,148 (69.5%), while renter-occupied units make up 1,382 (30.5%).
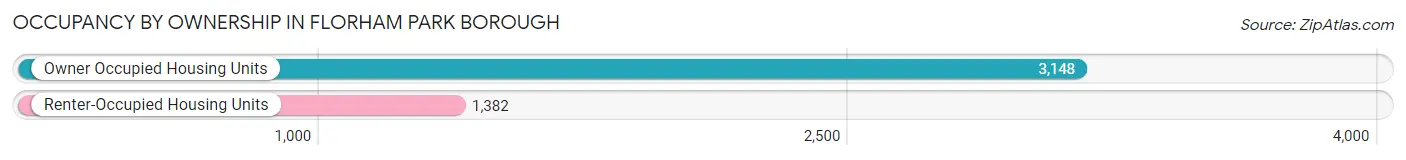
| Occupancy | # Housing Units | % Housing Units |
| Owner Occupied Housing Units | 3,148 | 69.5% |
| Renter-Occupied Housing Units | 1,382 | 30.5% |
| Total Occupied Housing Units | 4,530 | 100.0% |
Occupancy by Household Size in Florham Park borough
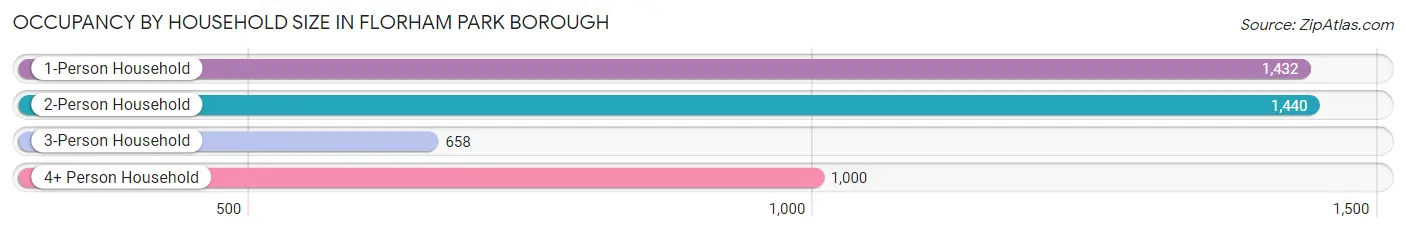
| Household Size | # Housing Units | % Housing Units |
| 1-Person Household | 1,432 | 31.6% |
| 2-Person Household | 1,440 | 31.8% |
| 3-Person Household | 658 | 14.5% |
| 4+ Person Household | 1,000 | 22.1% |
| Total Housing Units | 4,530 | 100.0% |
Occupancy by Ownership by Household Size in Florham Park borough
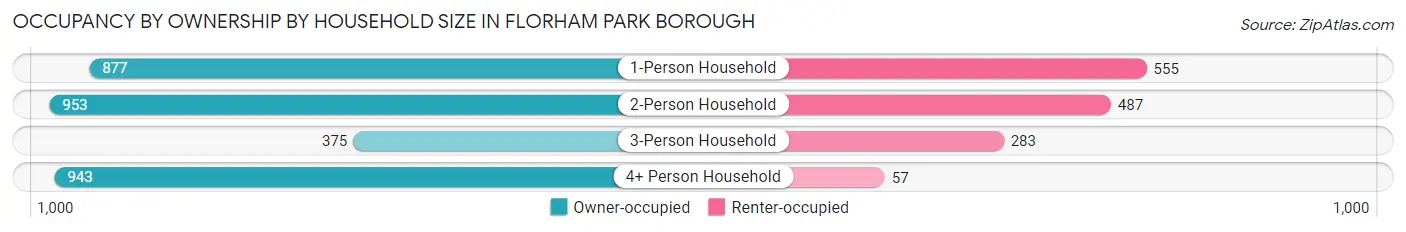
| Household Size | Owner-occupied | Renter-occupied |
| 1-Person Household | 877 (61.2%) | 555 (38.8%) |
| 2-Person Household | 953 (66.2%) | 487 (33.8%) |
| 3-Person Household | 375 (57.0%) | 283 (43.0%) |
| 4+ Person Household | 943 (94.3%) | 57 (5.7%) |
| Total Housing Units | 3,148 (69.5%) | 1,382 (30.5%) |
Occupancy by Educational Attainment in Florham Park borough
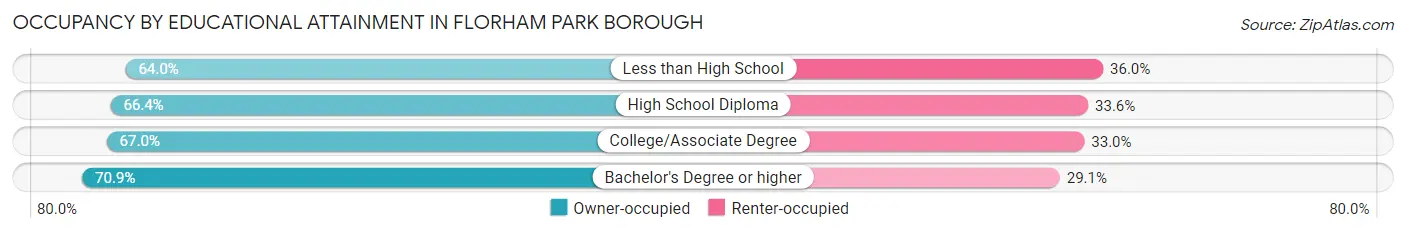
| Household Size | Owner-occupied | Renter-occupied |
| Less than High School | 32 (64.0%) | 18 (36.0%) |
| High School Diploma | 387 (66.4%) | 196 (33.6%) |
| College/Associate Degree | 564 (67.0%) | 278 (33.0%) |
| Bachelor's Degree or higher | 2,165 (70.9%) | 890 (29.1%) |
Occupancy by Age of Householder in Florham Park borough
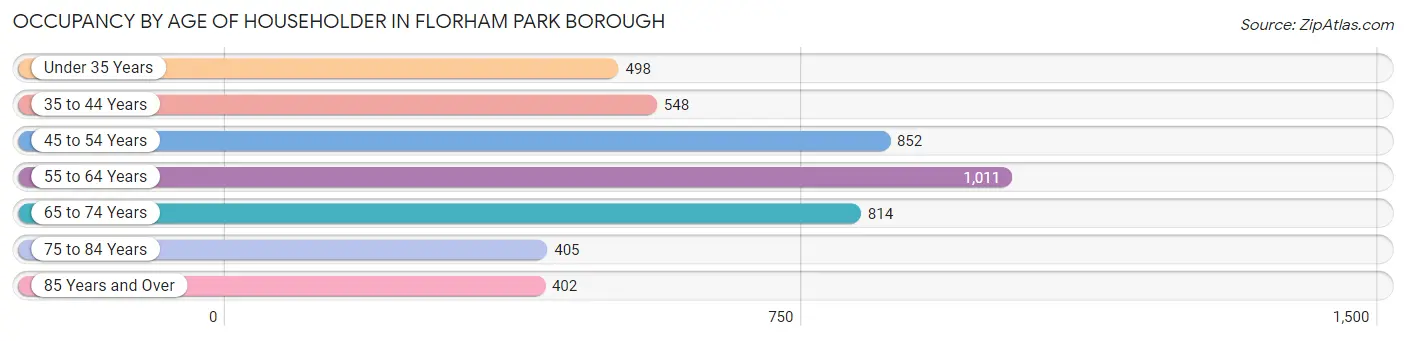
| Age Bracket | # Households | % Households |
| Under 35 Years | 498 | 11.0% |
| 35 to 44 Years | 548 | 12.1% |
| 45 to 54 Years | 852 | 18.8% |
| 55 to 64 Years | 1,011 | 22.3% |
| 65 to 74 Years | 814 | 18.0% |
| 75 to 84 Years | 405 | 8.9% |
| 85 Years and Over | 402 | 8.9% |
| Total | 4,530 | 100.0% |
Housing Finances in Florham Park borough
Median Income by Occupancy in Florham Park borough
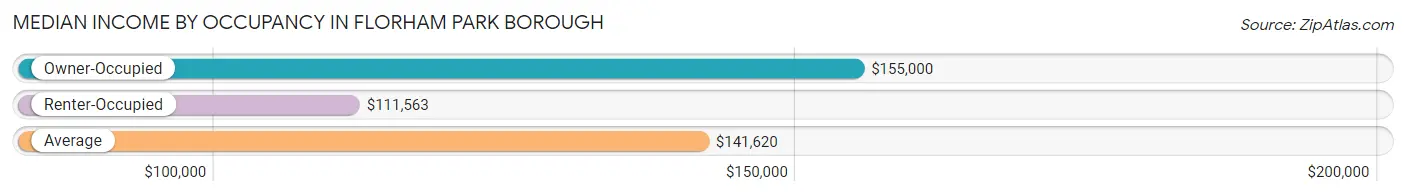
| Occupancy Type | # Households | Median Income |
| Owner-Occupied | 3,148 (69.5%) | $155,000 |
| Renter-Occupied | 1,382 (30.5%) | $111,563 |
| Average | 4,530 (100.0%) | $141,620 |
Occupancy by Householder Income Bracket in Florham Park borough
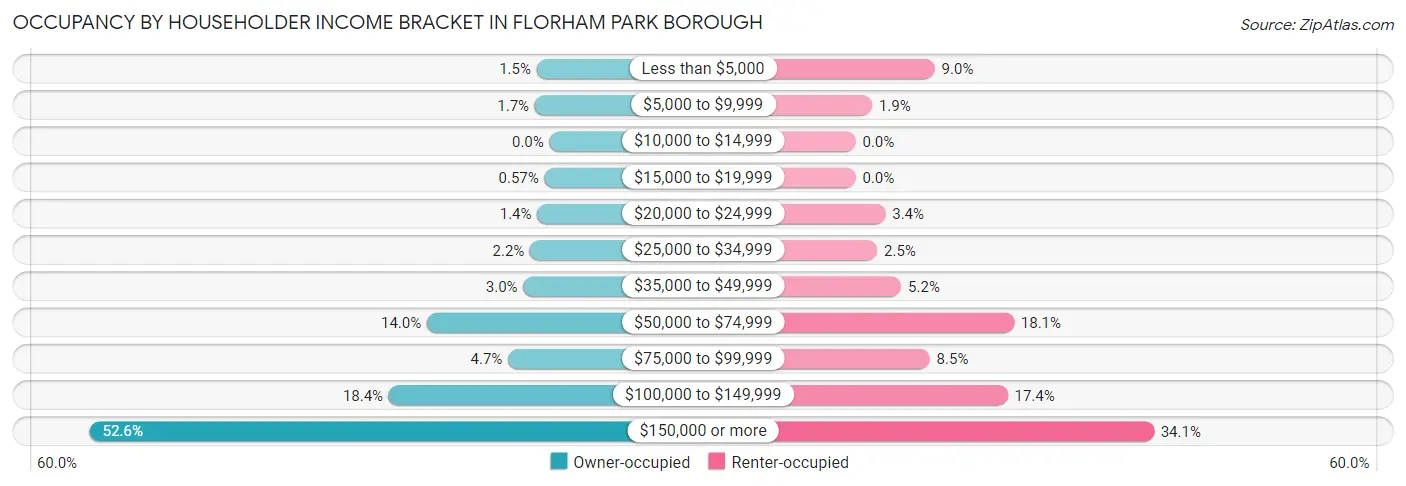
| Income Bracket | Owner-occupied | Renter-occupied |
| Less than $5,000 | 46 (1.5%) | 125 (9.0%) |
| $5,000 to $9,999 | 53 (1.7%) | 26 (1.9%) |
| $10,000 to $14,999 | 0 (0.0%) | 0 (0.0%) |
| $15,000 to $19,999 | 18 (0.6%) | 0 (0.0%) |
| $20,000 to $24,999 | 44 (1.4%) | 47 (3.4%) |
| $25,000 to $34,999 | 70 (2.2%) | 34 (2.5%) |
| $35,000 to $49,999 | 94 (3.0%) | 72 (5.2%) |
| $50,000 to $74,999 | 441 (14.0%) | 250 (18.1%) |
| $75,000 to $99,999 | 149 (4.7%) | 117 (8.5%) |
| $100,000 to $149,999 | 578 (18.4%) | 240 (17.4%) |
| $150,000 or more | 1,655 (52.6%) | 471 (34.1%) |
| Total | 3,148 (100.0%) | 1,382 (100.0%) |
Monthly Housing Cost Tiers in Florham Park borough
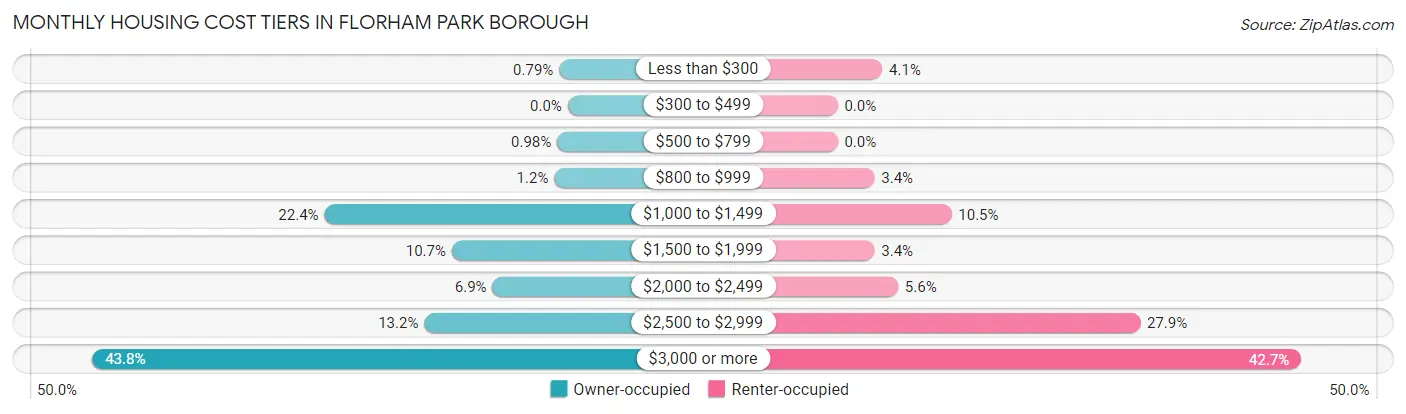
| Monthly Cost | Owner-occupied | Renter-occupied |
| Less than $300 | 25 (0.8%) | 57 (4.1%) |
| $300 to $499 | 0 (0.0%) | 0 (0.0%) |
| $500 to $799 | 31 (1.0%) | 0 (0.0%) |
| $800 to $999 | 39 (1.2%) | 47 (3.4%) |
| $1,000 to $1,499 | 705 (22.4%) | 145 (10.5%) |
| $1,500 to $1,999 | 336 (10.7%) | 47 (3.4%) |
| $2,000 to $2,499 | 218 (6.9%) | 77 (5.6%) |
| $2,500 to $2,999 | 416 (13.2%) | 385 (27.9%) |
| $3,000 or more | 1,378 (43.8%) | 590 (42.7%) |
| Total | 3,148 (100.0%) | 1,382 (100.0%) |
Physical Housing Characteristics in Florham Park borough
Housing Structures in Florham Park borough
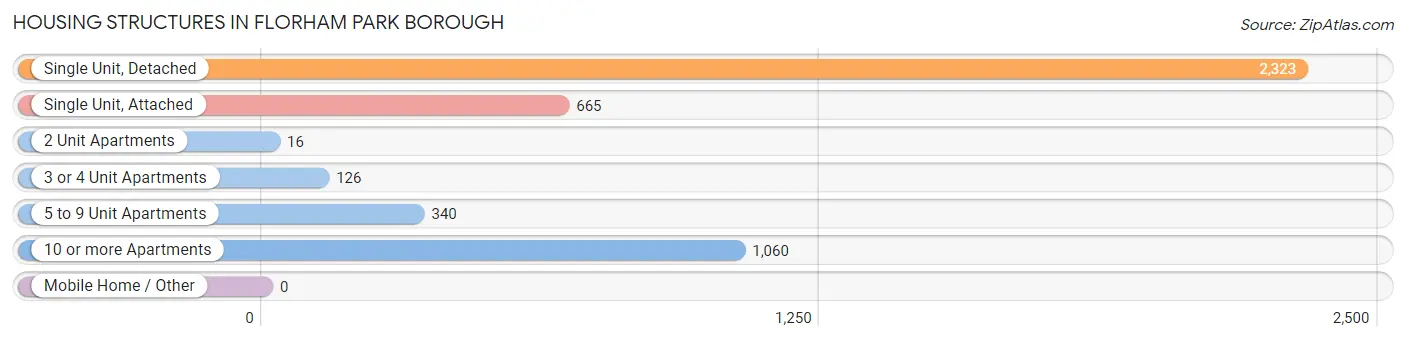
| Structure Type | # Housing Units | % Housing Units |
| Single Unit, Detached | 2,323 | 51.3% |
| Single Unit, Attached | 665 | 14.7% |
| 2 Unit Apartments | 16 | 0.4% |
| 3 or 4 Unit Apartments | 126 | 2.8% |
| 5 to 9 Unit Apartments | 340 | 7.5% |
| 10 or more Apartments | 1,060 | 23.4% |
| Mobile Home / Other | 0 | 0.0% |
| Total | 4,530 | 100.0% |
Housing Structures by Occupancy in Florham Park borough
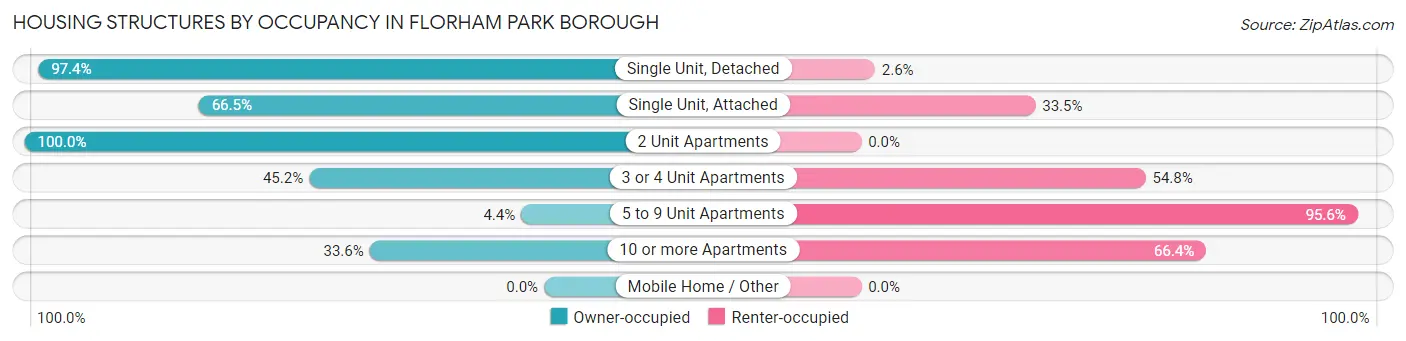
| Structure Type | Owner-occupied | Renter-occupied |
| Single Unit, Detached | 2,262 (97.4%) | 61 (2.6%) |
| Single Unit, Attached | 442 (66.5%) | 223 (33.5%) |
| 2 Unit Apartments | 16 (100.0%) | 0 (0.0%) |
| 3 or 4 Unit Apartments | 57 (45.2%) | 69 (54.8%) |
| 5 to 9 Unit Apartments | 15 (4.4%) | 325 (95.6%) |
| 10 or more Apartments | 356 (33.6%) | 704 (66.4%) |
| Mobile Home / Other | 0 (0.0%) | 0 (0.0%) |
| Total | 3,148 (69.5%) | 1,382 (30.5%) |
Housing Structures by Number of Rooms in Florham Park borough
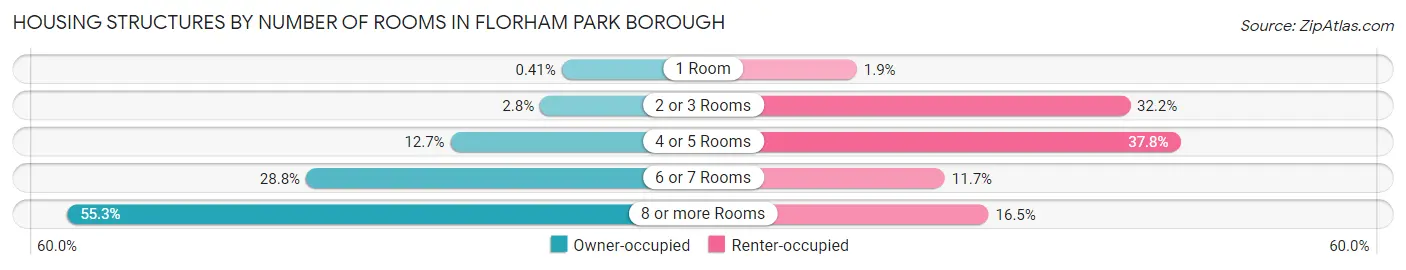
| Number of Rooms | Owner-occupied | Renter-occupied |
| 1 Room | 13 (0.4%) | 26 (1.9%) |
| 2 or 3 Rooms | 88 (2.8%) | 445 (32.2%) |
| 4 or 5 Rooms | 401 (12.7%) | 522 (37.8%) |
| 6 or 7 Rooms | 906 (28.8%) | 161 (11.7%) |
| 8 or more Rooms | 1,740 (55.3%) | 228 (16.5%) |
| Total | 3,148 (100.0%) | 1,382 (100.0%) |
Housing Structure by Heating Type in Florham Park borough
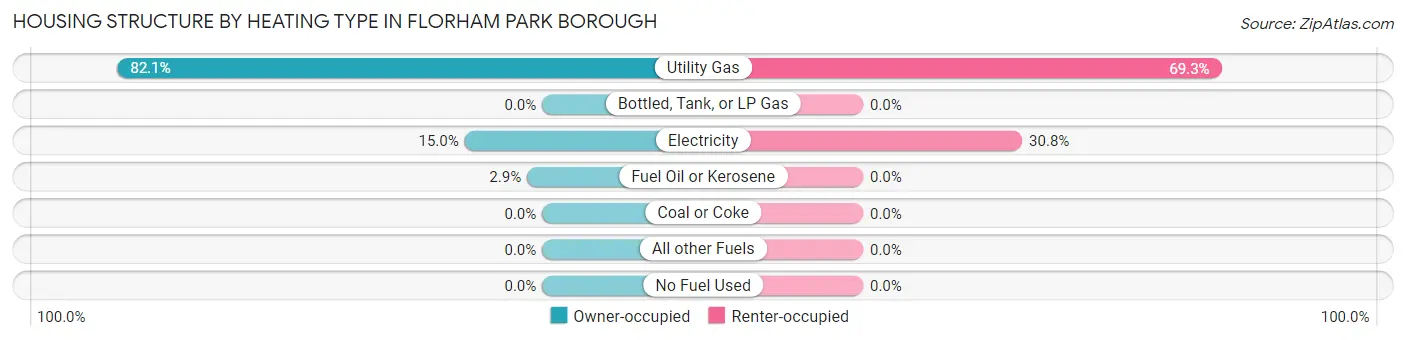
| Heating Type | Owner-occupied | Renter-occupied |
| Utility Gas | 2,584 (82.1%) | 957 (69.3%) |
| Bottled, Tank, or LP Gas | 0 (0.0%) | 0 (0.0%) |
| Electricity | 472 (15.0%) | 425 (30.7%) |
| Fuel Oil or Kerosene | 92 (2.9%) | 0 (0.0%) |
| Coal or Coke | 0 (0.0%) | 0 (0.0%) |
| All other Fuels | 0 (0.0%) | 0 (0.0%) |
| No Fuel Used | 0 (0.0%) | 0 (0.0%) |
| Total | 3,148 (100.0%) | 1,382 (100.0%) |
Household Vehicle Usage in Florham Park borough
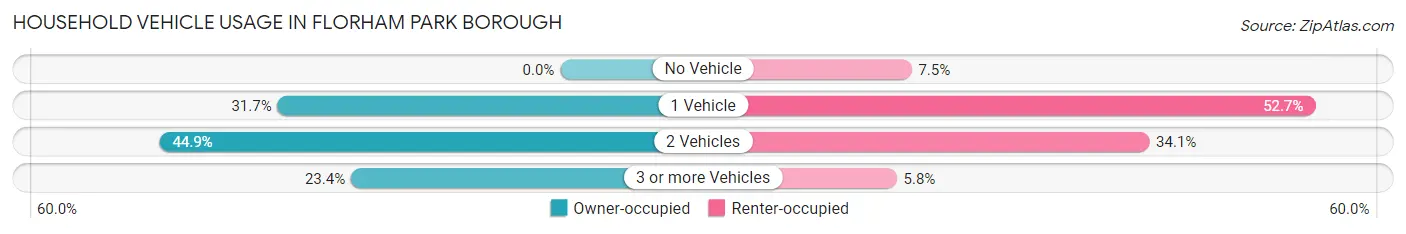
| Vehicles per Household | Owner-occupied | Renter-occupied |
| No Vehicle | 0 (0.0%) | 103 (7.4%) |
| 1 Vehicle | 997 (31.7%) | 728 (52.7%) |
| 2 Vehicles | 1,413 (44.9%) | 471 (34.1%) |
| 3 or more Vehicles | 738 (23.4%) | 80 (5.8%) |
| Total | 3,148 (100.0%) | 1,382 (100.0%) |
Real Estate & Mortgages in Florham Park borough
Real Estate and Mortgage Overview in Florham Park borough
| Characteristic | Without Mortgage | With Mortgage |
| Housing Units | 1,142 | 2,006 |
| Median Property Value | $662,300 | $736,000 |
| Median Household Income | $112,778 | $1,194 |
| Monthly Housing Costs | $1,340 | $1,317 |
| Real Estate Taxes | $10,001 | $0 |
Property Value by Mortgage Status in Florham Park borough
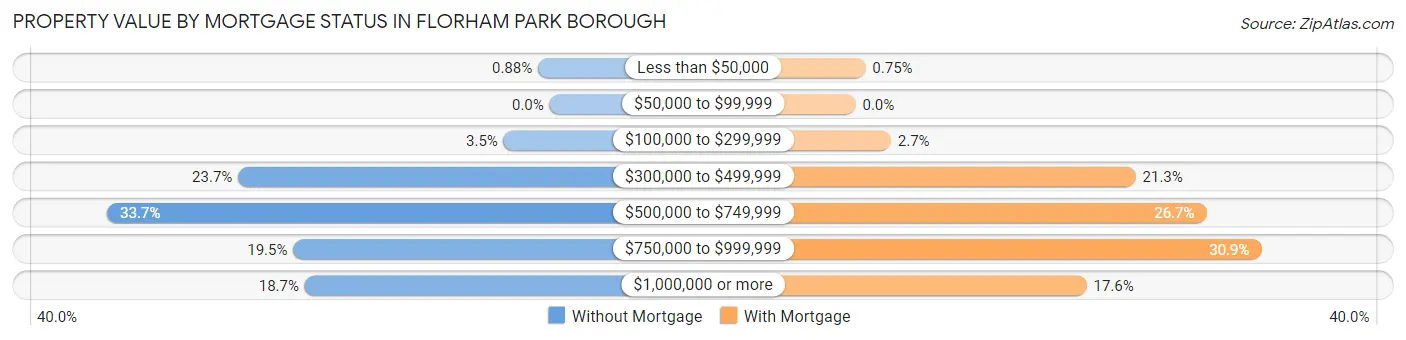
| Property Value | Without Mortgage | With Mortgage |
| Less than $50,000 | 10 (0.9%) | 15 (0.7%) |
| $50,000 to $99,999 | 0 (0.0%) | 0 (0.0%) |
| $100,000 to $299,999 | 40 (3.5%) | 54 (2.7%) |
| $300,000 to $499,999 | 271 (23.7%) | 428 (21.3%) |
| $500,000 to $749,999 | 385 (33.7%) | 536 (26.7%) |
| $750,000 to $999,999 | 223 (19.5%) | 620 (30.9%) |
| $1,000,000 or more | 213 (18.6%) | 353 (17.6%) |
| Total | 1,142 (100.0%) | 2,006 (100.0%) |
Household Income by Mortgage Status in Florham Park borough
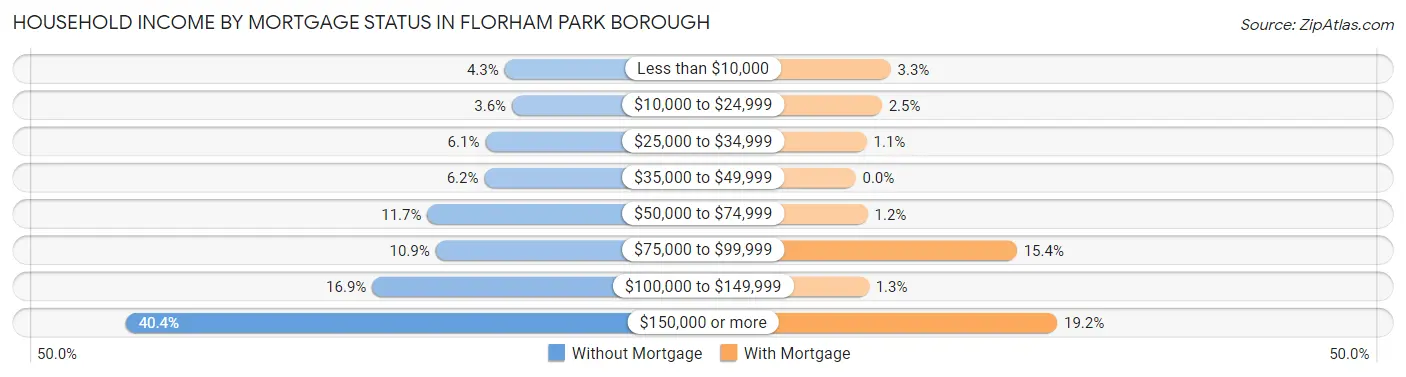
| Household Income | Without Mortgage | With Mortgage |
| Less than $10,000 | 49 (4.3%) | 67 (3.3%) |
| $10,000 to $24,999 | 41 (3.6%) | 50 (2.5%) |
| $25,000 to $34,999 | 70 (6.1%) | 21 (1.1%) |
| $35,000 to $49,999 | 71 (6.2%) | 0 (0.0%) |
| $50,000 to $74,999 | 133 (11.7%) | 23 (1.1%) |
| $75,000 to $99,999 | 124 (10.9%) | 308 (15.3%) |
| $100,000 to $149,999 | 193 (16.9%) | 25 (1.3%) |
| $150,000 or more | 461 (40.4%) | 385 (19.2%) |
| Total | 1,142 (100.0%) | 2,006 (100.0%) |
Property Value to Household Income Ratio in Florham Park borough
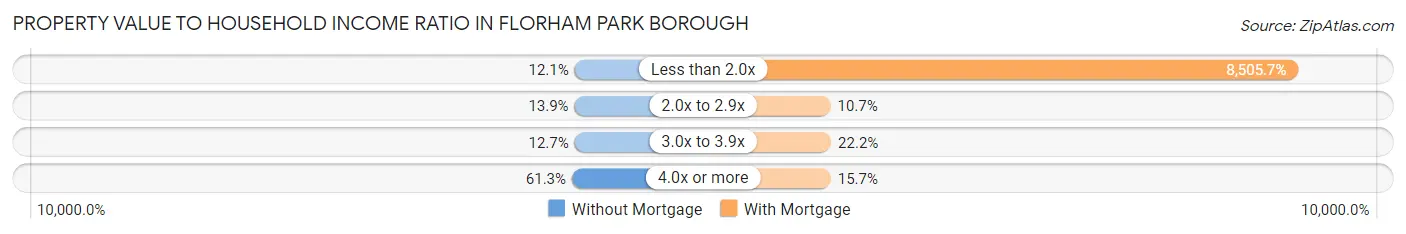
| Value-to-Income Ratio | Without Mortgage | With Mortgage |
| Less than 2.0x | 138 (12.1%) | 170,625 (8,505.7%) |
| 2.0x to 2.9x | 159 (13.9%) | 215 (10.7%) |
| 3.0x to 3.9x | 145 (12.7%) | 445 (22.2%) |
| 4.0x or more | 700 (61.3%) | 314 (15.7%) |
| Total | 1,142 (100.0%) | 2,006 (100.0%) |
Real Estate Taxes by Mortgage Status in Florham Park borough
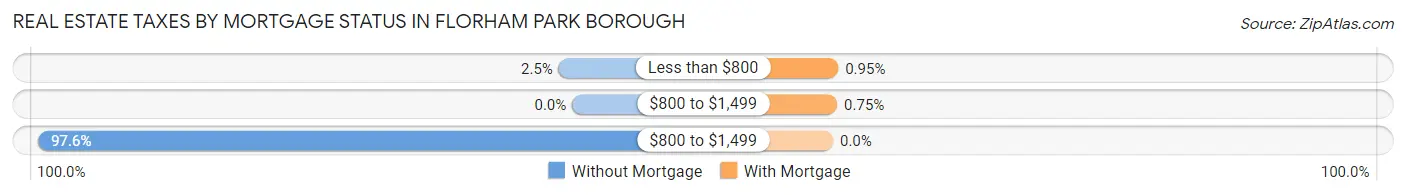
| Property Taxes | Without Mortgage | With Mortgage |
| Less than $800 | 28 (2.5%) | 19 (0.9%) |
| $800 to $1,499 | 0 (0.0%) | 15 (0.7%) |
| $800 to $1,499 | 1,114 (97.6%) | 0 (0.0%) |
| Total | 1,142 (100.0%) | 2,006 (100.0%) |
Health & Disability in Florham Park borough
Health Insurance Coverage by Age in Florham Park borough
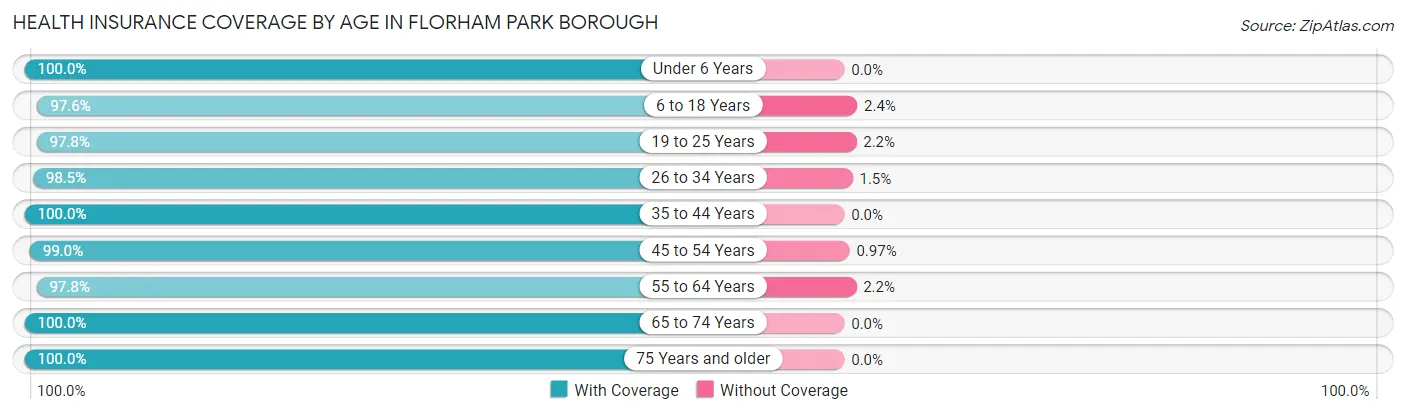
| Age Bracket | With Coverage | Without Coverage |
| Under 6 Years | 588 (100.0%) | 0 (0.0%) |
| 6 to 18 Years | 1,754 (97.6%) | 43 (2.4%) |
| 19 to 25 Years | 2,064 (97.8%) | 47 (2.2%) |
| 26 to 34 Years | 1,093 (98.5%) | 17 (1.5%) |
| 35 to 44 Years | 1,287 (100.0%) | 0 (0.0%) |
| 45 to 54 Years | 1,524 (99.0%) | 15 (1.0%) |
| 55 to 64 Years | 1,626 (97.8%) | 37 (2.2%) |
| 65 to 74 Years | 1,346 (100.0%) | 0 (0.0%) |
| 75 Years and older | 1,275 (100.0%) | 0 (0.0%) |
| Total | 12,557 (98.8%) | 159 (1.3%) |
Health Insurance Coverage by Citizenship Status in Florham Park borough
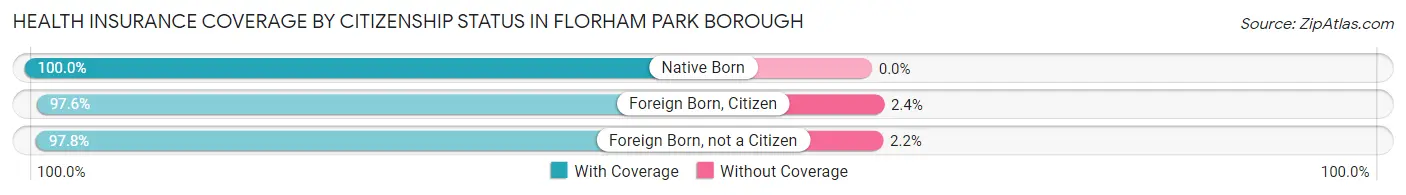
| Citizenship Status | With Coverage | Without Coverage |
| Native Born | 588 (100.0%) | 0 (0.0%) |
| Foreign Born, Citizen | 1,754 (97.6%) | 43 (2.4%) |
| Foreign Born, not a Citizen | 2,064 (97.8%) | 47 (2.2%) |
Health Insurance Coverage by Household Income in Florham Park borough
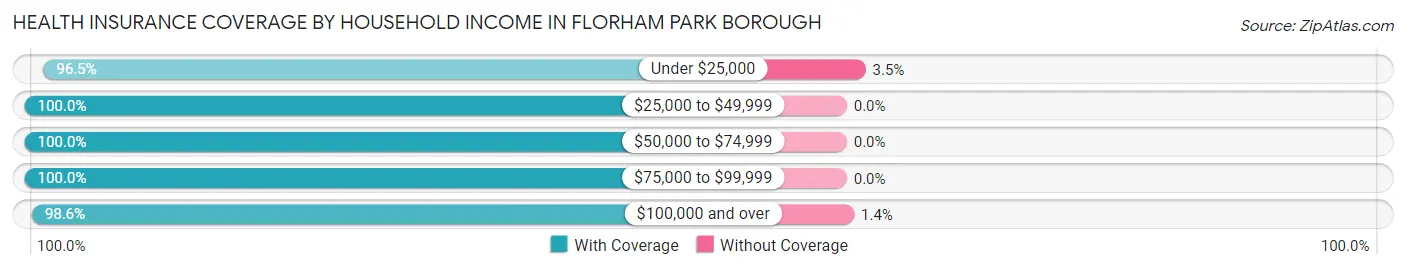
| Household Income | With Coverage | Without Coverage |
| Under $25,000 | 494 (96.5%) | 18 (3.5%) |
| $25,000 to $49,999 | 342 (100.0%) | 0 (0.0%) |
| $50,000 to $74,999 | 923 (100.0%) | 0 (0.0%) |
| $75,000 to $99,999 | 604 (100.0%) | 0 (0.0%) |
| $100,000 and over | 8,568 (98.6%) | 119 (1.4%) |
Public vs Private Health Insurance Coverage by Age in Florham Park borough
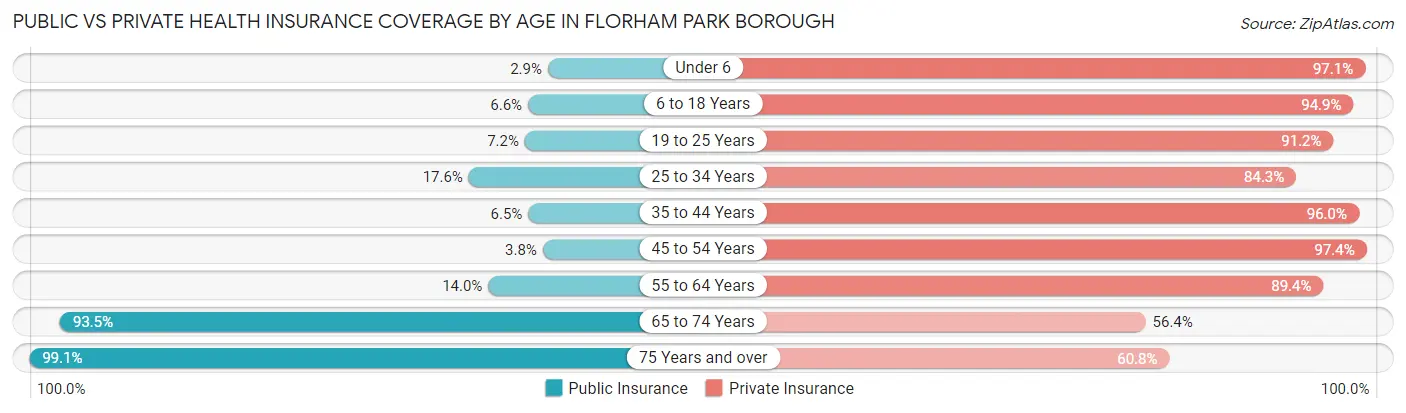
| Age Bracket | Public Insurance | Private Insurance |
| Under 6 | 17 (2.9%) | 571 (97.1%) |
| 6 to 18 Years | 118 (6.6%) | 1,706 (94.9%) |
| 19 to 25 Years | 151 (7.1%) | 1,926 (91.2%) |
| 25 to 34 Years | 195 (17.6%) | 936 (84.3%) |
| 35 to 44 Years | 84 (6.5%) | 1,235 (96.0%) |
| 45 to 54 Years | 59 (3.8%) | 1,499 (97.4%) |
| 55 to 64 Years | 232 (14.0%) | 1,486 (89.4%) |
| 65 to 74 Years | 1,258 (93.5%) | 759 (56.4%) |
| 75 Years and over | 1,264 (99.1%) | 775 (60.8%) |
| Total | 3,378 (26.6%) | 10,893 (85.7%) |
Disability Status by Sex by Age in Florham Park borough
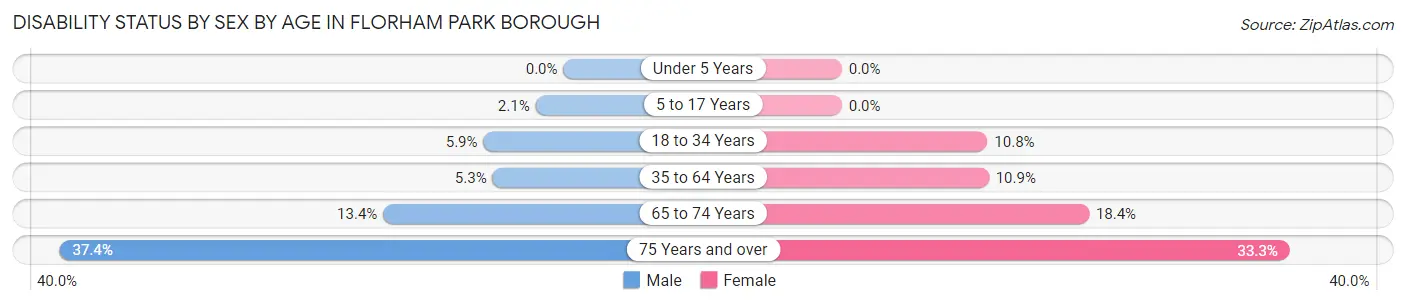
| Age Bracket | Male | Female |
| Under 5 Years | 0 (0.0%) | 0 (0.0%) |
| 5 to 17 Years | 20 (2.1%) | 0 (0.0%) |
| 18 to 34 Years | 112 (5.9%) | 177 (10.8%) |
| 35 to 64 Years | 106 (5.3%) | 270 (10.9%) |
| 65 to 74 Years | 78 (13.4%) | 140 (18.3%) |
| 75 Years and over | 190 (37.4%) | 255 (33.3%) |
Disability Class by Sex by Age in Florham Park borough
Disability Class: Hearing Difficulty
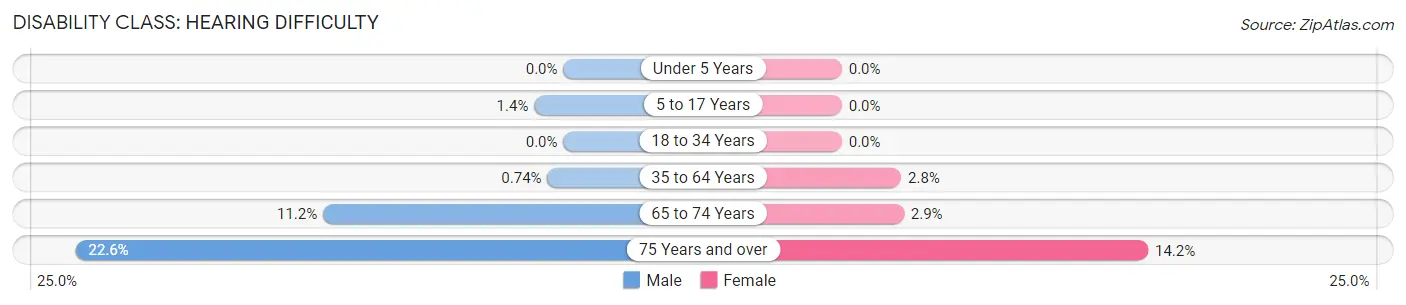
| Age Bracket | Male | Female |
| Under 5 Years | 0 (0.0%) | 0 (0.0%) |
| 5 to 17 Years | 13 (1.3%) | 0 (0.0%) |
| 18 to 34 Years | 0 (0.0%) | 0 (0.0%) |
| 35 to 64 Years | 15 (0.7%) | 68 (2.8%) |
| 65 to 74 Years | 65 (11.2%) | 22 (2.9%) |
| 75 Years and over | 115 (22.6%) | 109 (14.2%) |
Disability Class: Vision Difficulty
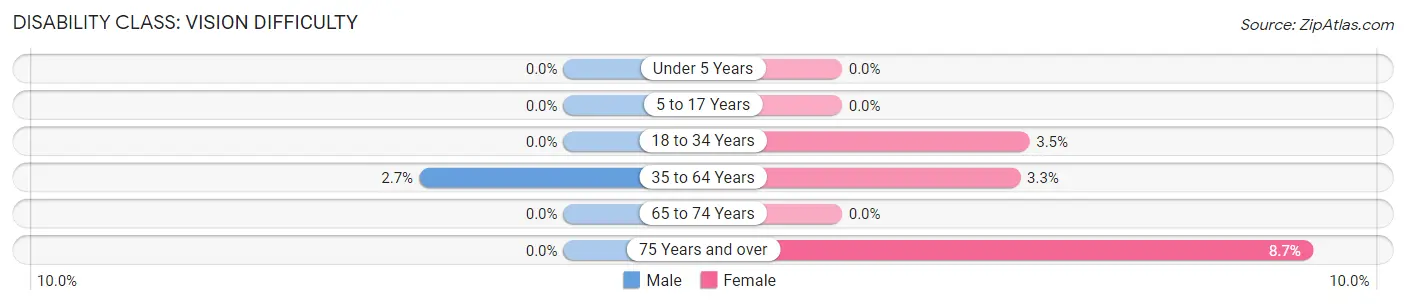
| Age Bracket | Male | Female |
| Under 5 Years | 0 (0.0%) | 0 (0.0%) |
| 5 to 17 Years | 0 (0.0%) | 0 (0.0%) |
| 18 to 34 Years | 0 (0.0%) | 57 (3.5%) |
| 35 to 64 Years | 54 (2.7%) | 82 (3.3%) |
| 65 to 74 Years | 0 (0.0%) | 0 (0.0%) |
| 75 Years and over | 0 (0.0%) | 67 (8.7%) |
Disability Class: Cognitive Difficulty
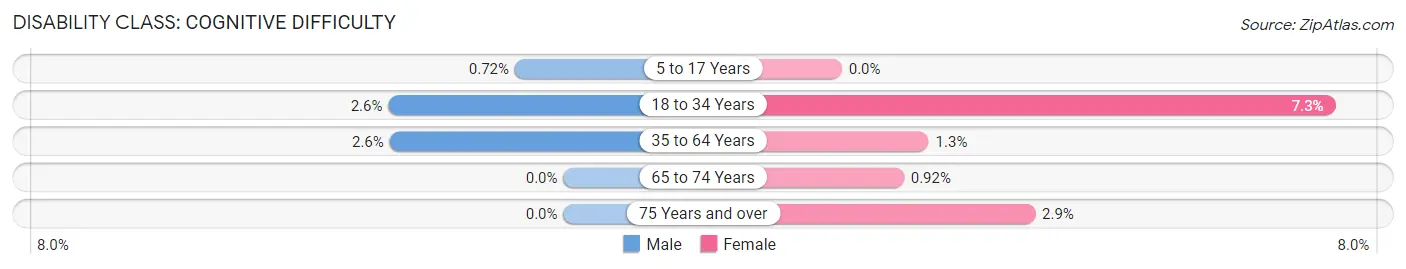
| Age Bracket | Male | Female |
| 5 to 17 Years | 7 (0.7%) | 0 (0.0%) |
| 18 to 34 Years | 49 (2.6%) | 120 (7.3%) |
| 35 to 64 Years | 52 (2.6%) | 32 (1.3%) |
| 65 to 74 Years | 0 (0.0%) | 7 (0.9%) |
| 75 Years and over | 0 (0.0%) | 22 (2.9%) |
Disability Class: Ambulatory Difficulty
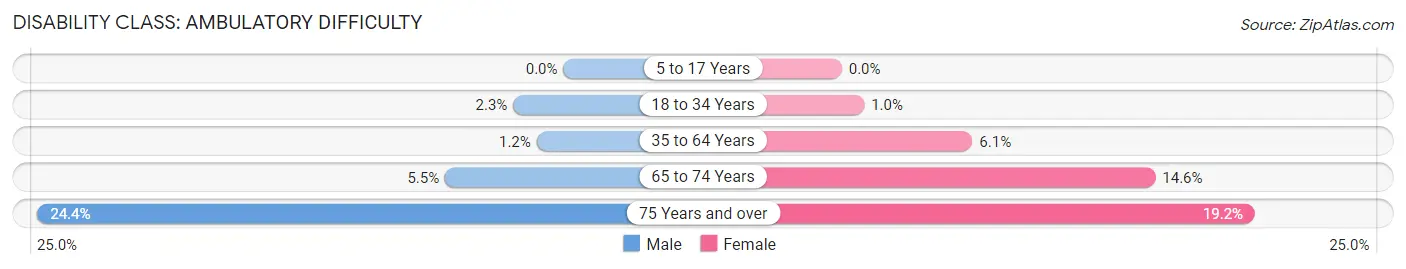
| Age Bracket | Male | Female |
| 5 to 17 Years | 0 (0.0%) | 0 (0.0%) |
| 18 to 34 Years | 44 (2.3%) | 17 (1.0%) |
| 35 to 64 Years | 25 (1.2%) | 150 (6.1%) |
| 65 to 74 Years | 32 (5.5%) | 111 (14.5%) |
| 75 Years and over | 124 (24.4%) | 147 (19.2%) |
Disability Class: Self-Care Difficulty
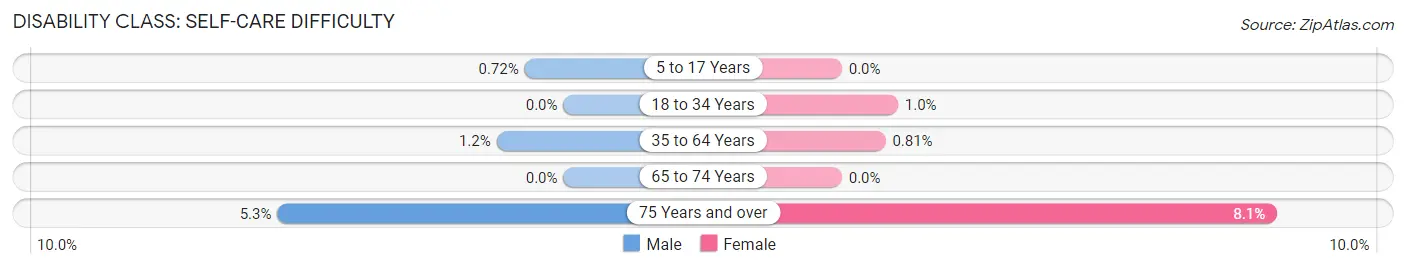
| Age Bracket | Male | Female |
| 5 to 17 Years | 7 (0.7%) | 0 (0.0%) |
| 18 to 34 Years | 0 (0.0%) | 17 (1.0%) |
| 35 to 64 Years | 25 (1.2%) | 20 (0.8%) |
| 65 to 74 Years | 0 (0.0%) | 0 (0.0%) |
| 75 Years and over | 27 (5.3%) | 62 (8.1%) |
Technology Access in Florham Park borough
Computing Device Access in Florham Park borough
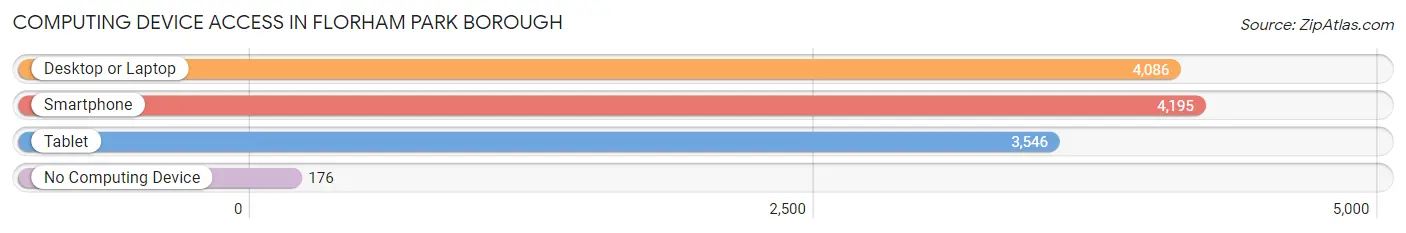
| Device Type | # Households | % Households |
| Desktop or Laptop | 4,086 | 90.2% |
| Smartphone | 4,195 | 92.6% |
| Tablet | 3,546 | 78.3% |
| No Computing Device | 176 | 3.9% |
| Total | 4,530 | 100.0% |
Internet Access in Florham Park borough
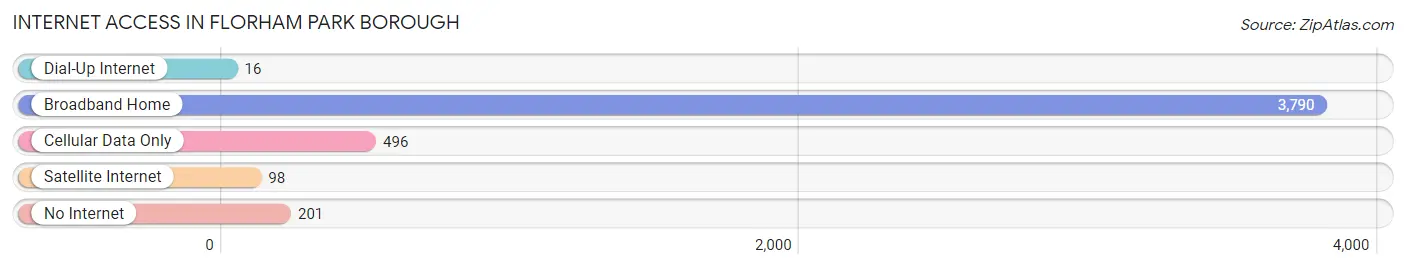
| Internet Type | # Households | % Households |
| Dial-Up Internet | 16 | 0.4% |
| Broadband Home | 3,790 | 83.7% |
| Cellular Data Only | 496 | 11.0% |
| Satellite Internet | 98 | 2.2% |
| No Internet | 201 | 4.4% |
| Total | 4,530 | 100.0% |
Florham Park borough Summary
Introduction
The Borough of Florham Park is located in Morris County, New Jersey. It is a small suburban community with a population of 12,659 as of the 2010 census. The borough is situated in the heart of the New York metropolitan area and is just a short drive from New York City. The borough is known for its excellent schools, parks, and recreational facilities. It is also home to several corporate headquarters, including BASF, Honeywell, and Wyndham Worldwide.
History
The area that is now Florham Park was originally inhabited by the Lenni Lenape Native Americans. The first European settlers arrived in the area in the late 17th century. The area was part of Hanover Township until 1899, when it was incorporated as the Borough of Florham Park. The name of the borough is derived from the names of two prominent local families, the Florhams and the Parkers.
The borough was primarily a rural farming community until the 1950s, when it began to experience rapid growth due to its proximity to New York City. The population of the borough increased from 2,000 in 1950 to 12,659 in 2010.
Geography
Florham Park is located in the northern part of Morris County, New Jersey. It is bordered by Hanover Township to the north, Madison to the east, Chatham Borough to the south, and East Hanover Township to the west. The borough covers an area of 4.2 square miles and has a population density of 3,037 people per square mile.
The borough is located in the Piedmont region of New Jersey, which is characterized by rolling hills and valleys. The borough is located on the western edge of the Great Swamp National Wildlife Refuge, which is a popular destination for bird watching and other outdoor activities.
Economy
Florham Park is home to several corporate headquarters, including BASF, Honeywell, and Wyndham Worldwide. The borough is also home to several small businesses, including restaurants, retail stores, and professional services.
The median household income in Florham Park is $118,890, which is significantly higher than the national median of $60,336. The median home value in the borough is $541,400, which is also significantly higher than the national median of $184,700.
Demographics
As of the 2010 census, the population of Florham Park was 12,659. The racial makeup of the borough was 87.3% White, 4.2% Asian, 3.7% Hispanic or Latino, 2.2% African American, and 2.6% other.
The median age in Florham Park is 43.3 years, which is slightly higher than the national median of 37.8 years. The median household income in the borough is $118,890, which is significantly higher than the national median of $60,336.
Conclusion
The Borough of Florham Park is a small suburban community located in Morris County, New Jersey. It is situated in the heart of the New York metropolitan area and is just a short drive from New York City. The borough is known for its excellent schools, parks, and recreational facilities. It is also home to several corporate headquarters, including BASF, Honeywell, and Wyndham Worldwide. The population of the borough is 12,659 as of the 2010 census, and the median household income is $118,890. Florham Park is a great place to live, work, and raise a family.
Common Questions
What is Per Capita Income in Florham Park borough?
Per Capita income in Florham Park borough is $66,939.
What is the Median Family Income in Florham Park borough?
Median Family Income in Florham Park borough is $179,750.
What is the Median Household income in Florham Park borough?
Median Household Income in Florham Park borough is $141,620.
What is Income or Wage Gap in Florham Park borough?
Income or Wage Gap in Florham Park borough is 30.2%.
Women in Florham Park borough earn 69.8 cents for every dollar earned by a man.
What is Inequality or Gini Index in Florham Park borough?
Inequality or Gini Index in Florham Park borough is 0.45.
What is the Total Population of Florham Park borough?
Total Population of Florham Park borough is 12,790.
What is the Total Male Population of Florham Park borough?
Total Male Population of Florham Park borough is 6,269.
What is the Total Female Population of Florham Park borough?
Total Female Population of Florham Park borough is 6,521.
What is the Ratio of Males per 100 Females in Florham Park borough?
There are 96.14 Males per 100 Females in Florham Park borough.
What is the Ratio of Females per 100 Males in Florham Park borough?
There are 104.02 Females per 100 Males in Florham Park borough.
What is the Median Population Age in Florham Park borough?
Median Population Age in Florham Park borough is 41.7 Years.
What is the Average Family Size in Florham Park borough
Average Family Size in Florham Park borough is 3.1 People.
What is the Average Household Size in Florham Park borough
Average Household Size in Florham Park borough is 2.4 People.
How Large is the Labor Force in Florham Park borough?
There are 7,013 People in the Labor Forcein in Florham Park borough.
What is the Percentage of People in the Labor Force in Florham Park borough?
62.7% of People are in the Labor Force in Florham Park borough.
What is the Unemployment Rate in Florham Park borough?
Unemployment Rate in Florham Park borough is 3.4%.