Cities with the Highest Percentage of Immigrants from Northern Europe in New Jersey
RELATED REPORTS & OPTIONS
Northern Europe
New Jersey
Compare Cities
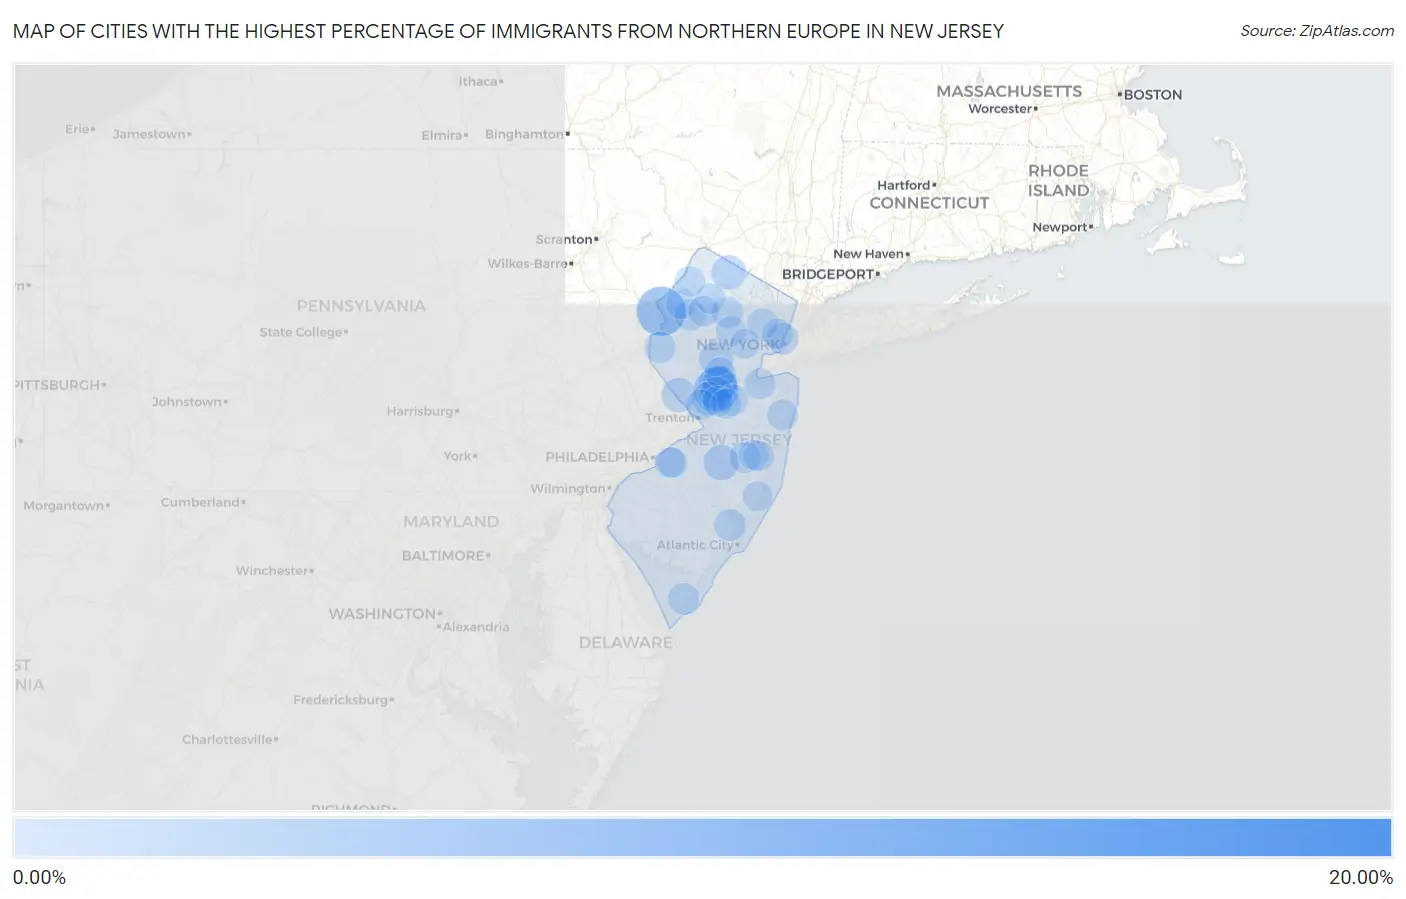
Map of Cities with the Highest Percentage of Immigrants from Northern Europe in New Jersey
0.00%
20.00%
Cities with the Highest Percentage of Immigrants from Northern Europe in New Jersey
| City | Northern Europe | vs State | vs National | |
| 1. | Gandys Beach | 20.00% | 0.41%(+19.6)#1 | 0.29%(+19.7)#9 |
| 2. | Hewitt | 11.14% | 0.41%(+10.7)#2 | 0.29%(+10.9)#25 |
| 3. | Columbia | 7.66% | 0.41%(+7.25)#3 | 0.29%(+7.37)#44 |
| 4. | Mendham Borough | 7.29% | 0.41%(+6.88)#4 | 0.29%(+7.00)#48 |
| 5. | East Rocky Hill | 6.08% | 0.41%(+5.67)#5 | 0.29%(+5.80)#67 |
| 6. | Stirling | 5.13% | 0.41%(+4.72)#6 | 0.29%(+4.85)#88 |
| 7. | Green | 4.51% | 0.41%(+4.10)#7 | 0.29%(+4.22)#120 |
| 8. | Griggstown | 3.72% | 0.41%(+3.31)#8 | 0.29%(+3.44)#186 |
| 9. | Macopin | 3.43% | 0.41%(+3.02)#9 | 0.29%(+3.14)#220 |
| 10. | Teterboro Borough | 3.30% | 0.41%(+2.89)#10 | 0.29%(+3.01)#231 |
| 11. | Edgewater Borough | 3.03% | 0.41%(+2.62)#11 | 0.29%(+2.74)#275 |
| 12. | Pleasant Plains | 2.86% | 0.41%(+2.45)#12 | 0.29%(+2.57)#298 |
| 13. | Presidential Lakes Estates | 2.85% | 0.41%(+2.44)#13 | 0.29%(+2.56)#301 |
| 14. | Pines Lake | 2.83% | 0.41%(+2.43)#14 | 0.29%(+2.55)#303 |
| 15. | Highland Park Borough | 2.79% | 0.41%(+2.38)#15 | 0.29%(+2.50)#321 |
| 16. | Port Elizabeth | 2.74% | 0.41%(+2.33)#16 | 0.29%(+2.45)#334 |
| 17. | Oradell Borough | 2.66% | 0.41%(+2.25)#17 | 0.29%(+2.37)#350 |
| 18. | Rockleigh Borough | 2.65% | 0.41%(+2.24)#18 | 0.29%(+2.36)#354 |
| 19. | Pleasantdale | 2.60% | 0.41%(+2.19)#19 | 0.29%(+2.31)#365 |
| 20. | Vernon Center | 2.48% | 0.41%(+2.07)#20 | 0.29%(+2.19)#392 |
| 21. | Lambertville | 2.47% | 0.41%(+2.06)#21 | 0.29%(+2.19)#393 |
| 22. | Green Knoll | 2.46% | 0.41%(+2.05)#22 | 0.29%(+2.17)#398 |
| 23. | Lyons | 2.45% | 0.41%(+2.04)#23 | 0.29%(+2.17)#401 |
| 24. | Princeton | 2.31% | 0.41%(+1.90)#24 | 0.29%(+2.02)#429 |
| 25. | Elmer Borough | 2.13% | 0.41%(+1.72)#25 | 0.29%(+1.84)#477 |
| 26. | Kingston | 2.09% | 0.41%(+1.69)#26 | 0.29%(+1.81)#496 |
| 27. | Little Silver Borough | 2.03% | 0.41%(+1.62)#27 | 0.29%(+1.75)#524 |
| 28. | Rainbow Lakes | 2.02% | 0.41%(+1.61)#28 | 0.29%(+1.74)#527 |
| 29. | Three Bridges | 1.93% | 0.41%(+1.52)#29 | 0.29%(+1.65)#569 |
| 30. | Cresskill Borough | 1.88% | 0.41%(+1.47)#30 | 0.29%(+1.59)#590 |
| 31. | Point Pleasant Beach Borough | 1.84% | 0.41%(+1.43)#31 | 0.29%(+1.55)#610 |
| 32. | Saddle River Borough | 1.81% | 0.41%(+1.41)#32 | 0.29%(+1.53)#620 |
| 33. | Flanders | 1.81% | 0.41%(+1.40)#33 | 0.29%(+1.53)#622 |
| 34. | Bedminster | 1.80% | 0.41%(+1.40)#34 | 0.29%(+1.52)#627 |
| 35. | Union Beach Borough | 1.77% | 0.41%(+1.37)#35 | 0.29%(+1.49)#641 |
| 36. | Waldwick Borough | 1.68% | 0.41%(+1.27)#36 | 0.29%(+1.39)#697 |
| 37. | Brookside | 1.61% | 0.41%(+1.20)#37 | 0.29%(+1.33)#739 |
| 38. | Atlantic Highlands Borough | 1.61% | 0.41%(+1.20)#38 | 0.29%(+1.32)#741 |
| 39. | Ledgewood | 1.60% | 0.41%(+1.20)#39 | 0.29%(+1.32)#746 |
| 40. | Mckee | 1.56% | 0.41%(+1.15)#40 | 0.29%(+1.27)#777 |
| 41. | Smithville | 1.54% | 0.41%(+1.13)#41 | 0.29%(+1.26)#787 |
| 42. | Hoboken | 1.53% | 0.41%(+1.12)#42 | 0.29%(+1.25)#798 |
| 43. | Milford Borough | 1.53% | 0.41%(+1.12)#43 | 0.29%(+1.24)#802 |
| 44. | Morris Plains Borough | 1.49% | 0.41%(+1.08)#44 | 0.29%(+1.21)#832 |
| 45. | Basking Ridge | 1.48% | 0.41%(+1.07)#45 | 0.29%(+1.19)#839 |
| 46. | White Meadow Lake | 1.47% | 0.41%(+1.07)#46 | 0.29%(+1.19)#845 |
| 47. | Stanhope Borough | 1.47% | 0.41%(+1.06)#47 | 0.29%(+1.19)#849 |
| 48. | Erma | 1.46% | 0.41%(+1.06)#48 | 0.29%(+1.18)#858 |
| 49. | Stewartsville | 1.46% | 0.41%(+1.05)#49 | 0.29%(+1.18)#862 |
| 50. | Bridgewater Center | 1.41% | 0.41%(+1.000)#50 | 0.29%(+1.12)#900 |
| 51. | Demarest Borough | 1.40% | 0.41%(+0.991)#51 | 0.29%(+1.11)#910 |
| 52. | Panther Valley | 1.36% | 0.41%(+0.951)#52 | 0.29%(+1.07)#945 |
| 53. | Crestwood Village | 1.34% | 0.41%(+0.936)#53 | 0.29%(+1.06)#962 |
| 54. | Rossmoor | 1.33% | 0.41%(+0.926)#54 | 0.29%(+1.05)#972 |
| 55. | Cliffwood Beach | 1.33% | 0.41%(+0.921)#55 | 0.29%(+1.04)#978 |
| 56. | Cologne | 1.33% | 0.41%(+0.920)#56 | 0.29%(+1.04)#980 |
| 57. | Upper Montclair | 1.30% | 0.41%(+0.894)#57 | 0.29%(+1.02)#1,007 |
| 58. | Franklin Lakes Borough | 1.28% | 0.41%(+0.872)#58 | 0.29%(+0.996)#1,031 |
| 59. | Englewood Cliffs Borough | 1.23% | 0.41%(+0.826)#59 | 0.29%(+0.949)#1,089 |
| 60. | Hasbrouck Heights Borough | 1.23% | 0.41%(+0.817)#60 | 0.29%(+0.940)#1,103 |
| 61. | Secaucus | 1.22% | 0.41%(+0.816)#61 | 0.29%(+0.940)#1,104 |
| 62. | Weston | 1.21% | 0.41%(+0.804)#62 | 0.29%(+0.927)#1,116 |
| 63. | Marksboro | 1.21% | 0.41%(+0.804)#63 | 0.29%(+0.927)#1,118 |
| 64. | Lawrenceville | 1.20% | 0.41%(+0.789)#64 | 0.29%(+0.912)#1,136 |
| 65. | Wanamassa | 1.17% | 0.41%(+0.766)#65 | 0.29%(+0.889)#1,175 |
| 66. | Byram Center | 1.17% | 0.41%(+0.760)#66 | 0.29%(+0.883)#1,181 |
| 67. | Red Bank Borough | 1.17% | 0.41%(+0.757)#67 | 0.29%(+0.880)#1,184 |
| 68. | Leonia Borough | 1.16% | 0.41%(+0.756)#68 | 0.29%(+0.879)#1,187 |
| 69. | Mount Hope | 1.16% | 0.41%(+0.756)#69 | 0.29%(+0.879)#1,188 |
| 70. | Neshanic Station | 1.15% | 0.41%(+0.739)#70 | 0.29%(+0.862)#1,212 |
| 71. | Morristown | 1.14% | 0.41%(+0.734)#71 | 0.29%(+0.857)#1,219 |
| 72. | Essex Fells Borough | 1.14% | 0.41%(+0.727)#72 | 0.29%(+0.850)#1,228 |
| 73. | Plainsboro Center | 1.12% | 0.41%(+0.712)#73 | 0.29%(+0.835)#1,251 |
| 74. | Rutherford Borough | 1.12% | 0.41%(+0.711)#74 | 0.29%(+0.834)#1,255 |
| 75. | Holiday City Berkeley | 1.11% | 0.41%(+0.699)#75 | 0.29%(+0.822)#1,272 |
| 76. | Lincoln Park Borough | 1.07% | 0.41%(+0.657)#76 | 0.29%(+0.780)#1,347 |
| 77. | Washington Borough | 1.06% | 0.41%(+0.655)#77 | 0.29%(+0.778)#1,350 |
| 78. | Monmouth Beach Borough | 1.06% | 0.41%(+0.654)#78 | 0.29%(+0.777)#1,353 |
| 79. | Wanaque Borough | 1.05% | 0.41%(+0.643)#79 | 0.29%(+0.767)#1,369 |
| 80. | Flagtown | 1.05% | 0.41%(+0.638)#80 | 0.29%(+0.761)#1,380 |
| 81. | Silver Ridge | 1.03% | 0.41%(+0.626)#81 | 0.29%(+0.749)#1,402 |
| 82. | Lake Mohawk | 1.03% | 0.41%(+0.622)#82 | 0.29%(+0.745)#1,409 |
| 83. | Madison Borough | 1.03% | 0.41%(+0.620)#83 | 0.29%(+0.744)#1,418 |
| 84. | Haddon Heights Borough | 1.03% | 0.41%(+0.620)#84 | 0.29%(+0.743)#1,419 |
| 85. | Ellisburg | 1.02% | 0.41%(+0.614)#85 | 0.29%(+0.737)#1,433 |
| 86. | Kingston Estates | 1.01% | 0.41%(+0.606)#86 | 0.29%(+0.729)#1,446 |
| 87. | Chester Borough | 1.01% | 0.41%(+0.605)#87 | 0.29%(+0.728)#1,449 |
| 88. | Ship Bottom Borough | 1.01% | 0.41%(+0.597)#88 | 0.29%(+0.720)#1,462 |
| 89. | Neptune City Borough | 1.00% | 0.41%(+0.587)#89 | 0.29%(+0.710)#1,483 |
| 90. | Bernardsville Borough | 0.99% | 0.41%(+0.580)#90 | 0.29%(+0.703)#1,497 |
| 91. | Summit | 0.99% | 0.41%(+0.580)#91 | 0.29%(+0.703)#1,498 |
| 92. | Mountainside Borough | 0.99% | 0.41%(+0.578)#92 | 0.29%(+0.702)#1,500 |
| 93. | Allenhurst Borough | 0.97% | 0.41%(+0.562)#93 | 0.29%(+0.685)#1,530 |
| 94. | Crandon Lakes | 0.96% | 0.41%(+0.556)#94 | 0.29%(+0.679)#1,541 |
| 95. | Oakland Borough | 0.96% | 0.41%(+0.550)#95 | 0.29%(+0.673)#1,561 |
| 96. | Haworth Borough | 0.96% | 0.41%(+0.549)#96 | 0.29%(+0.672)#1,562 |
| 97. | Manahawkin | 0.96% | 0.41%(+0.547)#97 | 0.29%(+0.670)#1,569 |
| 98. | Watchung Borough | 0.95% | 0.41%(+0.542)#98 | 0.29%(+0.665)#1,584 |
| 99. | West Long Branch Borough | 0.95% | 0.41%(+0.539)#99 | 0.29%(+0.662)#1,591 |
| 100. | Cranbury | 0.95% | 0.41%(+0.538)#100 | 0.29%(+0.661)#1,593 |
Common Questions
What are the Top 10 Cities with the Highest Percentage of Immigrants from Northern Europe in New Jersey?
Top 10 Cities with the Highest Percentage of Immigrants from Northern Europe in New Jersey are:
#1
7.66%
#2
6.08%
#3
3.72%
#4
2.86%
#5
2.85%
#6
2.48%
#7
2.47%
#8
2.46%
#9
2.31%
#10
2.09%
What city has the Highest Percentage of Immigrants from Northern Europe in New Jersey?
Columbia has the Highest Percentage of Immigrants from Northern Europe in New Jersey with 7.66%.
What is the Percentage of Immigrants from Northern Europe in the State of New Jersey?
Percentage of Immigrants from Northern Europe in New Jersey is 0.41%.
What is the Percentage of Immigrants from Northern Europe in the United States?
Percentage of Immigrants from Northern Europe in the United States is 0.29%.