Cities with the Most Immigrants from Bangladesh in New Jersey
RELATED REPORTS & OPTIONS
Bangladesh
New Jersey
Compare Cities
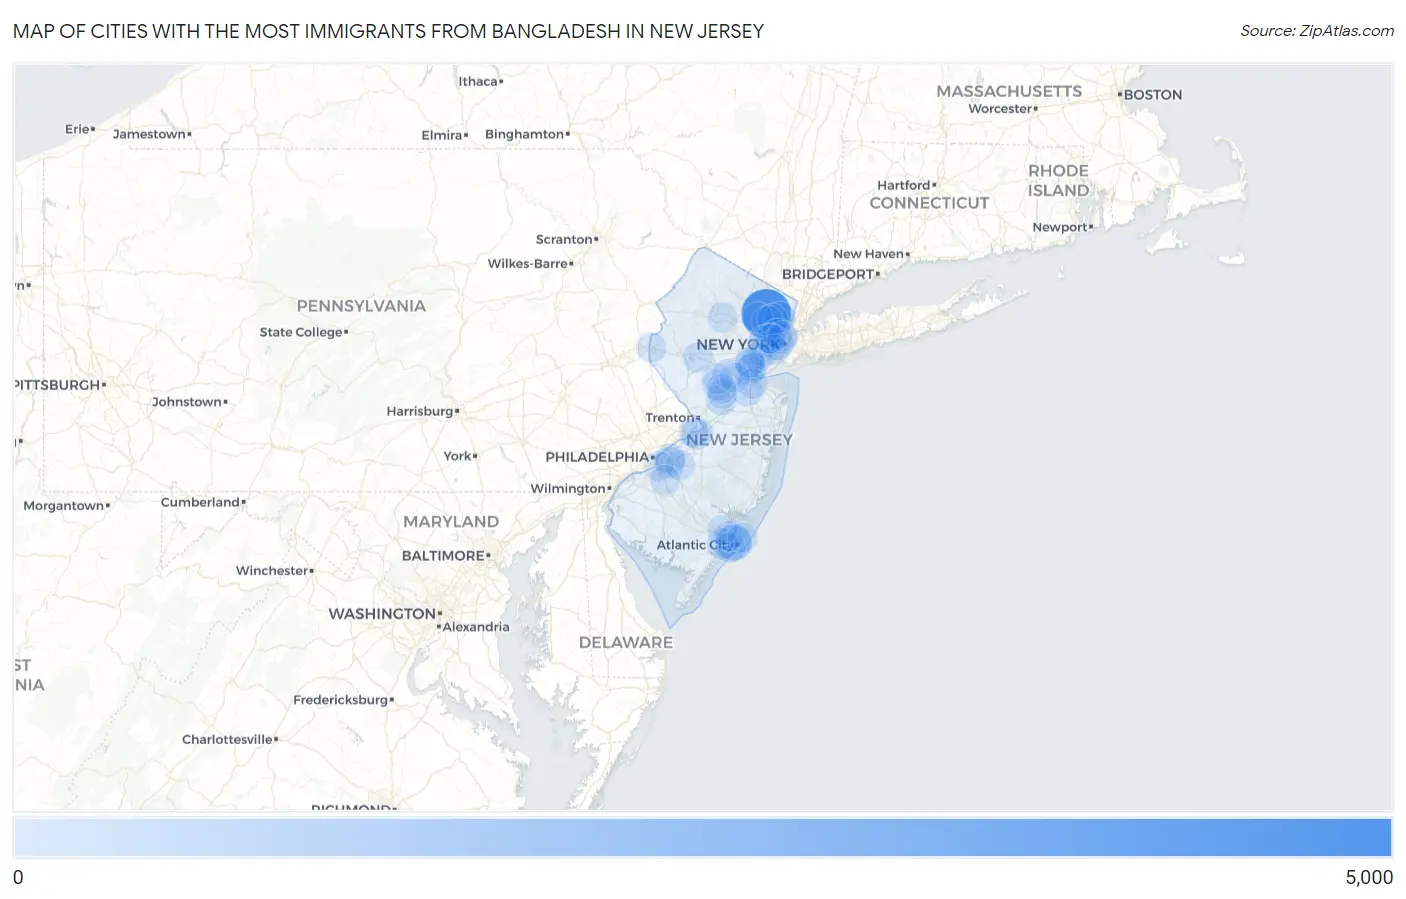
Map of Cities with the Most Immigrants from Bangladesh in New Jersey
0
5,000
Cities with the Most Immigrants from Bangladesh in New Jersey
| City | Bangladesh | vs State | vs National | |
| 1. | Paterson | 4,238 | 14,405(29.42%)#1 | 271,479(1.56%)#7 |
| 2. | Atlantic City | 1,264 | 14,405(8.77%)#2 | 271,479(0.47%)#11 |
| 3. | Newark | 529 | 14,405(3.67%)#3 | 271,479(0.19%)#38 |
| 4. | Jersey City | 470 | 14,405(3.26%)#4 | 271,479(0.17%)#49 |
| 5. | Roebling | 315 | 14,405(2.19%)#5 | 271,479(0.12%)#83 |
| 6. | Ampere North | 239 | 14,405(1.66%)#6 | 271,479(0.09%)#116 |
| 7. | Northfield | 220 | 14,405(1.53%)#7 | 271,479(0.08%)#130 |
| 8. | Hackensack | 217 | 14,405(1.51%)#8 | 271,479(0.08%)#131 |
| 9. | Clifton | 214 | 14,405(1.49%)#9 | 271,479(0.08%)#136 |
| 10. | Sayreville Borough | 182 | 14,405(1.26%)#10 | 271,479(0.07%)#168 |
| 11. | Bogota Borough | 161 | 14,405(1.12%)#11 | 271,479(0.06%)#196 |
| 12. | Ellisburg | 147 | 14,405(1.02%)#12 | 271,479(0.05%)#216 |
| 13. | Elizabeth | 142 | 14,405(0.99%)#13 | 271,479(0.05%)#221 |
| 14. | Princeton Meadows | 138 | 14,405(0.96%)#14 | 271,479(0.05%)#225 |
| 15. | Fords | 113 | 14,405(0.78%)#15 | 271,479(0.04%)#275 |
| 16. | Linden | 106 | 14,405(0.74%)#16 | 271,479(0.04%)#296 |
| 17. | Cherry Hill Mall | 100 | 14,405(0.69%)#17 | 271,479(0.04%)#315 |
| 18. | Pine Hill Borough | 99 | 14,405(0.69%)#18 | 271,479(0.04%)#319 |
| 19. | Fairview Borough | 89 | 14,405(0.62%)#19 | 271,479(0.03%)#354 |
| 20. | Eatontown Borough | 86 | 14,405(0.60%)#20 | 271,479(0.03%)#365 |
| 21. | Hoboken | 84 | 14,405(0.58%)#21 | 271,479(0.03%)#372 |
| 22. | Wharton Borough | 84 | 14,405(0.58%)#22 | 271,479(0.03%)#377 |
| 23. | Highland Park Borough | 83 | 14,405(0.58%)#23 | 271,479(0.03%)#381 |
| 24. | Griggstown | 81 | 14,405(0.56%)#24 | 271,479(0.03%)#394 |
| 25. | Ventnor City | 71 | 14,405(0.49%)#25 | 271,479(0.03%)#436 |
| 26. | South Plainfield Borough | 67 | 14,405(0.47%)#26 | 271,479(0.02%)#456 |
| 27. | Old Bridge | 66 | 14,405(0.46%)#27 | 271,479(0.02%)#460 |
| 28. | Prospect Park Borough | 66 | 14,405(0.46%)#28 | 271,479(0.02%)#463 |
| 29. | Forsgate | 65 | 14,405(0.45%)#29 | 271,479(0.02%)#467 |
| 30. | White House Station | 64 | 14,405(0.44%)#30 | 271,479(0.02%)#469 |
| 31. | Preakness | 63 | 14,405(0.44%)#31 | 271,479(0.02%)#473 |
| 32. | Fair Lawn Borough | 59 | 14,405(0.41%)#32 | 271,479(0.02%)#502 |
| 33. | New Milford Borough | 58 | 14,405(0.40%)#33 | 271,479(0.02%)#513 |
| 34. | Iselin | 57 | 14,405(0.40%)#34 | 271,479(0.02%)#521 |
| 35. | Spotswood Borough | 57 | 14,405(0.40%)#35 | 271,479(0.02%)#523 |
| 36. | Florence | 57 | 14,405(0.40%)#36 | 271,479(0.02%)#525 |
| 37. | Phillipsburg | 49 | 14,405(0.34%)#37 | 271,479(0.02%)#589 |
| 38. | Runnemede Borough | 49 | 14,405(0.34%)#38 | 271,479(0.02%)#591 |
| 39. | Metuchen Borough | 47 | 14,405(0.33%)#39 | 271,479(0.02%)#603 |
| 40. | Roselle Park Borough | 46 | 14,405(0.32%)#40 | 271,479(0.02%)#619 |
| 41. | Singac | 46 | 14,405(0.32%)#41 | 271,479(0.02%)#621 |
| 42. | Bayonne | 40 | 14,405(0.28%)#42 | 271,479(0.01%)#659 |
| 43. | Monmouth Junction | 40 | 14,405(0.28%)#43 | 271,479(0.01%)#669 |
| 44. | Somerset | 39 | 14,405(0.27%)#44 | 271,479(0.01%)#674 |
| 45. | Madison Park | 38 | 14,405(0.26%)#45 | 271,479(0.01%)#687 |
| 46. | Lindenwold Borough | 35 | 14,405(0.24%)#46 | 271,479(0.01%)#723 |
| 47. | Woodbridge | 32 | 14,405(0.22%)#47 | 271,479(0.01%)#762 |
| 48. | Matawan Borough | 32 | 14,405(0.22%)#48 | 271,479(0.01%)#764 |
| 49. | Haledon Borough | 32 | 14,405(0.22%)#49 | 271,479(0.01%)#765 |
| 50. | Garfield | 28 | 14,405(0.19%)#50 | 271,479(0.01%)#805 |
| 51. | Dover | 28 | 14,405(0.19%)#51 | 271,479(0.01%)#810 |
| 52. | Edgewater Borough | 27 | 14,405(0.19%)#52 | 271,479(0.01%)#819 |
| 53. | Colonia | 26 | 14,405(0.18%)#53 | 271,479(0.01%)#833 |
| 54. | Gloucester City | 26 | 14,405(0.18%)#54 | 271,479(0.01%)#838 |
| 55. | Marlton | 26 | 14,405(0.18%)#55 | 271,479(0.01%)#840 |
| 56. | Manville Borough | 25 | 14,405(0.17%)#56 | 271,479(0.01%)#855 |
| 57. | Merchantville Borough | 25 | 14,405(0.17%)#57 | 271,479(0.01%)#857 |
| 58. | Monroe Manor | 25 | 14,405(0.17%)#58 | 271,479(0.01%)#859 |
| 59. | Paramus Borough | 24 | 14,405(0.17%)#59 | 271,479(0.01%)#870 |
| 60. | Lodi Borough | 24 | 14,405(0.17%)#60 | 271,479(0.01%)#871 |
| 61. | Absecon | 24 | 14,405(0.17%)#61 | 271,479(0.01%)#877 |
| 62. | Seaville | 24 | 14,405(0.17%)#62 | 271,479(0.01%)#881 |
| 63. | Brooklawn Borough | 24 | 14,405(0.17%)#63 | 271,479(0.01%)#882 |
| 64. | Glassboro Borough | 23 | 14,405(0.16%)#64 | 271,479(0.01%)#892 |
| 65. | Hi Nella Borough | 23 | 14,405(0.16%)#65 | 271,479(0.01%)#896 |
| 66. | Deans | 22 | 14,405(0.15%)#66 | 271,479(0.01%)#911 |
| 67. | Tenafly Borough | 21 | 14,405(0.15%)#67 | 271,479(0.01%)#923 |
| 68. | Secaucus | 19 | 14,405(0.13%)#68 | 271,479(0.01%)#960 |
| 69. | Blackwells Mills | 19 | 14,405(0.13%)#69 | 271,479(0.01%)#965 |
| 70. | Elmwood Park Borough | 18 | 14,405(0.12%)#70 | 271,479(0.01%)#989 |
| 71. | Oradell Borough | 18 | 14,405(0.12%)#71 | 271,479(0.01%)#994 |
| 72. | Pomona | 17 | 14,405(0.12%)#72 | 271,479(0.01%)#1,015 |
| 73. | Kendall Park | 16 | 14,405(0.11%)#73 | 271,479(0.01%)#1,037 |
| 74. | Waldwick Borough | 16 | 14,405(0.11%)#74 | 271,479(0.01%)#1,039 |
| 75. | Blackwood | 16 | 14,405(0.11%)#75 | 271,479(0.01%)#1,041 |
| 76. | Grenloch | 15 | 14,405(0.10%)#76 | 271,479(0.01%)#1,072 |
| 77. | Union City | 12 | 14,405(0.08%)#77 | 271,479(0.00%)#1,129 |
| 78. | Wanaque Borough | 12 | 14,405(0.08%)#78 | 271,479(0.00%)#1,139 |
| 79. | South Bound Brook Borough | 12 | 14,405(0.08%)#79 | 271,479(0.00%)#1,151 |
| 80. | Harrison | 11 | 14,405(0.08%)#80 | 271,479(0.00%)#1,165 |
| 81. | New Brunswick | 10 | 14,405(0.07%)#81 | 271,479(0.00%)#1,179 |
| 82. | Hillsborough | 10 | 14,405(0.07%)#82 | 271,479(0.00%)#1,192 |
| 83. | Freehold Borough | 10 | 14,405(0.07%)#83 | 271,479(0.00%)#1,195 |
| 84. | The College Of New Jersey | 10 | 14,405(0.07%)#84 | 271,479(0.00%)#1,198 |
| 85. | Dumont Borough | 9 | 14,405(0.06%)#85 | 271,479(0.00%)#1,213 |
| 86. | Kearny | 8 | 14,405(0.06%)#86 | 271,479(0.00%)#1,230 |
| 87. | Carteret Borough | 8 | 14,405(0.06%)#87 | 271,479(0.00%)#1,234 |
| 88. | Brigantine | 7 | 14,405(0.05%)#88 | 271,479(0.00%)#1,259 |
| 89. | Somerdale Borough | 7 | 14,405(0.05%)#89 | 271,479(0.00%)#1,261 |
| 90. | Haddonfield Borough | 4 | 14,405(0.03%)#90 | 271,479(0.00%)#1,327 |
| 91. | Lebanon Borough | 4 | 14,405(0.03%)#91 | 271,479(0.00%)#1,332 |
Common Questions
What are the Top 10 Cities with the Most Immigrants from Bangladesh in New Jersey?
Top 10 Cities with the Most Immigrants from Bangladesh in New Jersey are:
#1
4,238
#2
1,264
#3
529
#4
470
#5
315
#6
220
#7
217
#8
214
#9
147
#10
142
What city has the Most Immigrants from Bangladesh in New Jersey?
Paterson has the Most Immigrants from Bangladesh in New Jersey with 4,238.
What is the Total Immigrants from Bangladesh in the State of New Jersey?
Total Immigrants from Bangladesh in New Jersey is 14,405.
What is the Total Immigrants from Bangladesh in the United States?
Total Immigrants from Bangladesh in the United States is 271,479.