Cities with the Highest Percentage of Immigrants from Korea in New Jersey
RELATED REPORTS & OPTIONS
Korea
New Jersey
Compare Cities
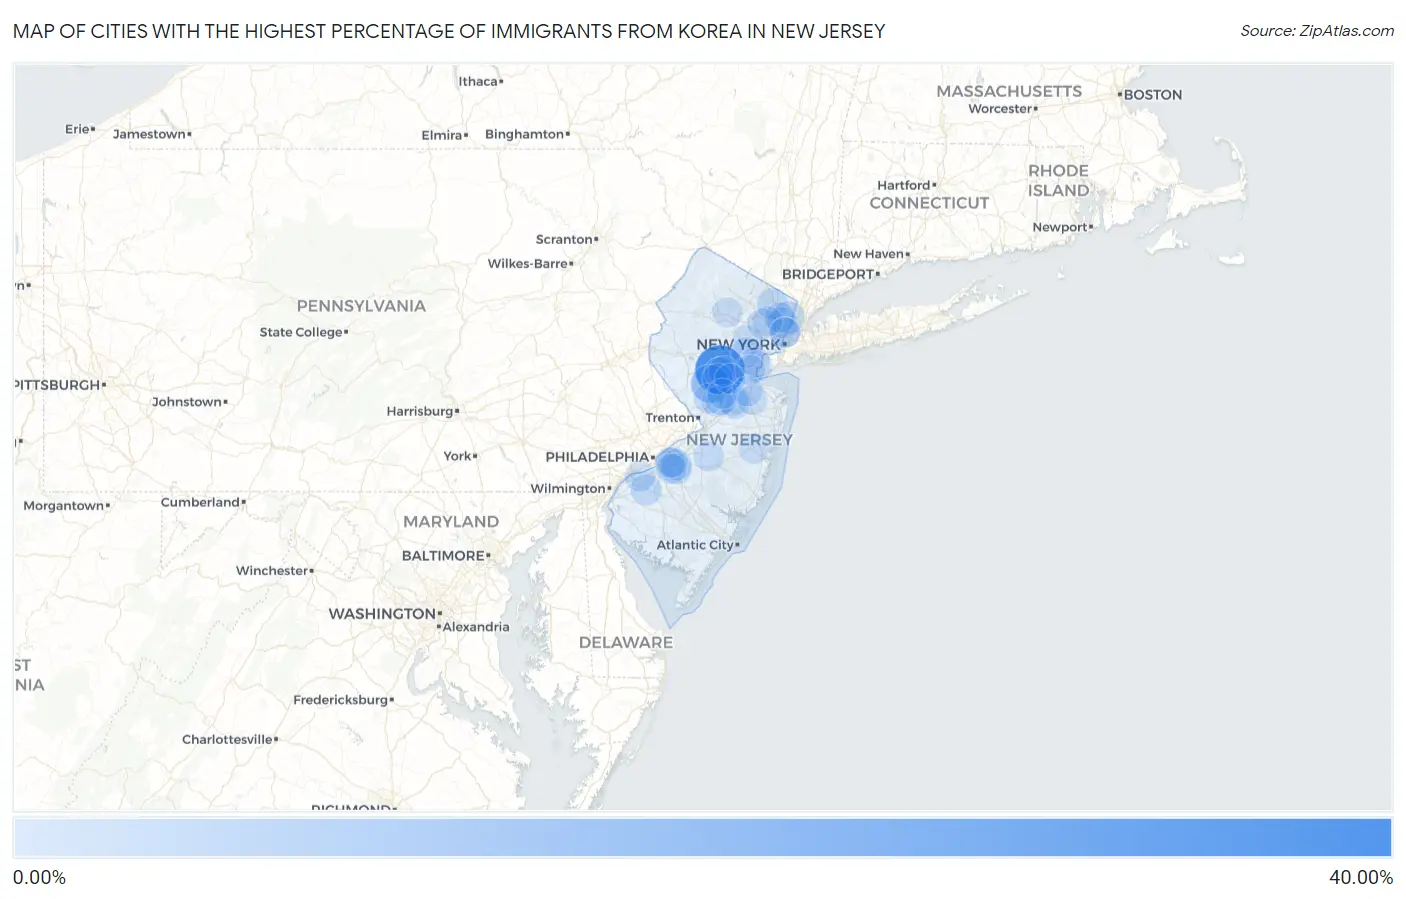
Map of Cities with the Highest Percentage of Immigrants from Korea in New Jersey
0.00%
40.00%
Cities with the Highest Percentage of Immigrants from Korea in New Jersey
| City | Korea | vs State | vs National | |
| 1. | Palisades Park Borough | 39.39% | 0.76%(+38.6)#1 | 0.31%(+39.1)#2 |
| 2. | Zarephath | 39.19% | 0.76%(+38.4)#2 | 0.31%(+38.9)#3 |
| 3. | Norwood Borough | 20.56% | 0.76%(+19.8)#3 | 0.31%(+20.2)#7 |
| 4. | Ridgefield Borough | 19.20% | 0.76%(+18.4)#4 | 0.31%(+18.9)#9 |
| 5. | Old Tappan Borough | 18.97% | 0.76%(+18.2)#5 | 0.31%(+18.7)#10 |
| 6. | Leonia Borough | 18.52% | 0.76%(+17.8)#6 | 0.31%(+18.2)#12 |
| 7. | Northvale Borough | 16.69% | 0.76%(+15.9)#7 | 0.31%(+16.4)#14 |
| 8. | Fort Lee Borough | 16.50% | 0.76%(+15.7)#8 | 0.31%(+16.2)#15 |
| 9. | Harlingen | 15.85% | 0.76%(+15.1)#9 | 0.31%(+15.5)#17 |
| 10. | Cresskill Borough | 15.71% | 0.76%(+14.9)#10 | 0.31%(+15.4)#18 |
| 11. | Edgewater Borough | 13.99% | 0.76%(+13.2)#11 | 0.31%(+13.7)#21 |
| 12. | Alpine Borough | 13.87% | 0.76%(+13.1)#12 | 0.31%(+13.6)#22 |
| 13. | Closter Borough | 13.86% | 0.76%(+13.1)#13 | 0.31%(+13.6)#23 |
| 14. | Englewood Cliffs Borough | 13.02% | 0.76%(+12.3)#14 | 0.31%(+12.7)#25 |
| 15. | Tenafly Borough | 12.46% | 0.76%(+11.7)#15 | 0.31%(+12.2)#27 |
| 16. | Lakeside-Beebe Run | 9.09% | 0.76%(+8.33)#16 | 0.31%(+8.78)#37 |
| 17. | Demarest Borough | 8.78% | 0.76%(+8.02)#17 | 0.31%(+8.47)#39 |
| 18. | Harrington Park Borough | 7.83% | 0.76%(+7.07)#18 | 0.31%(+7.52)#48 |
| 19. | River Edge Borough | 6.89% | 0.76%(+6.13)#19 | 0.31%(+6.57)#58 |
| 20. | Little Ferry Borough | 6.81% | 0.76%(+6.05)#20 | 0.31%(+6.50)#59 |
| 21. | Haworth Borough | 6.49% | 0.76%(+5.73)#21 | 0.31%(+6.18)#65 |
| 22. | Mount Tabor | 6.27% | 0.76%(+5.51)#22 | 0.31%(+5.96)#72 |
| 23. | Wood Ridge Borough | 5.76% | 0.76%(+5.00)#23 | 0.31%(+5.45)#83 |
| 24. | Allendale Borough | 5.40% | 0.76%(+4.64)#24 | 0.31%(+5.09)#89 |
| 25. | Englewood | 4.89% | 0.76%(+4.12)#25 | 0.31%(+4.57)#101 |
| 26. | Rockleigh Borough | 4.59% | 0.76%(+3.82)#26 | 0.31%(+4.27)#111 |
| 27. | Paramus Borough | 4.05% | 0.76%(+3.29)#27 | 0.31%(+3.74)#123 |
| 28. | Upper Saddle River Borough | 3.72% | 0.76%(+2.95)#28 | 0.31%(+3.40)#138 |
| 29. | Robbinsville Center | 3.65% | 0.76%(+2.89)#29 | 0.31%(+3.34)#143 |
| 30. | Cliffside Park Borough | 3.44% | 0.76%(+2.68)#30 | 0.31%(+3.13)#151 |
| 31. | Ridgewood | 3.37% | 0.76%(+2.61)#31 | 0.31%(+3.06)#155 |
| 32. | Mauricetown | 3.31% | 0.76%(+2.55)#32 | 0.31%(+3.00)#162 |
| 33. | East Rutherford Borough | 3.10% | 0.76%(+2.34)#33 | 0.31%(+2.79)#178 |
| 34. | Glen Rock Borough | 3.08% | 0.76%(+2.32)#34 | 0.31%(+2.77)#179 |
| 35. | Mullica Hill | 2.83% | 0.76%(+2.07)#35 | 0.31%(+2.52)#204 |
| 36. | Maywood Borough | 2.82% | 0.76%(+2.06)#36 | 0.31%(+2.51)#207 |
| 37. | Plainsboro Center | 2.71% | 0.76%(+1.95)#37 | 0.31%(+2.40)#220 |
| 38. | Greentree | 2.63% | 0.76%(+1.87)#38 | 0.31%(+2.32)#233 |
| 39. | Montvale Borough | 2.60% | 0.76%(+1.84)#39 | 0.31%(+2.29)#242 |
| 40. | Springdale | 2.56% | 0.76%(+1.80)#40 | 0.31%(+2.25)#246 |
| 41. | Rossmoor | 2.49% | 0.76%(+1.73)#41 | 0.31%(+2.18)#257 |
| 42. | Rutgers University-Busch Campus | 2.31% | 0.76%(+1.55)#42 | 0.31%(+2.00)#286 |
| 43. | Dunellen Borough | 2.28% | 0.76%(+1.51)#43 | 0.31%(+1.96)#294 |
| 44. | Elmer Borough | 2.21% | 0.76%(+1.45)#44 | 0.31%(+1.90)#312 |
| 45. | Franklin Lakes Borough | 2.17% | 0.76%(+1.41)#45 | 0.31%(+1.86)#315 |
| 46. | Ridgefield Park | 2.08% | 0.76%(+1.32)#46 | 0.31%(+1.77)#333 |
| 47. | Watchung Borough | 2.07% | 0.76%(+1.31)#47 | 0.31%(+1.76)#335 |
| 48. | Concordia | 2.07% | 0.76%(+1.30)#48 | 0.31%(+1.75)#337 |
| 49. | Dumont Borough | 2.05% | 0.76%(+1.29)#49 | 0.31%(+1.74)#338 |
| 50. | Forsgate | 2.00% | 0.76%(+1.24)#50 | 0.31%(+1.69)#351 |
| 51. | Helmetta Borough | 1.95% | 0.76%(+1.19)#51 | 0.31%(+1.64)#361 |
| 52. | Gibbstown | 1.90% | 0.76%(+1.14)#52 | 0.31%(+1.59)#380 |
| 53. | Ocean View | 1.89% | 0.76%(+1.13)#53 | 0.31%(+1.58)#384 |
| 54. | Whippany | 1.79% | 0.76%(+1.03)#54 | 0.31%(+1.48)#412 |
| 55. | Weston | 1.77% | 0.76%(+1.01)#55 | 0.31%(+1.46)#418 |
| 56. | Emerson Borough | 1.77% | 0.76%(+1.01)#56 | 0.31%(+1.46)#419 |
| 57. | Princeton Meadows | 1.67% | 0.76%(+0.906)#57 | 0.31%(+1.36)#450 |
| 58. | Westwood Borough | 1.58% | 0.76%(+0.821)#58 | 0.31%(+1.27)#487 |
| 59. | William Paterson University Of New Jersey | 1.55% | 0.76%(+0.786)#59 | 0.31%(+1.24)#495 |
| 60. | Oradell Borough | 1.46% | 0.76%(+0.700)#60 | 0.31%(+1.15)#533 |
| 61. | Short Hills | 1.45% | 0.76%(+0.691)#61 | 0.31%(+1.14)#542 |
| 62. | Pemberton Heights | 1.44% | 0.76%(+0.679)#62 | 0.31%(+1.13)#548 |
| 63. | Rutherford Borough | 1.38% | 0.76%(+0.613)#63 | 0.31%(+1.06)#581 |
| 64. | Highland Park Borough | 1.35% | 0.76%(+0.591)#64 | 0.31%(+1.04)#590 |
| 65. | Fairview Borough | 1.35% | 0.76%(+0.590)#65 | 0.31%(+1.04)#592 |
| 66. | Oceanport Borough | 1.27% | 0.76%(+0.512)#66 | 0.31%(+0.962)#644 |
| 67. | Bergenfield Borough | 1.25% | 0.76%(+0.488)#67 | 0.31%(+0.938)#659 |
| 68. | Ramsey Borough | 1.23% | 0.76%(+0.472)#68 | 0.31%(+0.922)#667 |
| 69. | Bernardsville Borough | 1.19% | 0.76%(+0.429)#69 | 0.31%(+0.879)#688 |
| 70. | Ellisburg | 1.17% | 0.76%(+0.406)#70 | 0.31%(+0.856)#705 |
| 71. | Kingston Estates | 1.16% | 0.76%(+0.395)#71 | 0.31%(+0.845)#716 |
| 72. | Preakness | 1.14% | 0.76%(+0.378)#72 | 0.31%(+0.828)#734 |
| 73. | Port Reading | 1.11% | 0.76%(+0.351)#73 | 0.31%(+0.801)#751 |
| 74. | Westfield | 1.11% | 0.76%(+0.350)#74 | 0.31%(+0.800)#754 |
| 75. | The Hills | 1.10% | 0.76%(+0.335)#75 | 0.31%(+0.785)#764 |
| 76. | Sussex Borough | 1.09% | 0.76%(+0.333)#76 | 0.31%(+0.783)#766 |
| 77. | Upper Montclair | 1.04% | 0.76%(+0.283)#77 | 0.31%(+0.733)#819 |
| 78. | Franklin Center | 1.02% | 0.76%(+0.259)#78 | 0.31%(+0.709)#847 |
| 79. | Hackensack | 1.01% | 0.76%(+0.249)#79 | 0.31%(+0.699)#856 |
| 80. | West New York | 0.99% | 0.76%(+0.229)#80 | 0.31%(+0.679)#875 |
| 81. | Rutgers University-Livingston Campus | 0.97% | 0.76%(+0.210)#81 | 0.31%(+0.660)#901 |
| 82. | Leisure Village West | 0.97% | 0.76%(+0.207)#82 | 0.31%(+0.657)#902 |
| 83. | Princeton | 0.96% | 0.76%(+0.200)#83 | 0.31%(+0.650)#911 |
| 84. | Blackwells Mills | 0.95% | 0.76%(+0.183)#84 | 0.31%(+0.633)#935 |
| 85. | Guttenberg | 0.92% | 0.76%(+0.156)#85 | 0.31%(+0.606)#966 |
| 86. | Clifton | 0.92% | 0.76%(+0.154)#86 | 0.31%(+0.604)#969 |
| 87. | Avenel | 0.89% | 0.76%(+0.132)#87 | 0.31%(+0.582)#994 |
| 88. | Pine Brook | 0.89% | 0.76%(+0.132)#88 | 0.31%(+0.582)#995 |
| 89. | Voorhees | 0.89% | 0.76%(+0.128)#89 | 0.31%(+0.577)#1,001 |
| 90. | White Meadow Lake | 0.89% | 0.76%(+0.127)#90 | 0.31%(+0.577)#1,002 |
| 91. | Cedar Knolls | 0.88% | 0.76%(+0.123)#91 | 0.31%(+0.573)#1,008 |
| 92. | Fords | 0.88% | 0.76%(+0.122)#92 | 0.31%(+0.572)#1,009 |
| 93. | Stockton University | 0.88% | 0.76%(+0.120)#93 | 0.31%(+0.570)#1,013 |
| 94. | Ashland | 0.86% | 0.76%(+0.101)#94 | 0.31%(+0.551)#1,041 |
| 95. | Elmwood Park Borough | 0.85% | 0.76%(+0.084)#95 | 0.31%(+0.534)#1,056 |
| 96. | Monmouth Junction | 0.84% | 0.76%(+0.079)#96 | 0.31%(+0.529)#1,063 |
| 97. | Robertsville | 0.84% | 0.76%(+0.076)#97 | 0.31%(+0.526)#1,069 |
| 98. | Old Bridge | 0.84% | 0.76%(+0.074)#98 | 0.31%(+0.524)#1,074 |
| 99. | Port Morris | 0.84% | 0.76%(+0.074)#99 | 0.31%(+0.524)#1,077 |
| 100. | Tinton Falls Borough | 0.83% | 0.76%(+0.072)#100 | 0.31%(+0.522)#1,081 |
Common Questions
What are the Top 10 Cities with the Highest Percentage of Immigrants from Korea in New Jersey?
Top 10 Cities with the Highest Percentage of Immigrants from Korea in New Jersey are:
#1
39.19%
#2
15.85%
#3
4.89%
#4
3.37%
#5
2.83%
#6
2.71%
#7
2.63%
#8
2.56%
#9
2.49%
#10
2.08%
What city has the Highest Percentage of Immigrants from Korea in New Jersey?
Zarephath has the Highest Percentage of Immigrants from Korea in New Jersey with 39.19%.
What is the Percentage of Immigrants from Korea in the State of New Jersey?
Percentage of Immigrants from Korea in New Jersey is 0.76%.
What is the Percentage of Immigrants from Korea in the United States?
Percentage of Immigrants from Korea in the United States is 0.31%.