Cities with the Highest Percentage of Population with a Degree in Communications in New Jersey
RELATED REPORTS & OPTIONS
Communications
New Jersey
Compare Cities
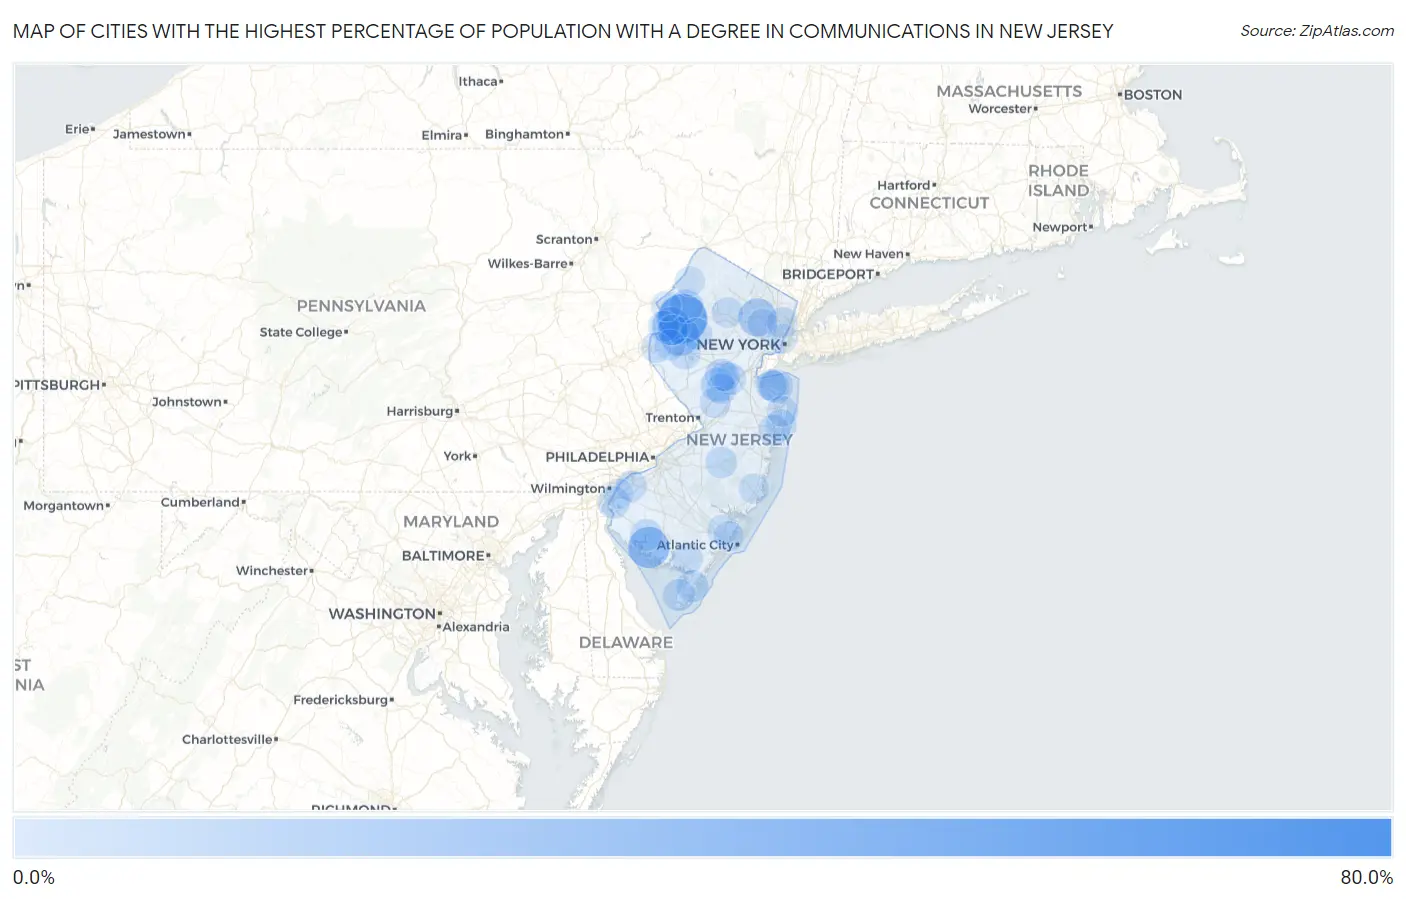
Map of Cities with the Highest Percentage of Population with a Degree in Communications in New Jersey
0.0%
80.0%
Cities with the Highest Percentage of Population with a Degree in Communications in New Jersey
| City | % Graduates | vs State | vs National | |
| 1. | Marlboro | 71.4% | 4.2%(+67.2)#1 | 4.1%(+67.3)#37 |
| 2. | Great Meadows | 50.0% | 4.2%(+45.8)#2 | 4.1%(+45.9)#75 |
| 3. | Marshallville | 45.5% | 4.2%(+41.2)#3 | 4.1%(+41.3)#108 |
| 4. | Jobstown | 33.3% | 4.2%(+29.1)#4 | 4.1%(+29.2)#177 |
| 5. | Cedarville | 31.7% | 4.2%(+27.5)#5 | 4.1%(+27.6)#206 |
| 6. | Anderson | 26.0% | 4.2%(+21.8)#6 | 4.1%(+21.9)#292 |
| 7. | Pottersville | 25.7% | 4.2%(+21.5)#7 | 4.1%(+21.6)#298 |
| 8. | Buttzville | 25.3% | 4.2%(+21.0)#8 | 4.1%(+21.1)#302 |
| 9. | Singac | 24.6% | 4.2%(+20.4)#9 | 4.1%(+20.5)#327 |
| 10. | The Ponds | 21.0% | 4.2%(+16.8)#10 | 4.1%(+16.9)#414 |
| 11. | Seaside Heights Borough | 18.1% | 4.2%(+13.8)#11 | 4.1%(+13.9)#541 |
| 12. | Griggstown | 14.9% | 4.2%(+10.7)#12 | 4.1%(+10.8)#758 |
| 13. | Johnsonburg | 14.7% | 4.2%(+10.4)#13 | 4.1%(+10.6)#779 |
| 14. | Belford | 14.6% | 4.2%(+10.3)#14 | 4.1%(+10.5)#789 |
| 15. | Milmay | 14.5% | 4.2%(+10.3)#15 | 4.1%(+10.4)#796 |
| 16. | Clearbrook | 13.3% | 4.2%(+9.08)#16 | 4.1%(+9.19)#942 |
| 17. | National Park Borough | 12.7% | 4.2%(+8.41)#17 | 4.1%(+8.52)#1,030 |
| 18. | East Millstone | 12.6% | 4.2%(+8.35)#18 | 4.1%(+8.46)#1,035 |
| 19. | Merchantville Borough | 12.6% | 4.2%(+8.34)#19 | 4.1%(+8.45)#1,036 |
| 20. | Hi Nella Borough | 12.2% | 4.2%(+7.99)#20 | 4.1%(+8.10)#1,103 |
| 21. | Cape May Court House | 11.9% | 4.2%(+7.66)#21 | 4.1%(+7.77)#1,150 |
| 22. | Sweetwater | 11.8% | 4.2%(+7.55)#22 | 4.1%(+7.66)#1,173 |
| 23. | Voorhees | 11.7% | 4.2%(+7.50)#23 | 4.1%(+7.61)#1,196 |
| 24. | Villas | 11.7% | 4.2%(+7.49)#24 | 4.1%(+7.60)#1,197 |
| 25. | Dennisville | 11.6% | 4.2%(+7.31)#25 | 4.1%(+7.42)#1,220 |
| 26. | Saddle River Borough | 11.5% | 4.2%(+7.28)#26 | 4.1%(+7.39)#1,230 |
| 27. | Pennsville | 11.5% | 4.2%(+7.27)#27 | 4.1%(+7.38)#1,232 |
| 28. | Palmyra Borough | 11.5% | 4.2%(+7.21)#28 | 4.1%(+7.32)#1,242 |
| 29. | Keyport Borough | 11.2% | 4.2%(+6.94)#29 | 4.1%(+7.05)#1,282 |
| 30. | Port Morris | 11.0% | 4.2%(+6.71)#30 | 4.1%(+6.82)#1,340 |
| 31. | Goshen | 10.9% | 4.2%(+6.65)#31 | 4.1%(+6.76)#1,361 |
| 32. | Bridgeton | 10.9% | 4.2%(+6.64)#32 | 4.1%(+6.75)#1,364 |
| 33. | Westville Borough | 10.7% | 4.2%(+6.45)#33 | 4.1%(+6.56)#1,408 |
| 34. | Vauxhall | 10.5% | 4.2%(+6.29)#34 | 4.1%(+6.40)#1,440 |
| 35. | Watsessing | 10.5% | 4.2%(+6.26)#35 | 4.1%(+6.37)#1,455 |
| 36. | Mountain Lakes Borough | 10.4% | 4.2%(+6.15)#36 | 4.1%(+6.26)#1,480 |
| 37. | Alpha Borough | 10.3% | 4.2%(+6.04)#37 | 4.1%(+6.15)#1,504 |
| 38. | Presidential Lakes Estates | 10.2% | 4.2%(+5.91)#38 | 4.1%(+6.02)#1,541 |
| 39. | Runnemede Borough | 10.1% | 4.2%(+5.90)#39 | 4.1%(+6.01)#1,549 |
| 40. | Midland Park Borough | 10.1% | 4.2%(+5.89)#40 | 4.1%(+6.00)#1,551 |
| 41. | Berlin Borough | 10.1% | 4.2%(+5.88)#41 | 4.1%(+5.99)#1,556 |
| 42. | Long Valley | 9.9% | 4.2%(+5.63)#42 | 4.1%(+5.74)#1,622 |
| 43. | West Belmar | 9.9% | 4.2%(+5.63)#43 | 4.1%(+5.74)#1,626 |
| 44. | Annandale | 9.9% | 4.2%(+5.63)#44 | 4.1%(+5.74)#1,627 |
| 45. | Newport | 9.8% | 4.2%(+5.59)#45 | 4.1%(+5.70)#1,642 |
| 46. | Port Monmouth | 9.6% | 4.2%(+5.40)#46 | 4.1%(+5.51)#1,693 |
| 47. | Sea Bright Borough | 9.6% | 4.2%(+5.36)#47 | 4.1%(+5.47)#1,711 |
| 48. | Allenwood | 9.6% | 4.2%(+5.31)#48 | 4.1%(+5.42)#1,722 |
| 49. | Beckett | 9.5% | 4.2%(+5.30)#49 | 4.1%(+5.41)#1,723 |
| 50. | North Middletown | 9.5% | 4.2%(+5.27)#50 | 4.1%(+5.38)#1,744 |
| 51. | Crosswicks | 9.5% | 4.2%(+5.24)#51 | 4.1%(+5.35)#1,749 |
| 52. | Titusville | 9.4% | 4.2%(+5.19)#52 | 4.1%(+5.30)#1,768 |
| 53. | White Meadow Lake | 9.4% | 4.2%(+5.15)#53 | 4.1%(+5.26)#1,779 |
| 54. | Belleplain | 9.4% | 4.2%(+5.13)#54 | 4.1%(+5.24)#1,787 |
| 55. | Raritan Borough | 9.3% | 4.2%(+5.09)#55 | 4.1%(+5.20)#1,795 |
| 56. | Wrightstown Borough | 9.3% | 4.2%(+5.01)#56 | 4.1%(+5.12)#1,823 |
| 57. | Waldwick Borough | 9.2% | 4.2%(+4.96)#57 | 4.1%(+5.07)#1,835 |
| 58. | Califon Borough | 9.1% | 4.2%(+4.89)#58 | 4.1%(+5.00)#1,849 |
| 59. | Lawnside Borough | 9.1% | 4.2%(+4.86)#59 | 4.1%(+4.97)#1,855 |
| 60. | Princeton Junction | 9.1% | 4.2%(+4.84)#60 | 4.1%(+4.95)#1,895 |
| 61. | Paulsboro Borough | 9.1% | 4.2%(+4.83)#61 | 4.1%(+4.94)#1,896 |
| 62. | Oakhurst | 9.1% | 4.2%(+4.81)#62 | 4.1%(+4.92)#1,898 |
| 63. | Packanack Lake | 8.9% | 4.2%(+4.70)#63 | 4.1%(+4.81)#1,940 |
| 64. | Allentown Borough | 8.9% | 4.2%(+4.67)#64 | 4.1%(+4.78)#1,945 |
| 65. | Kendall Park | 8.9% | 4.2%(+4.64)#65 | 4.1%(+4.75)#1,961 |
| 66. | Belvidere | 8.9% | 4.2%(+4.63)#66 | 4.1%(+4.74)#1,962 |
| 67. | Ridgefield Park | 8.8% | 4.2%(+4.52)#67 | 4.1%(+4.63)#2,005 |
| 68. | Hightstown Borough | 8.7% | 4.2%(+4.50)#68 | 4.1%(+4.61)#2,014 |
| 69. | Glen Ridge Borough | 8.7% | 4.2%(+4.47)#69 | 4.1%(+4.58)#2,024 |
| 70. | Asbury | 8.6% | 4.2%(+4.38)#70 | 4.1%(+4.49)#2,072 |
| 71. | Ridgefield Borough | 8.5% | 4.2%(+4.29)#71 | 4.1%(+4.40)#2,105 |
| 72. | Swedesboro Borough | 8.4% | 4.2%(+4.20)#72 | 4.1%(+4.31)#2,147 |
| 73. | Mauricetown | 8.2% | 4.2%(+3.96)#73 | 4.1%(+4.07)#2,261 |
| 74. | Hillsdale Borough | 8.2% | 4.2%(+3.96)#74 | 4.1%(+4.07)#2,263 |
| 75. | Penns Grove Borough | 8.2% | 4.2%(+3.94)#75 | 4.1%(+4.05)#2,277 |
| 76. | Oxford | 8.2% | 4.2%(+3.92)#76 | 4.1%(+4.03)#2,282 |
| 77. | Franklin Lakes Borough | 8.2% | 4.2%(+3.92)#77 | 4.1%(+4.03)#2,286 |
| 78. | Haddon Heights Borough | 8.1% | 4.2%(+3.85)#78 | 4.1%(+3.96)#2,312 |
| 79. | Gillette | 8.1% | 4.2%(+3.84)#79 | 4.1%(+3.95)#2,315 |
| 80. | Greenwich | 8.1% | 4.2%(+3.83)#80 | 4.1%(+3.94)#2,320 |
| 81. | Pomona | 8.1% | 4.2%(+3.82)#81 | 4.1%(+3.93)#2,324 |
| 82. | Atlantic Highlands Borough | 7.9% | 4.2%(+3.63)#82 | 4.1%(+3.74)#2,421 |
| 83. | Absecon | 7.8% | 4.2%(+3.55)#83 | 4.1%(+3.66)#2,470 |
| 84. | Ocean Acres | 7.7% | 4.2%(+3.47)#84 | 4.1%(+3.58)#2,503 |
| 85. | Hopewell Borough | 7.7% | 4.2%(+3.46)#85 | 4.1%(+3.57)#2,504 |
| 86. | Bradley Beach Borough | 7.7% | 4.2%(+3.45)#86 | 4.1%(+3.56)#2,508 |
| 87. | Rutherford Borough | 7.7% | 4.2%(+3.43)#87 | 4.1%(+3.54)#2,556 |
| 88. | Riverdale Borough | 7.7% | 4.2%(+3.42)#88 | 4.1%(+3.53)#2,560 |
| 89. | Hainesburg | 7.5% | 4.2%(+3.30)#89 | 4.1%(+3.41)#2,629 |
| 90. | Upper Montclair | 7.4% | 4.2%(+3.18)#90 | 4.1%(+3.29)#2,691 |
| 91. | Ocean View | 7.4% | 4.2%(+3.16)#91 | 4.1%(+3.27)#2,700 |
| 92. | Hoboken | 7.4% | 4.2%(+3.14)#92 | 4.1%(+3.25)#2,724 |
| 93. | Far Hills Borough | 7.4% | 4.2%(+3.13)#93 | 4.1%(+3.24)#2,735 |
| 94. | Middlebush | 7.3% | 4.2%(+3.09)#94 | 4.1%(+3.20)#2,773 |
| 95. | Little Ferry Borough | 7.3% | 4.2%(+3.08)#95 | 4.1%(+3.19)#2,778 |
| 96. | Carneys Point | 7.3% | 4.2%(+3.02)#96 | 4.1%(+3.13)#2,828 |
| 97. | Great Notch | 7.2% | 4.2%(+2.98)#97 | 4.1%(+3.09)#2,850 |
| 98. | Crandon Lakes | 7.2% | 4.2%(+2.97)#98 | 4.1%(+3.08)#2,859 |
| 99. | Westmont | 7.2% | 4.2%(+2.96)#99 | 4.1%(+3.07)#2,870 |
| 100. | Fair Haven Borough | 7.1% | 4.2%(+2.90)#100 | 4.1%(+3.01)#2,906 |
Common Questions
What are the Top 10 Cities with the Highest Percentage of Population with a Degree in Communications in New Jersey?
Top 10 Cities with the Highest Percentage of Population with a Degree in Communications in New Jersey are:
#1
50.0%
#2
31.7%
#3
26.0%
#4
25.3%
#5
24.6%
#6
14.9%
#7
14.7%
#8
14.6%
#9
12.6%
#10
11.9%
What city has the Highest Percentage of Population with a Degree in Communications in New Jersey?
Great Meadows has the Highest Percentage of Population with a Degree in Communications in New Jersey with 50.0%.
What is the Percentage of Population with a Degree in Communications in the State of New Jersey?
Percentage of Population with a Degree in Communications in New Jersey is 4.2%.
What is the Percentage of Population with a Degree in Communications in the United States?
Percentage of Population with a Degree in Communications in the United States is 4.1%.