Lawrenceville, NJ Map & Demographics
Lawrenceville Map
Lawrenceville Overview
$63,719
PER CAPITA INCOME
$170,194
AVG FAMILY INCOME
$115,577
AVG HOUSEHOLD INCOME
17.5%
WAGE / INCOME GAP [ % ]
82.5¢/ $1
WAGE / INCOME GAP [ $ ]
0.43
INEQUALITY / GINI INDEX
3,759
TOTAL POPULATION
1,806
MALE POPULATION
1,953
FEMALE POPULATION
92.47
MALES / 100 FEMALES
108.14
FEMALES / 100 MALES
47.2
MEDIAN AGE
3.0
AVG FAMILY SIZE
2.2
AVG HOUSEHOLD SIZE
2,113
LABOR FORCE [ PEOPLE ]
67.5%
PERCENT IN LABOR FORCE
7.2%
UNEMPLOYMENT RATE
Lawrenceville Area Codes
Income in Lawrenceville
Income Overview in Lawrenceville
Per Capita Income in Lawrenceville is $63,719, while median incomes of families and households are $170,194 and $115,577 respectively.
| Characteristic | Number | Measure |
| Per Capita Income | 3,759 | $63,719 |
| Median Family Income | 1,003 | $170,194 |
| Mean Family Income | 1,003 | $184,369 |
| Median Household Income | 1,736 | $115,577 |
| Mean Household Income | 1,736 | $137,531 |
| Income Deficit | 1,003 | $0 |
| Wage / Income Gap (%) | 3,759 | 17.48% |
| Wage / Income Gap ($) | 3,759 | 82.52¢ per $1 |
| Gini / Inequality Index | 3,759 | 0.43 |
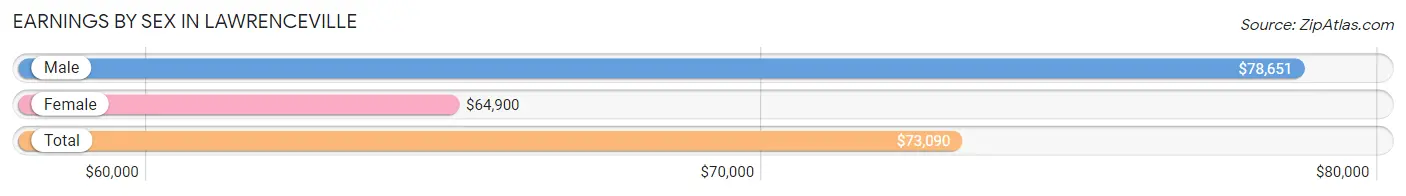
Earnings by Sex in Lawrenceville
Average Earnings in Lawrenceville are $73,090, $78,651 for men and $64,900 for women, a difference of 17.5%.
| Sex | Number | Average Earnings |
| Male | 907 (42.3%) | $78,651 |
| Female | 1,238 (57.7%) | $64,900 |
| Total | 2,145 (100.0%) | $73,090 |
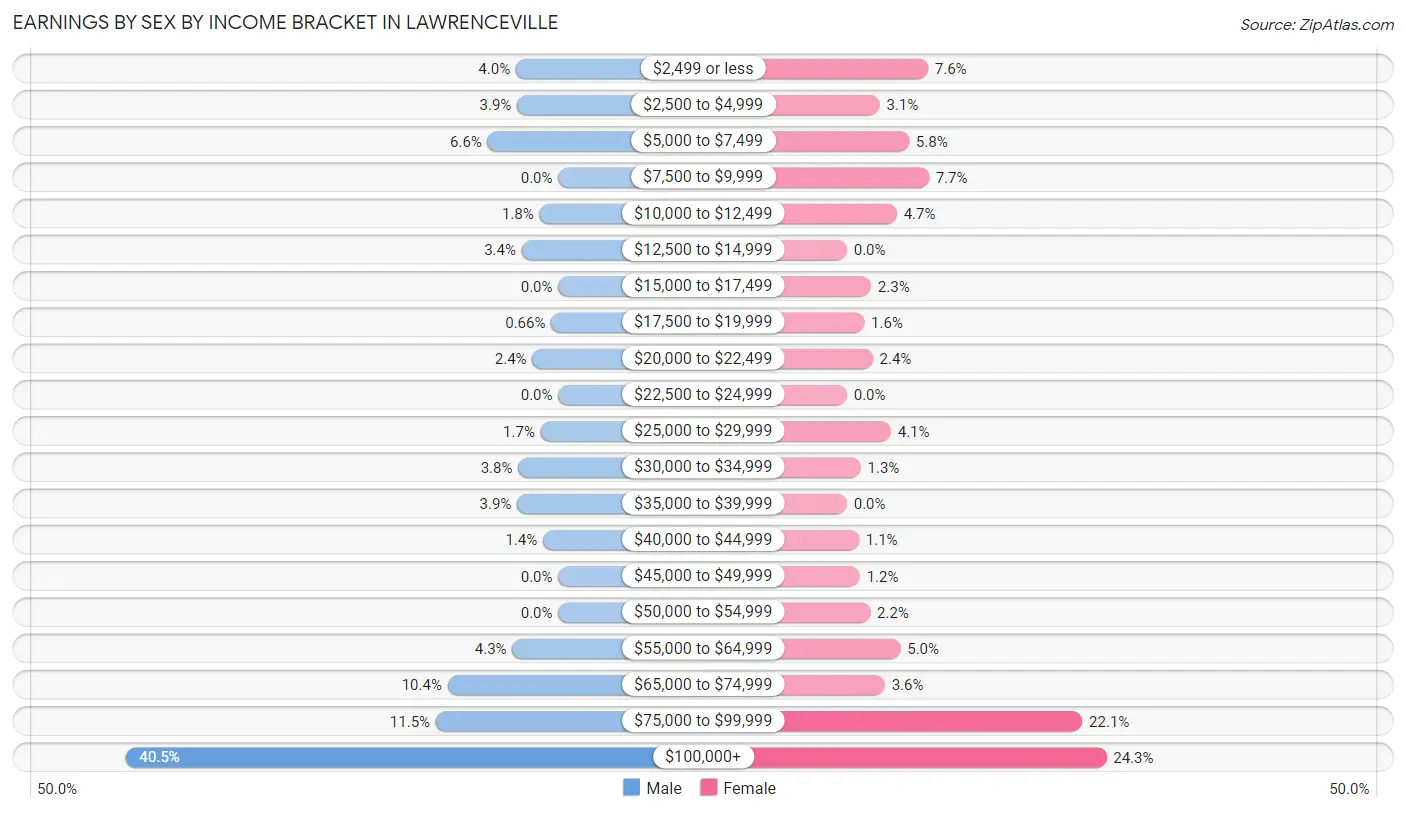
Earnings by Sex by Income Bracket in Lawrenceville
The most common earnings brackets in Lawrenceville are $100,000+ for men (367 | 40.5%) and $100,000+ for women (301 | 24.3%).
| Income | Male | Female |
| $2,499 or less | 36 (4.0%) | 94 (7.6%) |
| $2,500 to $4,999 | 35 (3.9%) | 38 (3.1%) |
| $5,000 to $7,499 | 60 (6.6%) | 72 (5.8%) |
| $7,500 to $9,999 | 0 (0.0%) | 95 (7.7%) |
| $10,000 to $12,499 | 16 (1.8%) | 58 (4.7%) |
| $12,500 to $14,999 | 31 (3.4%) | 0 (0.0%) |
| $15,000 to $17,499 | 0 (0.0%) | 28 (2.3%) |
| $17,500 to $19,999 | 6 (0.7%) | 20 (1.6%) |
| $20,000 to $22,499 | 22 (2.4%) | 30 (2.4%) |
| $22,500 to $24,999 | 0 (0.0%) | 0 (0.0%) |
| $25,000 to $29,999 | 15 (1.7%) | 51 (4.1%) |
| $30,000 to $34,999 | 34 (3.7%) | 16 (1.3%) |
| $35,000 to $39,999 | 35 (3.9%) | 0 (0.0%) |
| $40,000 to $44,999 | 13 (1.4%) | 14 (1.1%) |
| $45,000 to $49,999 | 0 (0.0%) | 15 (1.2%) |
| $50,000 to $54,999 | 0 (0.0%) | 27 (2.2%) |
| $55,000 to $64,999 | 39 (4.3%) | 62 (5.0%) |
| $65,000 to $74,999 | 94 (10.4%) | 44 (3.5%) |
| $75,000 to $99,999 | 104 (11.5%) | 273 (22.1%) |
| $100,000+ | 367 (40.5%) | 301 (24.3%) |
| Total | 907 (100.0%) | 1,238 (100.0%) |
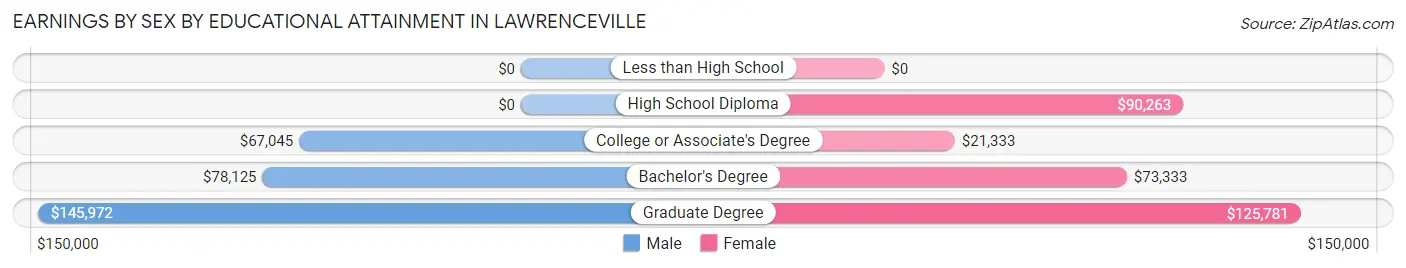
Earnings by Sex by Educational Attainment in Lawrenceville
Average earnings in Lawrenceville are $93,313 for men and $74,135 for women, a difference of 20.5%. Men with an educational attainment of graduate degree enjoy the highest average annual earnings of $145,972, while those with college or associate's degree education earn the least with $67,045. Women with an educational attainment of graduate degree earn the most with the average annual earnings of $125,781, while those with college or associate's degree education have the smallest earnings of $21,333.
| Educational Attainment | Male Income | Female Income |
| Less than High School | - | - |
| High School Diploma | - | - |
| College or Associate's Degree | $67,045 | $21,333 |
| Bachelor's Degree | $78,125 | $73,333 |
| Graduate Degree | $145,972 | $125,781 |
| Total | $93,313 | $74,135 |
Family Income in Lawrenceville
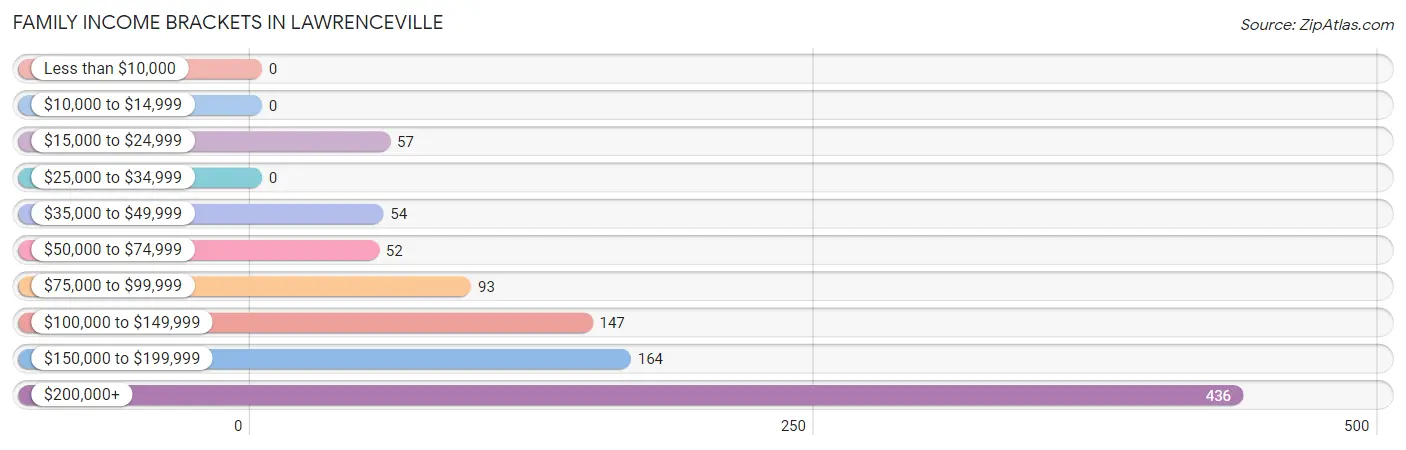
Family Income Brackets in Lawrenceville
According to the Lawrenceville family income data, there are 436 families falling into the $200,000+ income range, which is the most common income bracket and makes up 43.5% of all families.
| Income Bracket | # Families | % Families |
| Less than $10,000 | 0 | 0.0% |
| $10,000 to $14,999 | 0 | 0.0% |
| $15,000 to $24,999 | 57 | 5.7% |
| $25,000 to $34,999 | 0 | 0.0% |
| $35,000 to $49,999 | 54 | 5.4% |
| $50,000 to $74,999 | 52 | 5.2% |
| $75,000 to $99,999 | 93 | 9.3% |
| $100,000 to $149,999 | 147 | 14.7% |
| $150,000 to $199,999 | 164 | 16.4% |
| $200,000+ | 436 | 43.5% |
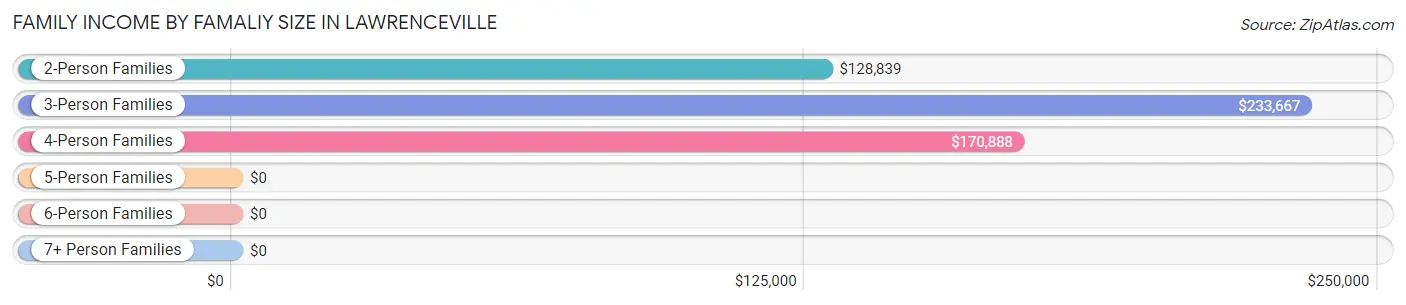
Family Income by Famaliy Size in Lawrenceville
3-person families (98 | 9.8%) account for the highest median family income in Lawrenceville with $233,667 per family, while 3-person families (98 | 9.8%) have the highest median income of $77,889 per family member.
| Income Bracket | # Families | Median Income |
| 2-Person Families | 609 (60.7%) | $128,839 |
| 3-Person Families | 98 (9.8%) | $233,667 |
| 4-Person Families | 199 (19.8%) | $170,888 |
| 5-Person Families | 37 (3.7%) | $0 |
| 6-Person Families | 27 (2.7%) | $0 |
| 7+ Person Families | 33 (3.3%) | $0 |
| Total | 1,003 (100.0%) | $170,194 |
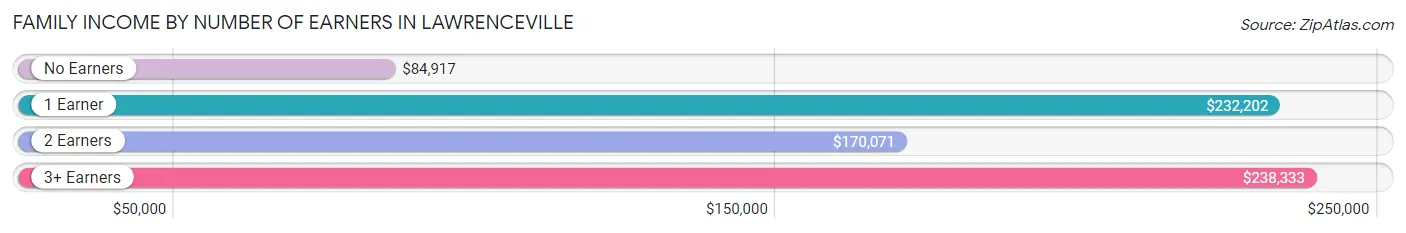
Family Income by Number of Earners in Lawrenceville
The median family income in Lawrenceville is $170,194, with families comprising 3+ earners (132) having the highest median family income of $238,333, while families with no earners (115) have the lowest median family income of $84,917, accounting for 13.2% and 11.5% of families, respectively.
| Number of Earners | # Families | Median Income |
| No Earners | 115 (11.5%) | $84,917 |
| 1 Earner | 313 (31.2%) | $232,202 |
| 2 Earners | 443 (44.2%) | $170,071 |
| 3+ Earners | 132 (13.2%) | $238,333 |
| Total | 1,003 (100.0%) | $170,194 |
Household Income in Lawrenceville
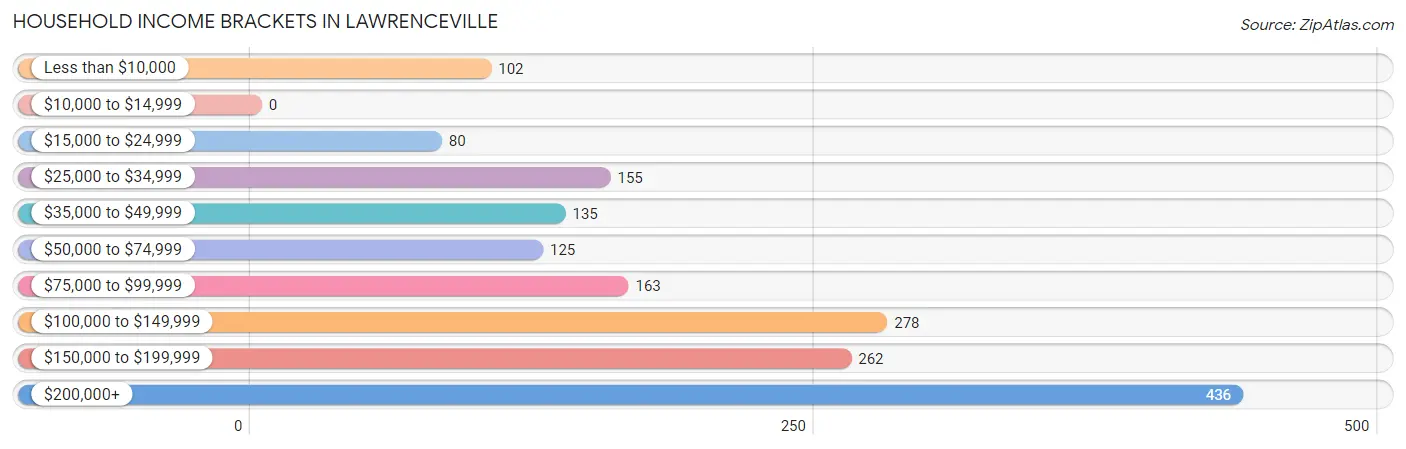
Household Income Brackets in Lawrenceville
With 436 households falling in the category, the $200,000+ income range is the most frequent in Lawrenceville, accounting for 25.1% of all households.
| Income Bracket | # Households | % Households |
| Less than $10,000 | 102 | 5.9% |
| $10,000 to $14,999 | 0 | 0.0% |
| $15,000 to $24,999 | 80 | 4.6% |
| $25,000 to $34,999 | 155 | 8.9% |
| $35,000 to $49,999 | 135 | 7.8% |
| $50,000 to $74,999 | 125 | 7.2% |
| $75,000 to $99,999 | 163 | 9.4% |
| $100,000 to $149,999 | 278 | 16.0% |
| $150,000 to $199,999 | 262 | 15.1% |
| $200,000+ | 436 | 25.1% |
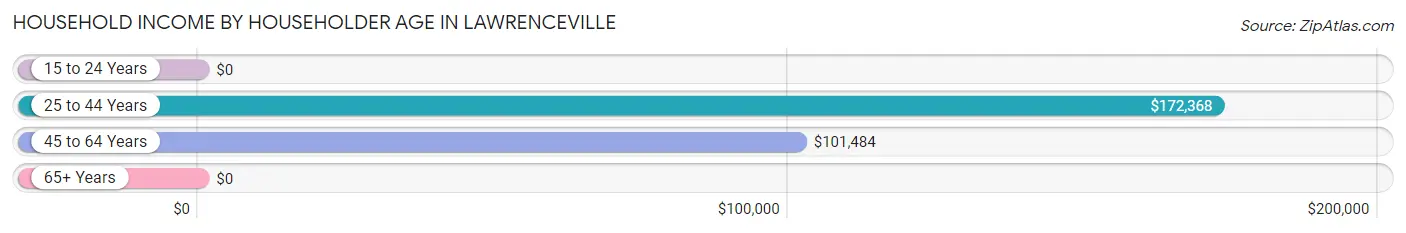
Household Income by Householder Age in Lawrenceville
The median household income in Lawrenceville is $115,577, with the highest median household income of $172,368 found in the 25 to 44 years age bracket for the primary householder. A total of 438 households (25.2%) fall into this category.
| Income Bracket | # Households | Median Income |
| 15 to 24 Years | 0 (0.0%) | $0 |
| 25 to 44 Years | 438 (25.2%) | $172,368 |
| 45 to 64 Years | 653 (37.6%) | $101,484 |
| 65+ Years | 645 (37.1%) | $0 |
| Total | 1,736 (100.0%) | $115,577 |
Poverty in Lawrenceville
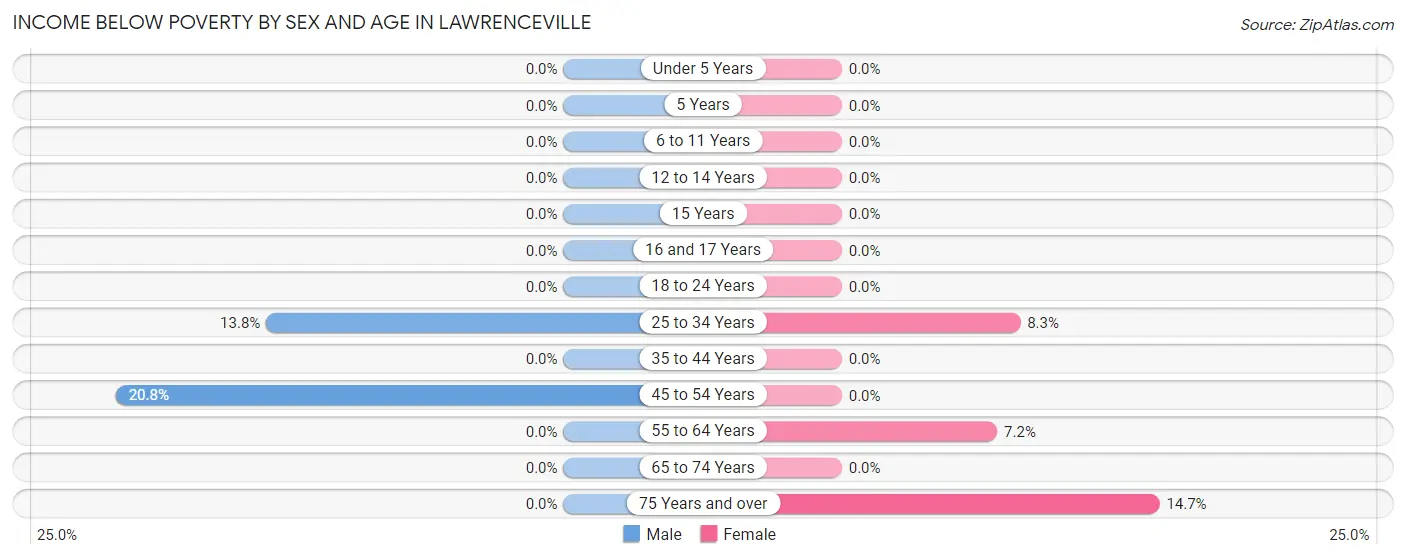
Income Below Poverty by Sex and Age in Lawrenceville
With 3.3% poverty level for males and 3.8% for females among the residents of Lawrenceville, 45 to 54 year old males and 75 year old and over females are the most vulnerable to poverty, with 43 males (20.8%) and 28 females (14.7%) in their respective age groups living below the poverty level.
| Age Bracket | Male | Female |
| Under 5 Years | 0 (0.0%) | 0 (0.0%) |
| 5 Years | 0 (0.0%) | 0 (0.0%) |
| 6 to 11 Years | 0 (0.0%) | 0 (0.0%) |
| 12 to 14 Years | 0 (0.0%) | 0 (0.0%) |
| 15 Years | 0 (0.0%) | 0 (0.0%) |
| 16 and 17 Years | 0 (0.0%) | 0 (0.0%) |
| 18 to 24 Years | 0 (0.0%) | 0 (0.0%) |
| 25 to 34 Years | 16 (13.8%) | 14 (8.3%) |
| 35 to 44 Years | 0 (0.0%) | 0 (0.0%) |
| 45 to 54 Years | 43 (20.8%) | 0 (0.0%) |
| 55 to 64 Years | 0 (0.0%) | 33 (7.2%) |
| 65 to 74 Years | 0 (0.0%) | 0 (0.0%) |
| 75 Years and over | 0 (0.0%) | 28 (14.7%) |
| Total | 59 (3.3%) | 75 (3.8%) |
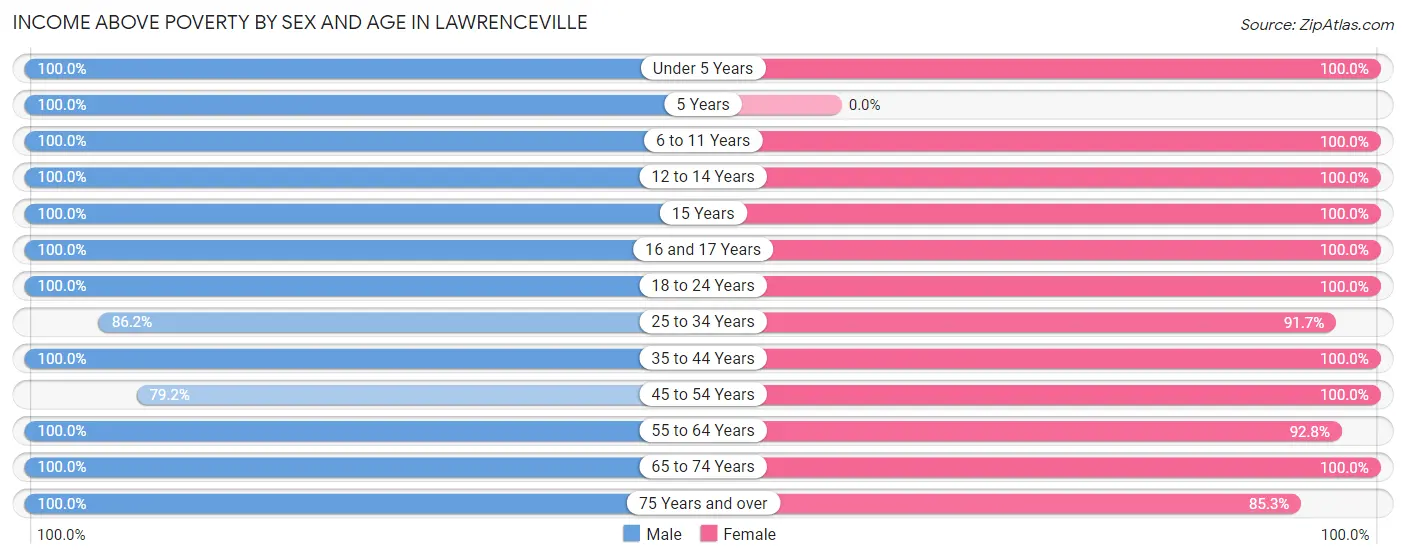
Income Above Poverty by Sex and Age in Lawrenceville
According to the poverty statistics in Lawrenceville, males aged under 5 years and females aged under 5 years are the age groups that are most secure financially, with 100.0% of males and 100.0% of females in these age groups living above the poverty line.
| Age Bracket | Male | Female |
| Under 5 Years | 203 (100.0%) | 44 (100.0%) |
| 5 Years | 75 (100.0%) | 0 (0.0%) |
| 6 to 11 Years | 55 (100.0%) | 76 (100.0%) |
| 12 to 14 Years | 49 (100.0%) | 66 (100.0%) |
| 15 Years | 25 (100.0%) | 36 (100.0%) |
| 16 and 17 Years | 19 (100.0%) | 27 (100.0%) |
| 18 to 24 Years | 126 (100.0%) | 103 (100.0%) |
| 25 to 34 Years | 100 (86.2%) | 155 (91.7%) |
| 35 to 44 Years | 228 (100.0%) | 386 (100.0%) |
| 45 to 54 Years | 164 (79.2%) | 131 (100.0%) |
| 55 to 64 Years | 238 (100.0%) | 425 (92.8%) |
| 65 to 74 Years | 387 (100.0%) | 267 (100.0%) |
| 75 Years and over | 78 (100.0%) | 162 (85.3%) |
| Total | 1,747 (96.7%) | 1,878 (96.2%) |
Income Below Poverty Among Married-Couple Families in Lawrenceville
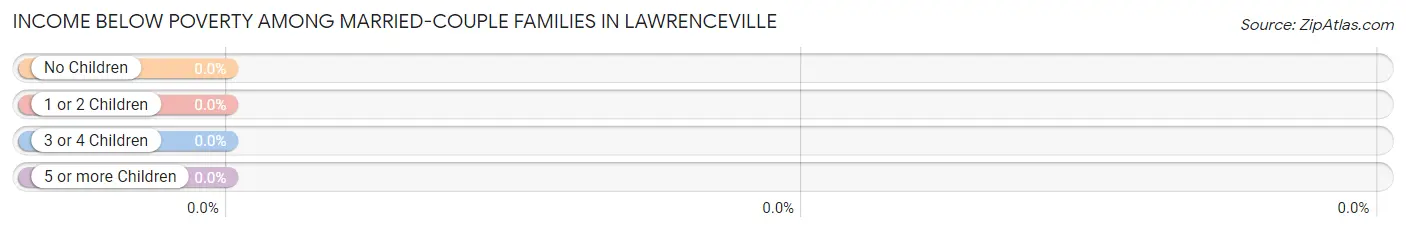
| Children | Above Poverty | Below Poverty |
| No Children | 475 (100.0%) | 0 (0.0%) |
| 1 or 2 Children | 304 (100.0%) | 0 (0.0%) |
| 3 or 4 Children | 0 (0.0%) | 0 (0.0%) |
| 5 or more Children | 0 (0.0%) | 0 (0.0%) |
| Total | 779 (100.0%) | 0 (0.0%) |
Income Below Poverty Among Single-Parent Households in Lawrenceville
| Children | Single Father | Single Mother |
| No Children | 0 (0.0%) | 0 (0.0%) |
| 1 or 2 Children | 0 (0.0%) | 0 (0.0%) |
| 3 or 4 Children | 0 (0.0%) | 0 (0.0%) |
| 5 or more Children | 0 (0.0%) | 0 (0.0%) |
| Total | 0 (0.0%) | 0 (0.0%) |
Income Below Poverty Among Married-Couple vs Single-Parent Households in Lawrenceville
| Children | Married-Couple Families | Single-Parent Households |
| No Children | 0 (0.0%) | 0 (0.0%) |
| 1 or 2 Children | 0 (0.0%) | 0 (0.0%) |
| 3 or 4 Children | 0 (0.0%) | 0 (0.0%) |
| 5 or more Children | 0 (0.0%) | 0 (0.0%) |
| Total | 0 (0.0%) | 0 (0.0%) |
Race in Lawrenceville
The most populous races in Lawrenceville are White / Caucasian (3,183 | 84.7%), Hispanic or Latino (318 | 8.5%), and Asian (290 | 7.7%).
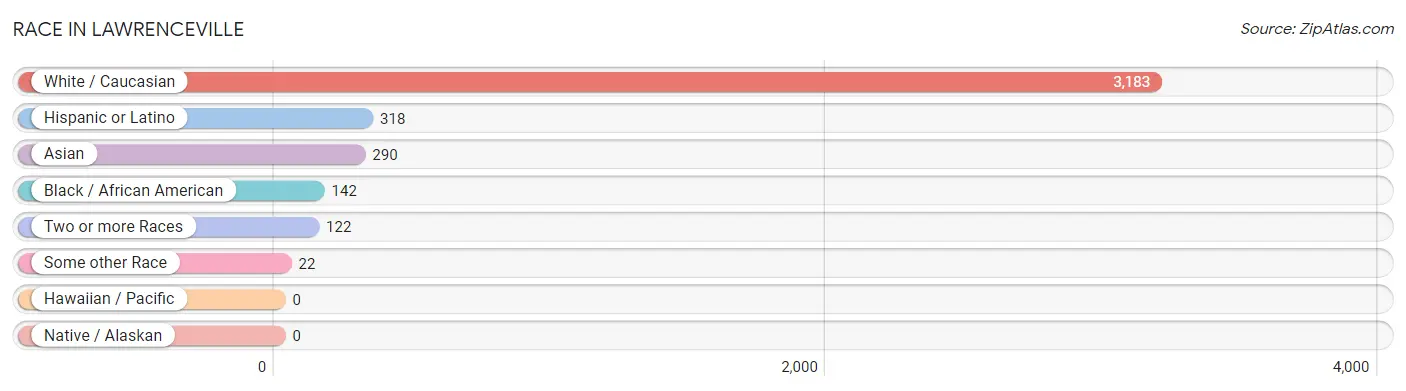
| Race | # Population | % Population |
| Asian | 290 | 7.7% |
| Black / African American | 142 | 3.8% |
| Hawaiian / Pacific | 0 | 0.0% |
| Hispanic or Latino | 318 | 8.5% |
| Native / Alaskan | 0 | 0.0% |
| White / Caucasian | 3,183 | 84.7% |
| Two or more Races | 122 | 3.3% |
| Some other Race | 22 | 0.6% |
| Total | 3,759 | 100.0% |
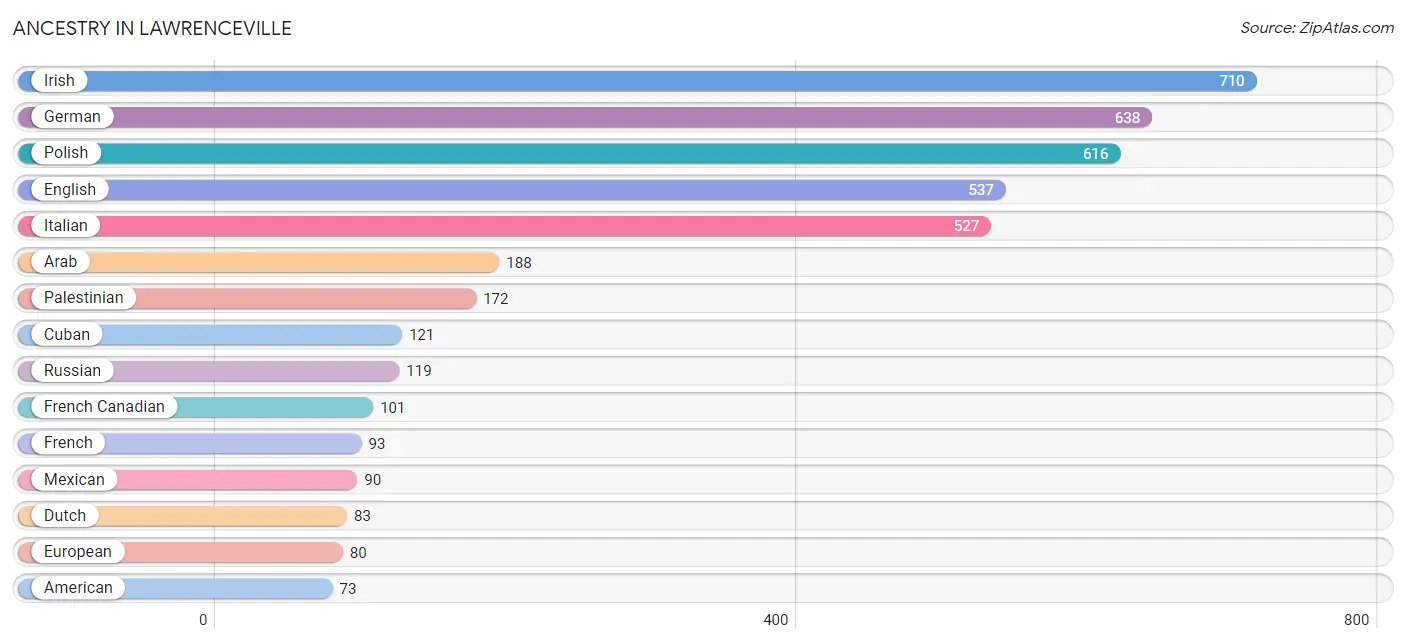
Ancestry in Lawrenceville
The most populous ancestries reported in Lawrenceville are Irish (710 | 18.9%), German (638 | 17.0%), Polish (616 | 16.4%), English (537 | 14.3%), and Italian (527 | 14.0%), together accounting for 80.6% of all Lawrenceville residents.
| Ancestry | # Population | % Population |
| African | 27 | 0.7% |
| American | 73 | 1.9% |
| Arab | 188 | 5.0% |
| Bhutanese | 13 | 0.4% |
| British | 17 | 0.4% |
| Burmese | 15 | 0.4% |
| Canadian | 58 | 1.5% |
| Colombian | 57 | 1.5% |
| Croatian | 17 | 0.4% |
| Cuban | 121 | 3.2% |
| Czech | 16 | 0.4% |
| Dutch | 83 | 2.2% |
| Eastern European | 38 | 1.0% |
| English | 537 | 14.3% |
| European | 80 | 2.1% |
| Filipino | 23 | 0.6% |
| French | 93 | 2.5% |
| French Canadian | 101 | 2.7% |
| German | 638 | 17.0% |
| Greek | 16 | 0.4% |
| Hungarian | 31 | 0.8% |
| Indian (Asian) | 55 | 1.5% |
| Iranian | 13 | 0.4% |
| Irish | 710 | 18.9% |
| Italian | 527 | 14.0% |
| Latvian | 13 | 0.4% |
| Lithuanian | 16 | 0.4% |
| Mexican | 90 | 2.4% |
| Palestinian | 172 | 4.6% |
| Pennsylvania German | 14 | 0.4% |
| Polish | 616 | 16.4% |
| Puerto Rican | 39 | 1.0% |
| Romanian | 20 | 0.5% |
| Russian | 119 | 3.2% |
| Scotch-Irish | 28 | 0.7% |
| Scottish | 59 | 1.6% |
| South American | 57 | 1.5% |
| Subsaharan African | 27 | 0.7% |
| Swedish | 33 | 0.9% |
| Swiss | 16 | 0.4% |
| Thai | 15 | 0.4% |
| Ukrainian | 43 | 1.1% |
| Welsh | 57 | 1.5% | View All 43 Rows |
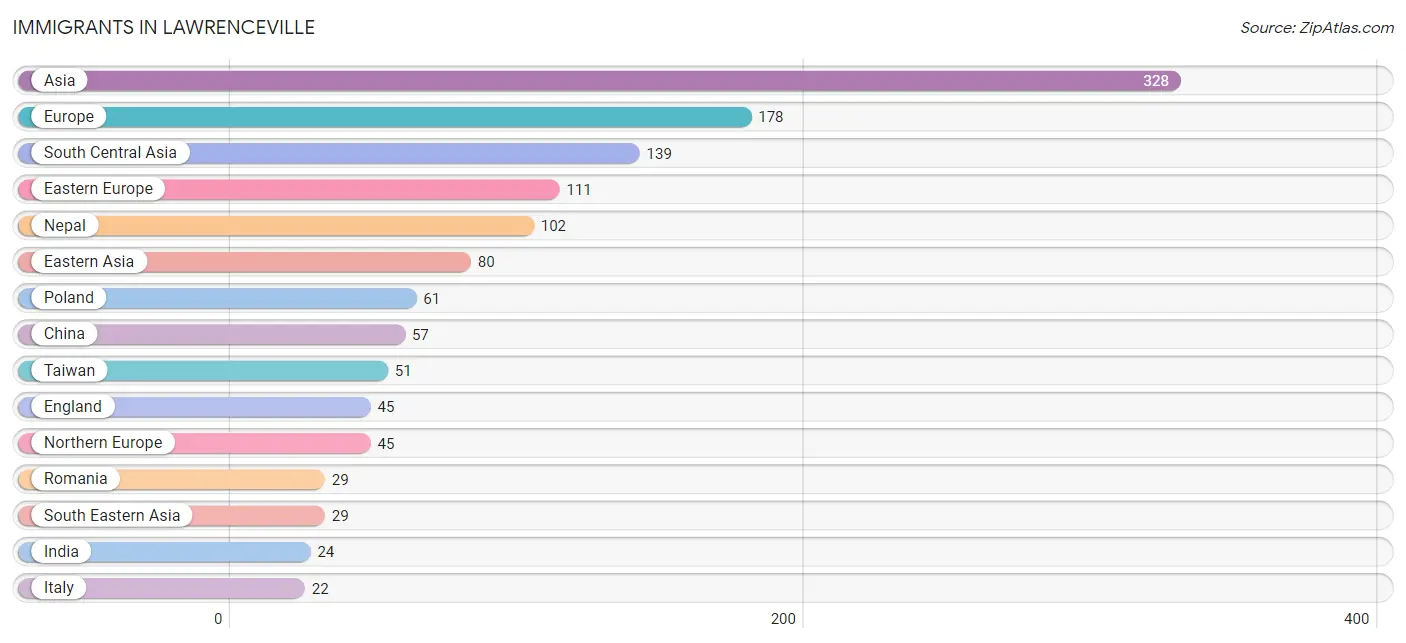
Immigrants in Lawrenceville
The most numerous immigrant groups reported in Lawrenceville came from Asia (328 | 8.7%), Europe (178 | 4.7%), South Central Asia (139 | 3.7%), Eastern Europe (111 | 2.9%), and Nepal (102 | 2.7%), together accounting for 22.8% of all Lawrenceville residents.
| Immigration Origin | # Population | % Population |
| Asia | 328 | 8.7% |
| Belarus | 21 | 0.6% |
| Caribbean | 6 | 0.2% |
| China | 57 | 1.5% |
| Colombia | 15 | 0.4% |
| Eastern Asia | 80 | 2.1% |
| Eastern Europe | 111 | 2.9% |
| England | 45 | 1.2% |
| Europe | 178 | 4.7% |
| India | 24 | 0.6% |
| Indonesia | 12 | 0.3% |
| Iran | 13 | 0.4% |
| Israel | 13 | 0.4% |
| Italy | 22 | 0.6% |
| Japan | 13 | 0.4% |
| Korea | 10 | 0.3% |
| Latin America | 21 | 0.6% |
| Nepal | 102 | 2.7% |
| Northern Europe | 45 | 1.2% |
| Poland | 61 | 1.6% |
| Romania | 29 | 0.8% |
| South America | 15 | 0.4% |
| South Central Asia | 139 | 3.7% |
| South Eastern Asia | 29 | 0.8% |
| Southern Europe | 22 | 0.6% |
| Taiwan | 51 | 1.4% |
| Thailand | 17 | 0.4% |
| Trinidad and Tobago | 6 | 0.2% |
| Western Asia | 13 | 0.4% | View All 29 Rows |
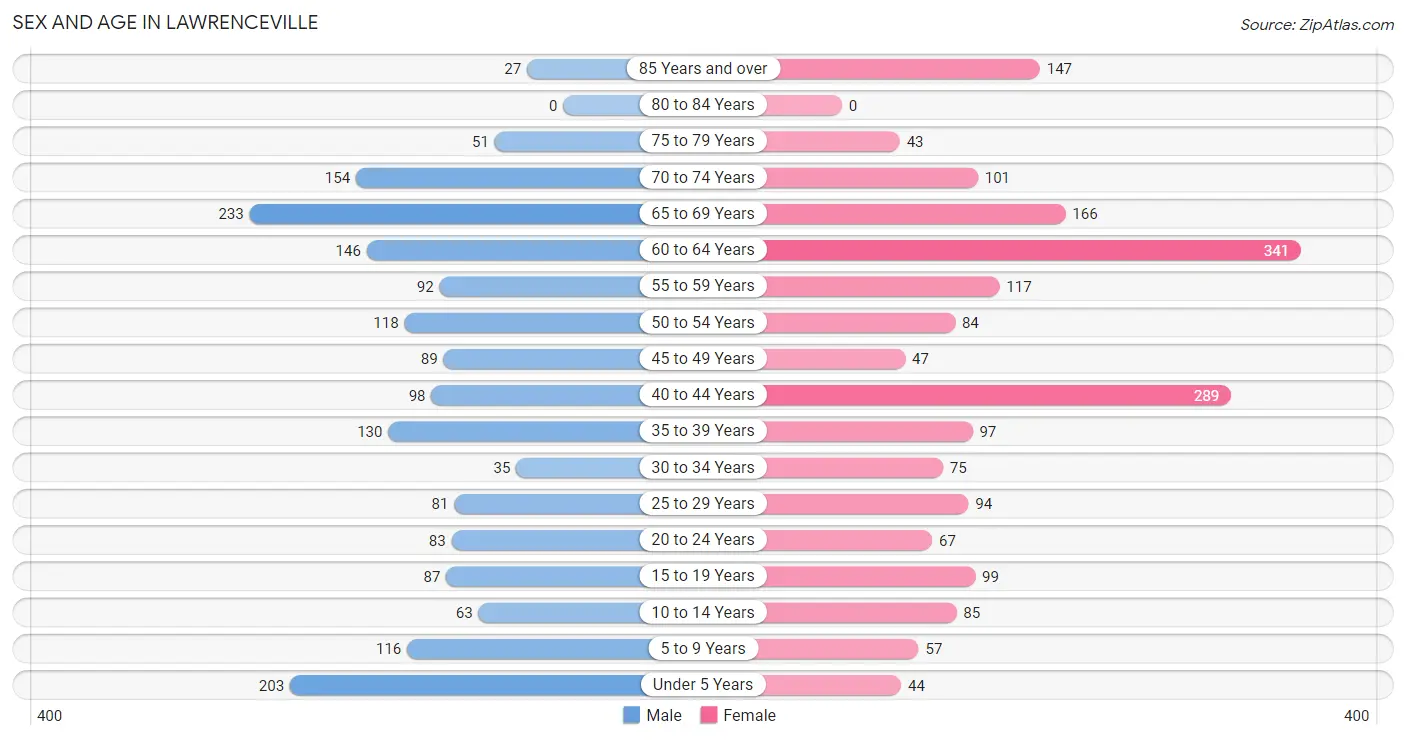
Sex and Age in Lawrenceville
Sex and Age in Lawrenceville
The most populous age groups in Lawrenceville are 65 to 69 Years (233 | 12.9%) for men and 60 to 64 Years (341 | 17.5%) for women.
| Age Bracket | Male | Female |
| Under 5 Years | 203 (11.2%) | 44 (2.2%) |
| 5 to 9 Years | 116 (6.4%) | 57 (2.9%) |
| 10 to 14 Years | 63 (3.5%) | 85 (4.3%) |
| 15 to 19 Years | 87 (4.8%) | 99 (5.1%) |
| 20 to 24 Years | 83 (4.6%) | 67 (3.4%) |
| 25 to 29 Years | 81 (4.5%) | 94 (4.8%) |
| 30 to 34 Years | 35 (1.9%) | 75 (3.8%) |
| 35 to 39 Years | 130 (7.2%) | 97 (5.0%) |
| 40 to 44 Years | 98 (5.4%) | 289 (14.8%) |
| 45 to 49 Years | 89 (4.9%) | 47 (2.4%) |
| 50 to 54 Years | 118 (6.5%) | 84 (4.3%) |
| 55 to 59 Years | 92 (5.1%) | 117 (6.0%) |
| 60 to 64 Years | 146 (8.1%) | 341 (17.5%) |
| 65 to 69 Years | 233 (12.9%) | 166 (8.5%) |
| 70 to 74 Years | 154 (8.5%) | 101 (5.2%) |
| 75 to 79 Years | 51 (2.8%) | 43 (2.2%) |
| 80 to 84 Years | 0 (0.0%) | 0 (0.0%) |
| 85 Years and over | 27 (1.5%) | 147 (7.5%) |
| Total | 1,806 (100.0%) | 1,953 (100.0%) |
Families and Households in Lawrenceville
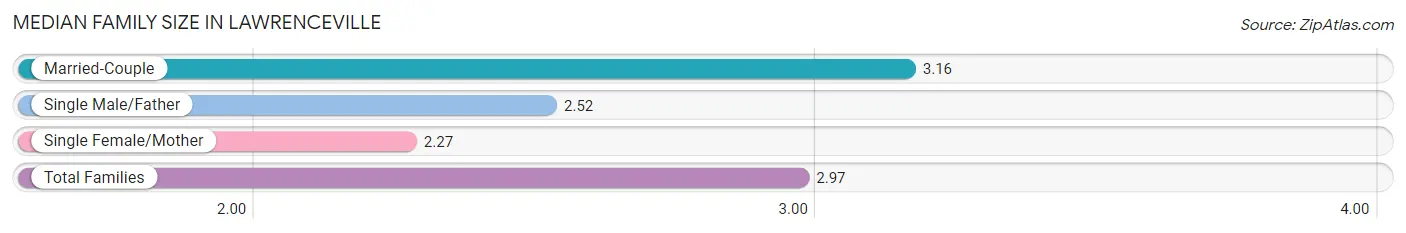
Median Family Size in Lawrenceville
The median family size in Lawrenceville is 2.97 persons per family, with married-couple families (779 | 77.7%) accounting for the largest median family size of 3.16 persons per family. On the other hand, single female/mother families (191 | 19.0%) represent the smallest median family size with 2.27 persons per family.
| Family Type | # Families | Family Size |
| Married-Couple | 779 (77.7%) | 3.16 |
| Single Male/Father | 33 (3.3%) | 2.52 |
| Single Female/Mother | 191 (19.0%) | 2.27 |
| Total Families | 1,003 (100.0%) | 2.97 |
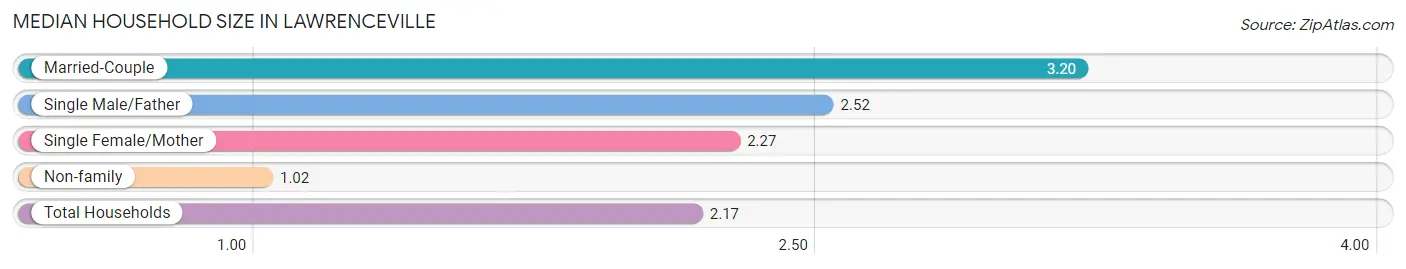
Median Household Size in Lawrenceville
The median household size in Lawrenceville is 2.17 persons per household, with married-couple households (779 | 44.9%) accounting for the largest median household size of 3.2 persons per household. non-family households (733 | 42.2%) represent the smallest median household size with 1.02 persons per household.
| Household Type | # Households | Household Size |
| Married-Couple | 779 (44.9%) | 3.20 |
| Single Male/Father | 33 (1.9%) | 2.52 |
| Single Female/Mother | 191 (11.0%) | 2.27 |
| Non-family | 733 (42.2%) | 1.02 |
| Total Households | 1,736 (100.0%) | 2.17 |
Household Size by Marriage Status in Lawrenceville
Out of a total of 1,736 households in Lawrenceville, 1,003 (57.8%) are family households, while 733 (42.2%) are nonfamily households. The most numerous type of family households are 2-person households, comprising 609, and the most common type of nonfamily households are 1-person households, comprising 720.
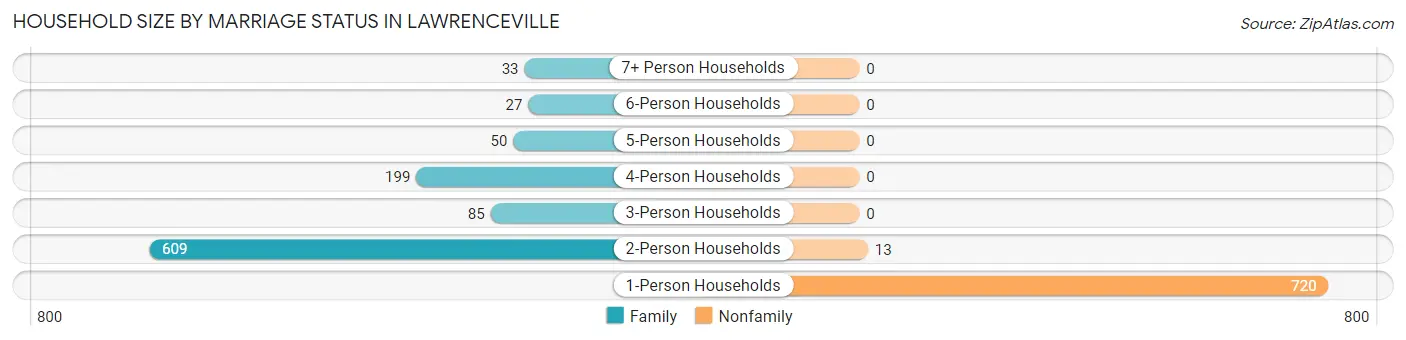
| Household Size | Family Households | Nonfamily Households |
| 1-Person Households | - | 720 (41.5%) |
| 2-Person Households | 609 (35.1%) | 13 (0.7%) |
| 3-Person Households | 85 (4.9%) | 0 (0.0%) |
| 4-Person Households | 199 (11.5%) | 0 (0.0%) |
| 5-Person Households | 50 (2.9%) | 0 (0.0%) |
| 6-Person Households | 27 (1.6%) | 0 (0.0%) |
| 7+ Person Households | 33 (1.9%) | 0 (0.0%) |
| Total | 1,003 (57.8%) | 733 (42.2%) |
Female Fertility in Lawrenceville
Fertility by Age in Lawrenceville
Average fertility rate in Lawrenceville is 52.0 births per 1,000 women. Women in the age bracket of 35 to 50 years have the highest fertility rate with 92.0 births per 1,000 women. Women in the age bracket of 35 to 50 years acount for 100.0% of all women with births.
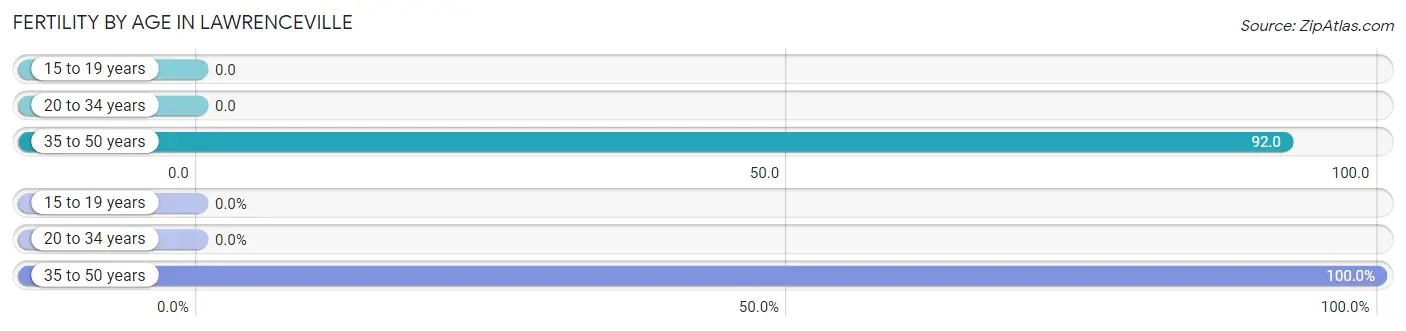
| Age Bracket | Women with Births | Births / 1,000 Women |
| 15 to 19 years | 0 (0.0%) | 0.0 |
| 20 to 34 years | 0 (0.0%) | 0.0 |
| 35 to 50 years | 41 (100.0%) | 92.0 |
| Total | 41 (100.0%) | 52.0 |
Fertility by Age by Marriage Status in Lawrenceville
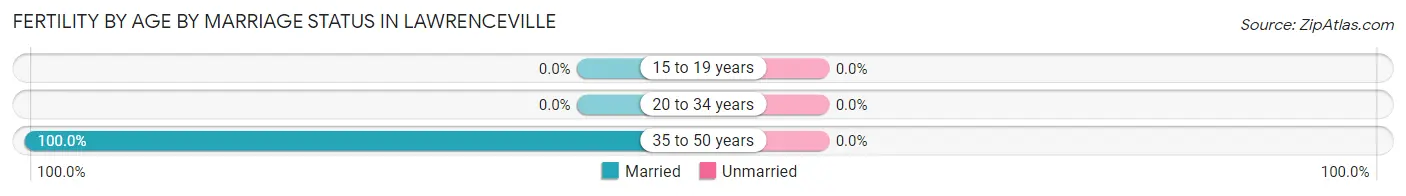
| Age Bracket | Married | Unmarried |
| 15 to 19 years | 0 (0.0%) | 0 (0.0%) |
| 20 to 34 years | 0 (0.0%) | 0 (0.0%) |
| 35 to 50 years | 41 (100.0%) | 0 (0.0%) |
| Total | 41 (100.0%) | 0 (0.0%) |
Fertility by Education in Lawrenceville
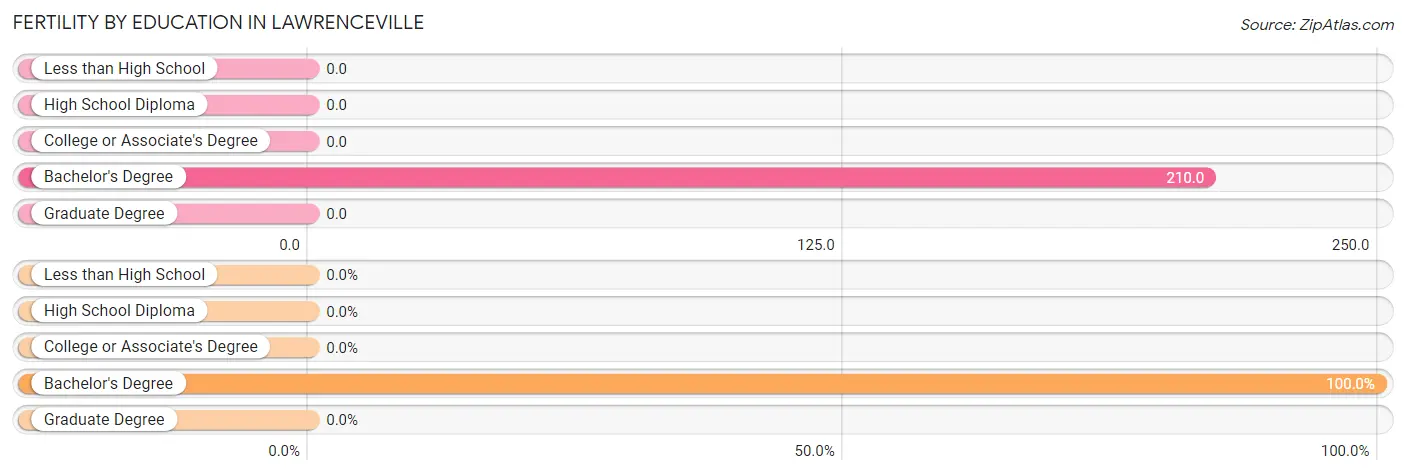
| Educational Attainment | Women with Births | Births / 1,000 Women |
| Less than High School | 0 (0.0%) | 0.0 |
| High School Diploma | 0 (0.0%) | 0.0 |
| College or Associate's Degree | 0 (0.0%) | 0.0 |
| Bachelor's Degree | 41 (100.0%) | 210.0 |
| Graduate Degree | 0 (0.0%) | 0.0 |
| Total | 41 (100.0%) | 52.0 |
Fertility by Education by Marriage Status in Lawrenceville
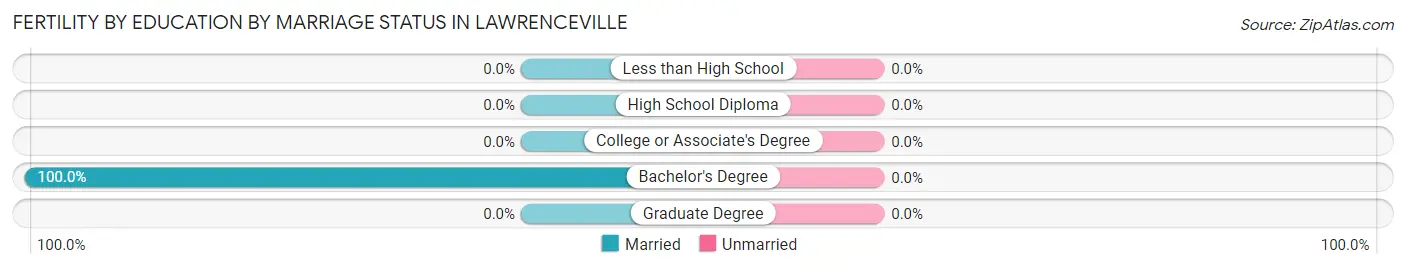
| Educational Attainment | Married | Unmarried |
| Less than High School | 0 (0.0%) | 0 (0.0%) |
| High School Diploma | 0 (0.0%) | 0 (0.0%) |
| College or Associate's Degree | 0 (0.0%) | 0 (0.0%) |
| Bachelor's Degree | 41 (100.0%) | 0 (0.0%) |
| Graduate Degree | 0 (0.0%) | 0 (0.0%) |
| Total | 41 (100.0%) | 0 (0.0%) |
Employment Characteristics in Lawrenceville
Employment by Class of Employer in Lawrenceville
Among the 1,858 employed individuals in Lawrenceville, private company employees (1,152 | 62.0%), not-for-profit organizations (305 | 16.4%), and local government employees (127 | 6.8%) make up the most common classes of employment.
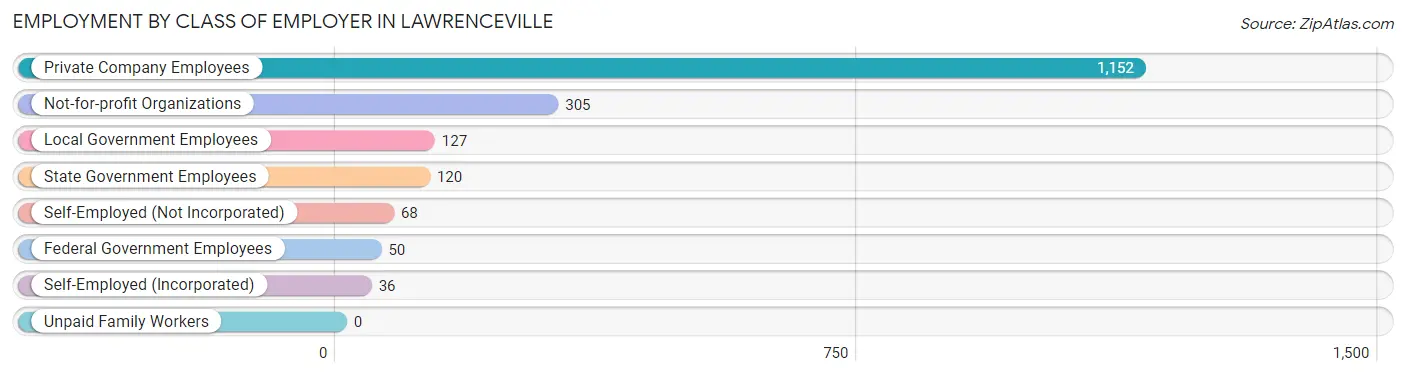
| Employer Class | # Employees | % Employees |
| Private Company Employees | 1,152 | 62.0% |
| Self-Employed (Incorporated) | 36 | 1.9% |
| Self-Employed (Not Incorporated) | 68 | 3.7% |
| Not-for-profit Organizations | 305 | 16.4% |
| Local Government Employees | 127 | 6.8% |
| State Government Employees | 120 | 6.5% |
| Federal Government Employees | 50 | 2.7% |
| Unpaid Family Workers | 0 | 0.0% |
| Total | 1,858 | 100.0% |
Employment Status by Age in Lawrenceville
According to the labor force statistics for Lawrenceville, out of the total population over 16 years of age (3,130), 67.5% or 2,113 individuals are in the labor force, with 7.2% or 152 of them unemployed. The age group with the highest labor force participation rate is 25 to 29 years, with 100.0% or 175 individuals in the labor force. Within the labor force, the 30 to 34 years age range has the highest percentage of unemployed individuals, with 16.4% or 18 of them being unemployed.
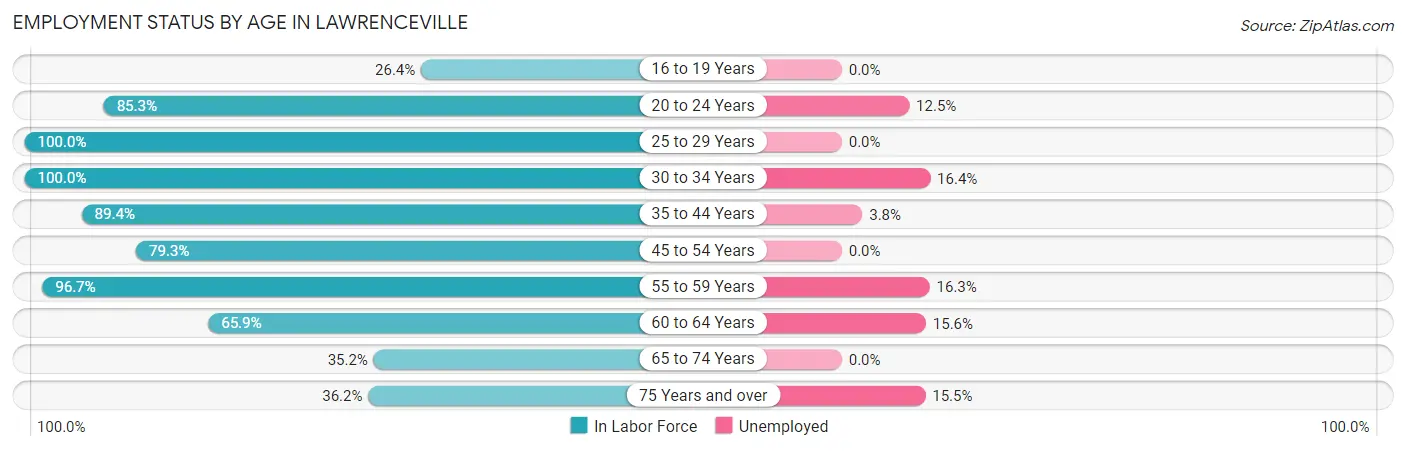
| Age Bracket | In Labor Force | Unemployed |
| 16 to 19 Years | 33 (26.4%) | 0 (0.0%) |
| 20 to 24 Years | 128 (85.3%) | 16 (12.5%) |
| 25 to 29 Years | 175 (100.0%) | 0 (0.0%) |
| 30 to 34 Years | 110 (100.0%) | 18 (16.4%) |
| 35 to 44 Years | 549 (89.4%) | 21 (3.8%) |
| 45 to 54 Years | 268 (79.3%) | 0 (0.0%) |
| 55 to 59 Years | 202 (96.7%) | 33 (16.3%) |
| 60 to 64 Years | 321 (65.9%) | 50 (15.6%) |
| 65 to 74 Years | 230 (35.2%) | 0 (0.0%) |
| 75 Years and over | 97 (36.2%) | 15 (15.5%) |
| Total | 2,113 (67.5%) | 152 (7.2%) |
Employment Status by Educational Attainment in Lawrenceville
According to labor force statistics for Lawrenceville, 84.1% of individuals (1,626) out of the total population between 25 and 64 years of age (1,933) are in the labor force, with 7.5% or 122 of them being unemployed. The group with the highest labor force participation rate are those with the educational attainment of high school diploma, with 91.1% or 174 individuals in the labor force. Within the labor force, individuals with high school diploma education have the highest percentage of unemployment, with 21.3% or 37 of them being unemployed.
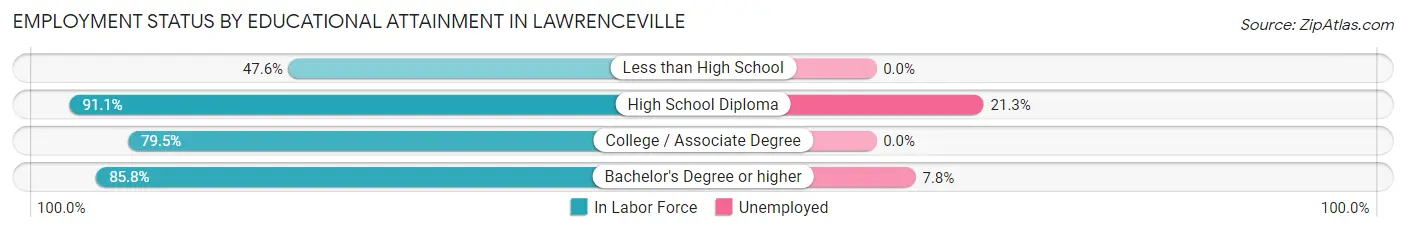
| Educational Attainment | In Labor Force | Unemployed |
| Less than High School | 20 (47.6%) | 0 (0.0%) |
| High School Diploma | 174 (91.1%) | 41 (21.3%) |
| College / Associate Degree | 346 (79.5%) | 0 (0.0%) |
| Bachelor's Degree or higher | 1,085 (85.8%) | 99 (7.8%) |
| Total | 1,626 (84.1%) | 145 (7.5%) |
Employment Occupations by Sex in Lawrenceville
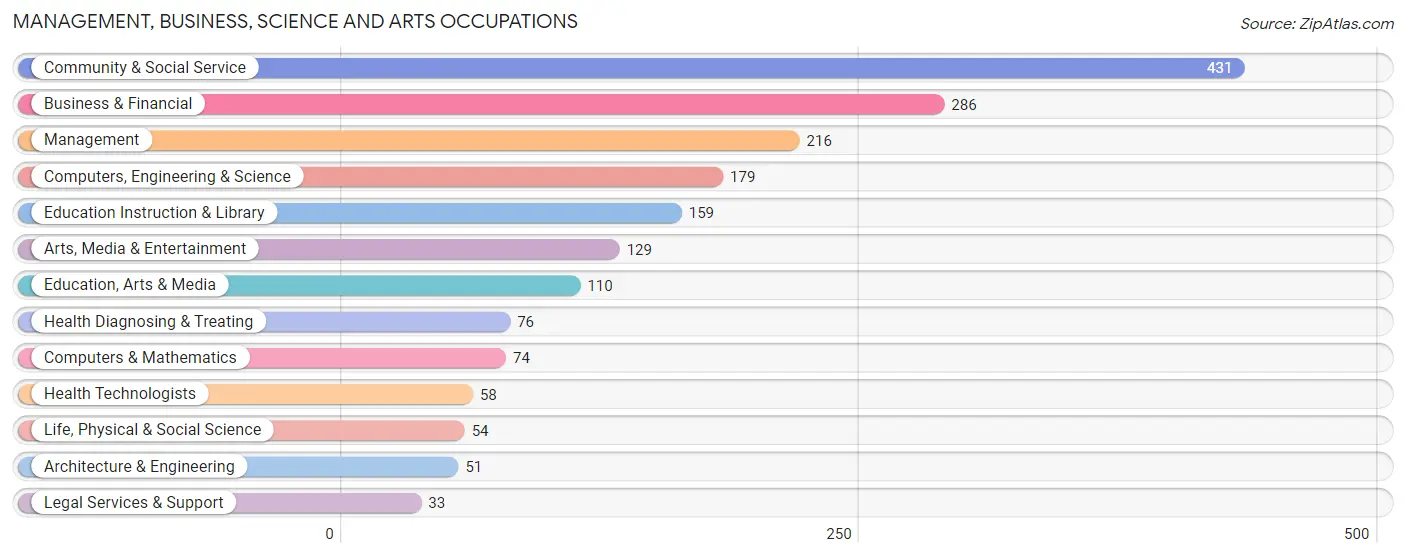
Management, Business, Science and Arts Occupations
The most common Management, Business, Science and Arts occupations in Lawrenceville are Community & Social Service (431 | 22.0%), Business & Financial (286 | 14.6%), Management (216 | 11.0%), Computers, Engineering & Science (179 | 9.1%), and Education Instruction & Library (159 | 8.1%).
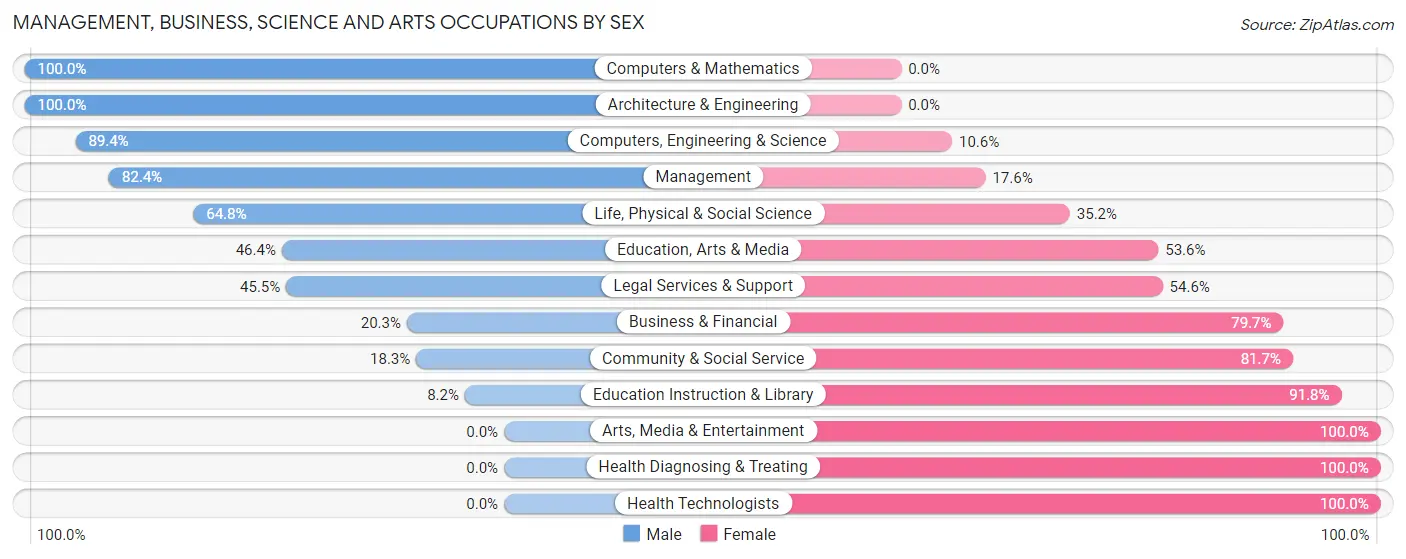
Management, Business, Science and Arts Occupations by Sex
Within the Management, Business, Science and Arts occupations in Lawrenceville, the most male-oriented occupations are Computers & Mathematics (100.0%), Architecture & Engineering (100.0%), and Computers, Engineering & Science (89.4%), while the most female-oriented occupations are Arts, Media & Entertainment (100.0%), Health Diagnosing & Treating (100.0%), and Health Technologists (100.0%).
| Occupation | Male | Female |
| Management | 178 (82.4%) | 38 (17.6%) |
| Business & Financial | 58 (20.3%) | 228 (79.7%) |
| Computers, Engineering & Science | 160 (89.4%) | 19 (10.6%) |
| Computers & Mathematics | 74 (100.0%) | 0 (0.0%) |
| Architecture & Engineering | 51 (100.0%) | 0 (0.0%) |
| Life, Physical & Social Science | 35 (64.8%) | 19 (35.2%) |
| Community & Social Service | 79 (18.3%) | 352 (81.7%) |
| Education, Arts & Media | 51 (46.4%) | 59 (53.6%) |
| Legal Services & Support | 15 (45.5%) | 18 (54.5%) |
| Education Instruction & Library | 13 (8.2%) | 146 (91.8%) |
| Arts, Media & Entertainment | 0 (0.0%) | 129 (100.0%) |
| Health Diagnosing & Treating | 0 (0.0%) | 76 (100.0%) |
| Health Technologists | 0 (0.0%) | 58 (100.0%) |
| Total (Category) | 475 (40.0%) | 713 (60.0%) |
| Total (Overall) | 829 (42.3%) | 1,131 (57.7%) |
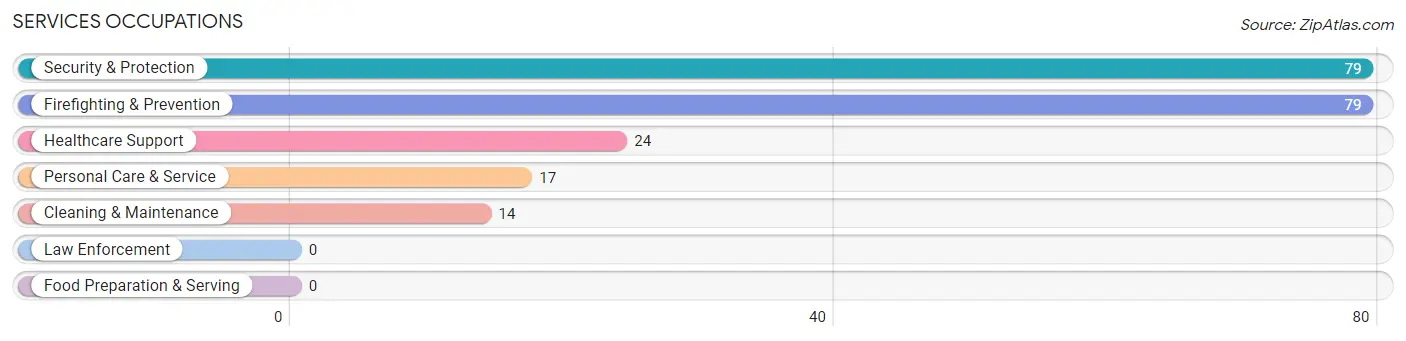
Services Occupations
The most common Services occupations in Lawrenceville are Security & Protection (79 | 4.0%), Firefighting & Prevention (79 | 4.0%), Healthcare Support (24 | 1.2%), Personal Care & Service (17 | 0.9%), and Cleaning & Maintenance (14 | 0.7%).
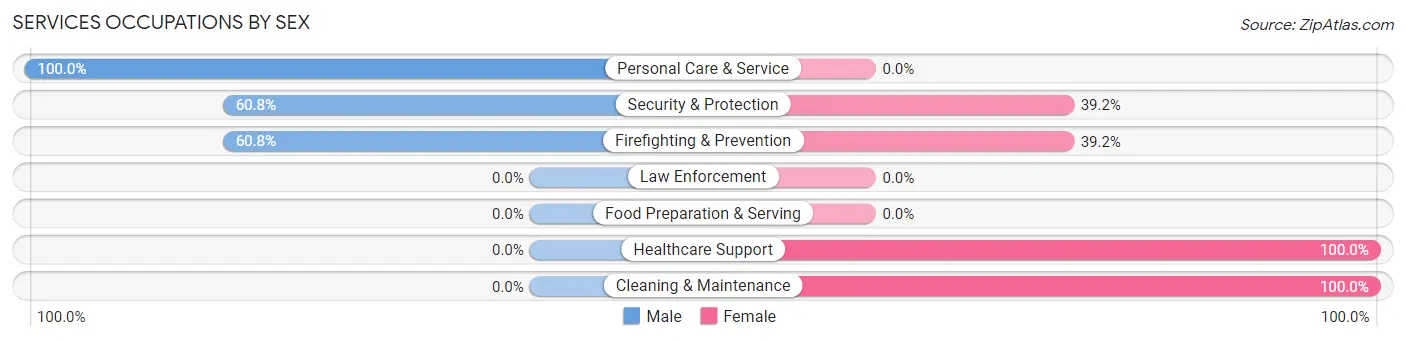
Services Occupations by Sex
Within the Services occupations in Lawrenceville, the most male-oriented occupations are Personal Care & Service (100.0%), Security & Protection (60.8%), and Firefighting & Prevention (60.8%), while the most female-oriented occupations are Healthcare Support (100.0%), Cleaning & Maintenance (100.0%), and Security & Protection (39.2%).
| Occupation | Male | Female |
| Healthcare Support | 0 (0.0%) | 24 (100.0%) |
| Security & Protection | 48 (60.8%) | 31 (39.2%) |
| Firefighting & Prevention | 48 (60.8%) | 31 (39.2%) |
| Law Enforcement | 0 (0.0%) | 0 (0.0%) |
| Food Preparation & Serving | 0 (0.0%) | 0 (0.0%) |
| Cleaning & Maintenance | 0 (0.0%) | 14 (100.0%) |
| Personal Care & Service | 17 (100.0%) | 0 (0.0%) |
| Total (Category) | 65 (48.5%) | 69 (51.5%) |
| Total (Overall) | 829 (42.3%) | 1,131 (57.7%) |
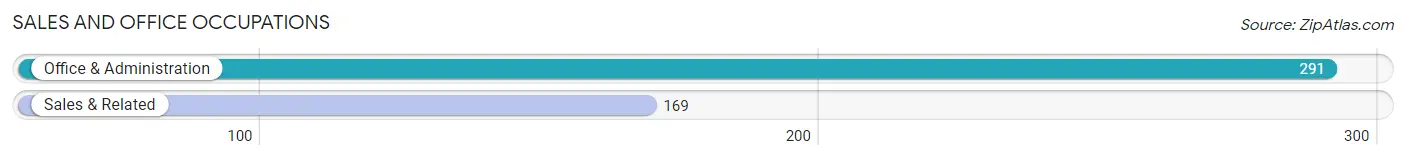
Sales and Office Occupations
The most common Sales and Office occupations in Lawrenceville are Office & Administration (291 | 14.8%), and Sales & Related (169 | 8.6%).
Sales and Office Occupations by Sex
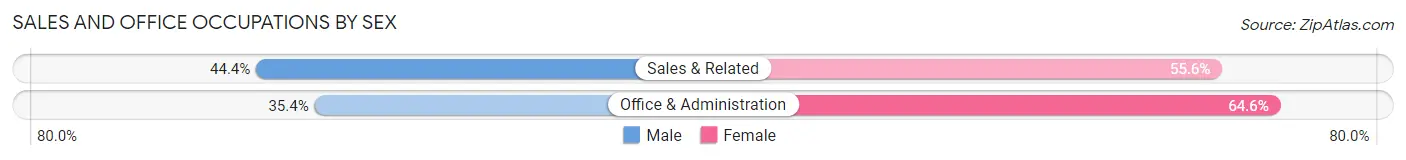
| Occupation | Male | Female |
| Sales & Related | 75 (44.4%) | 94 (55.6%) |
| Office & Administration | 103 (35.4%) | 188 (64.6%) |
| Total (Category) | 178 (38.7%) | 282 (61.3%) |
| Total (Overall) | 829 (42.3%) | 1,131 (57.7%) |
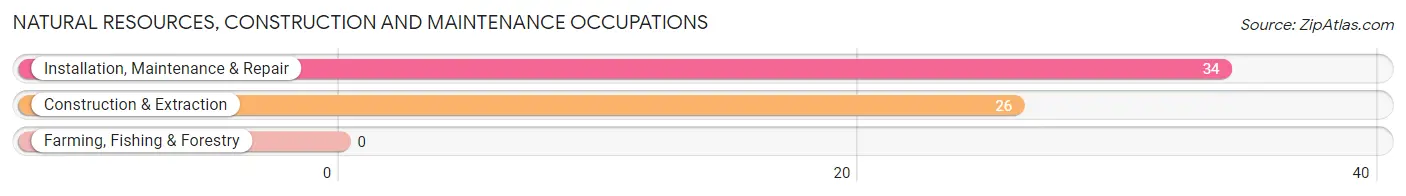
Natural Resources, Construction and Maintenance Occupations
The most common Natural Resources, Construction and Maintenance occupations in Lawrenceville are Installation, Maintenance & Repair (34 | 1.7%), and Construction & Extraction (26 | 1.3%).
Natural Resources, Construction and Maintenance Occupations by Sex
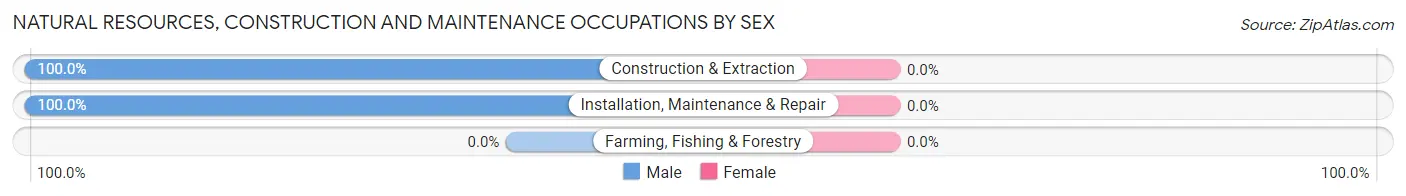
| Occupation | Male | Female |
| Farming, Fishing & Forestry | 0 (0.0%) | 0 (0.0%) |
| Construction & Extraction | 26 (100.0%) | 0 (0.0%) |
| Installation, Maintenance & Repair | 34 (100.0%) | 0 (0.0%) |
| Total (Category) | 60 (100.0%) | 0 (0.0%) |
| Total (Overall) | 829 (42.3%) | 1,131 (57.7%) |
Production, Transportation and Moving Occupations
The most common Production, Transportation and Moving occupations in Lawrenceville are Transportation (43 | 2.2%), Material Moving (42 | 2.1%), and Production (33 | 1.7%).
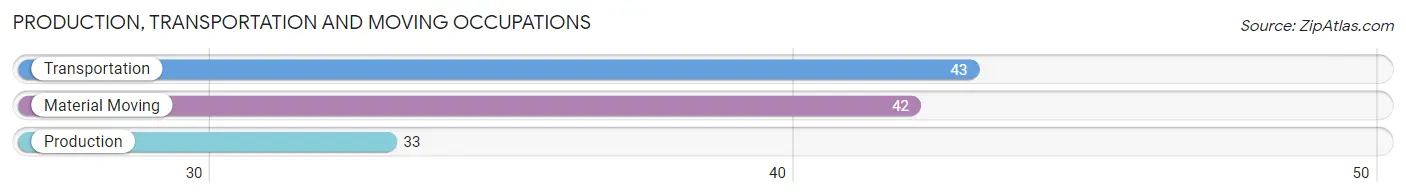
Production, Transportation and Moving Occupations by Sex
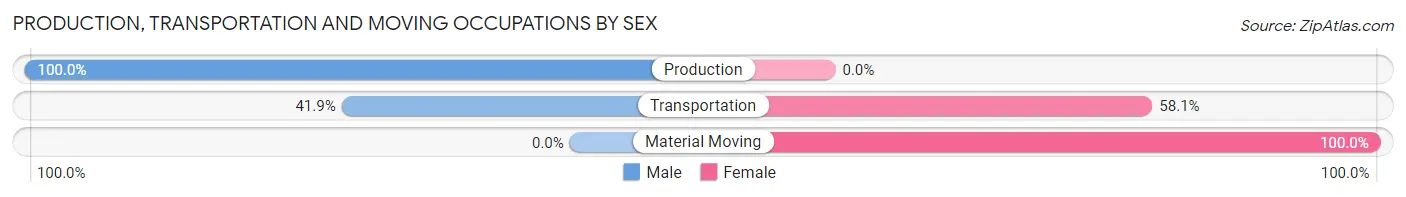
| Occupation | Male | Female |
| Production | 33 (100.0%) | 0 (0.0%) |
| Transportation | 18 (41.9%) | 25 (58.1%) |
| Material Moving | 0 (0.0%) | 42 (100.0%) |
| Total (Category) | 51 (43.2%) | 67 (56.8%) |
| Total (Overall) | 829 (42.3%) | 1,131 (57.7%) |
Employment Industries by Sex in Lawrenceville
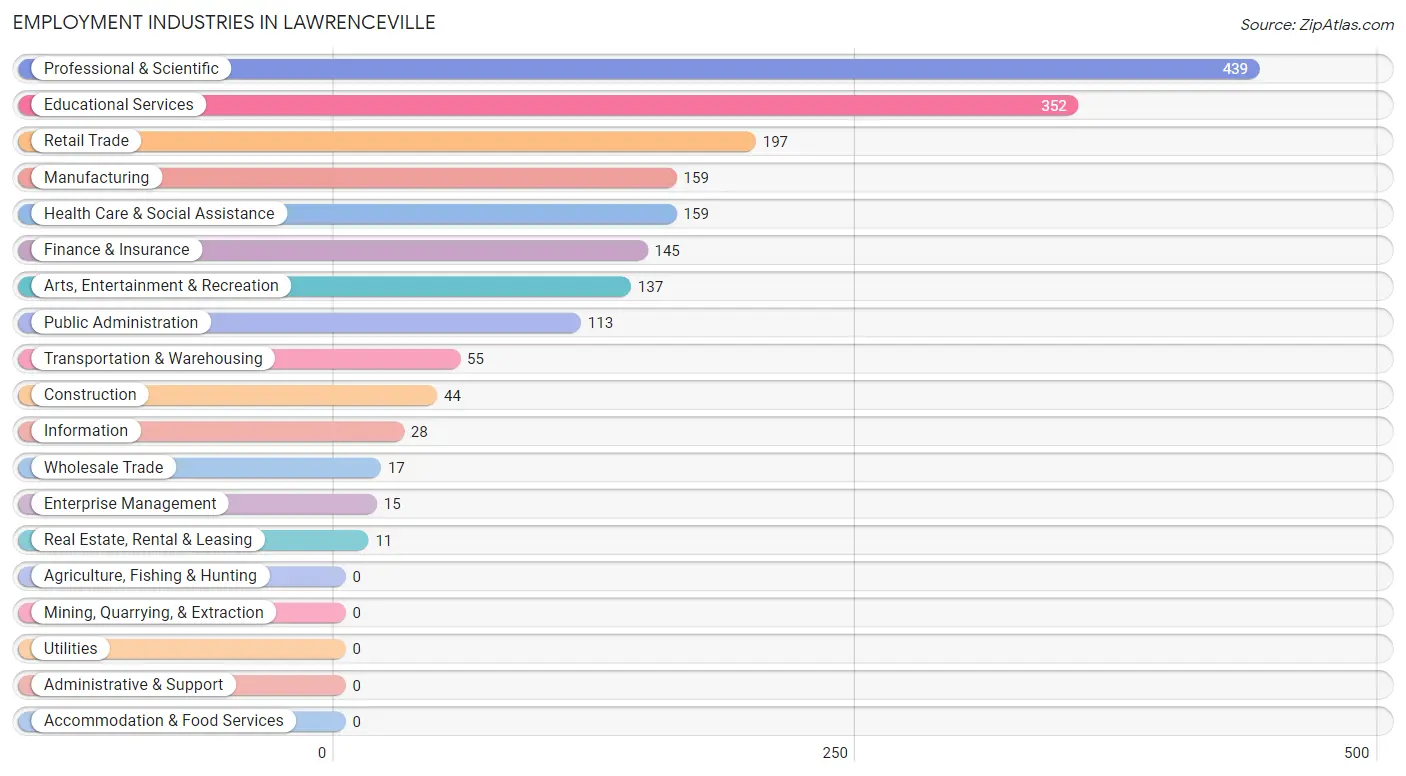
Employment Industries in Lawrenceville
The major employment industries in Lawrenceville include Professional & Scientific (439 | 22.4%), Educational Services (352 | 18.0%), Retail Trade (197 | 10.1%), Manufacturing (159 | 8.1%), and Health Care & Social Assistance (159 | 8.1%).
Employment Industries by Sex in Lawrenceville
The Lawrenceville industries that see more men than women are Construction (100.0%), Wholesale Trade (100.0%), and Information (100.0%), whereas the industries that tend to have a higher number of women are Retail Trade (87.8%), Health Care & Social Assistance (79.9%), and Educational Services (74.7%).
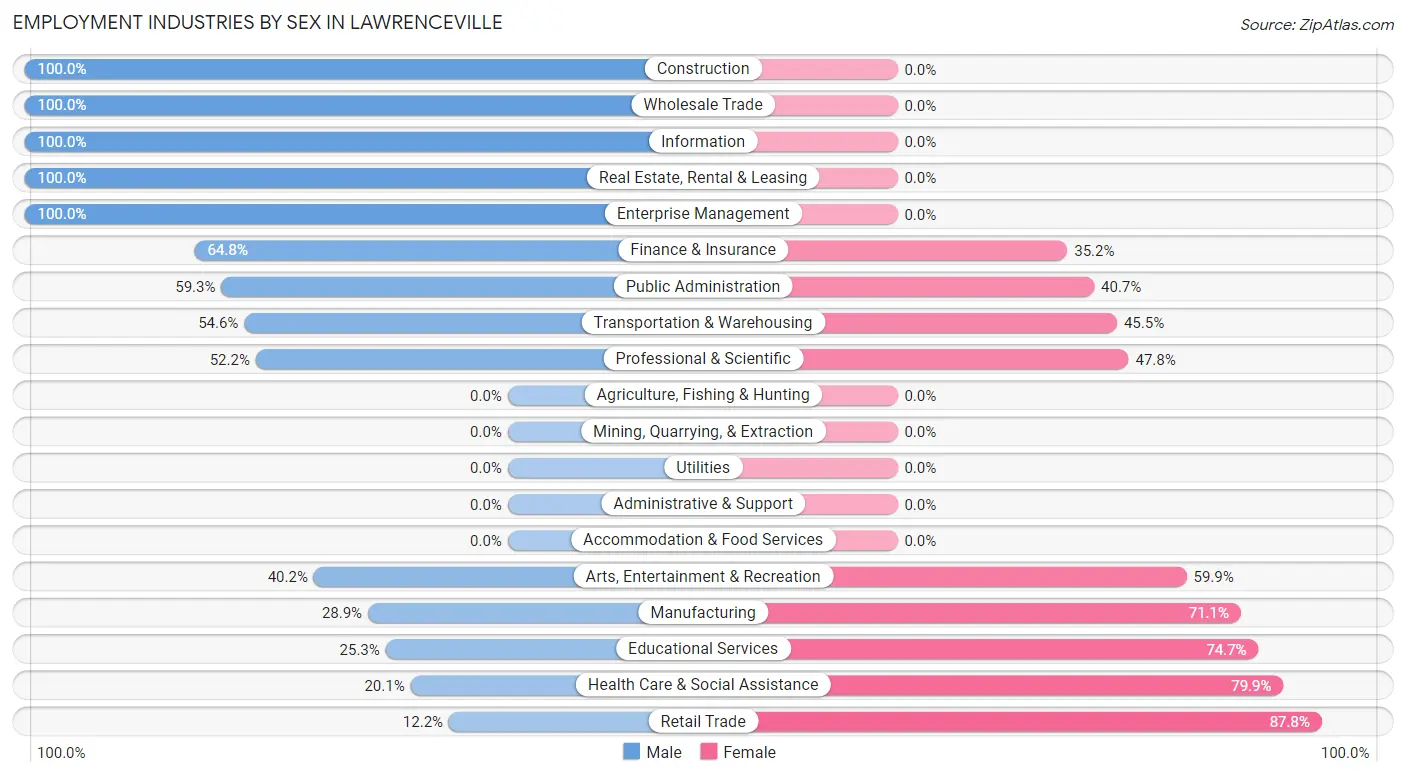
| Industry | Male | Female |
| Agriculture, Fishing & Hunting | 0 (0.0%) | 0 (0.0%) |
| Mining, Quarrying, & Extraction | 0 (0.0%) | 0 (0.0%) |
| Construction | 44 (100.0%) | 0 (0.0%) |
| Manufacturing | 46 (28.9%) | 113 (71.1%) |
| Wholesale Trade | 17 (100.0%) | 0 (0.0%) |
| Retail Trade | 24 (12.2%) | 173 (87.8%) |
| Transportation & Warehousing | 30 (54.5%) | 25 (45.5%) |
| Utilities | 0 (0.0%) | 0 (0.0%) |
| Information | 28 (100.0%) | 0 (0.0%) |
| Finance & Insurance | 94 (64.8%) | 51 (35.2%) |
| Real Estate, Rental & Leasing | 11 (100.0%) | 0 (0.0%) |
| Professional & Scientific | 229 (52.2%) | 210 (47.8%) |
| Enterprise Management | 15 (100.0%) | 0 (0.0%) |
| Administrative & Support | 0 (0.0%) | 0 (0.0%) |
| Educational Services | 89 (25.3%) | 263 (74.7%) |
| Health Care & Social Assistance | 32 (20.1%) | 127 (79.9%) |
| Arts, Entertainment & Recreation | 55 (40.2%) | 82 (59.9%) |
| Accommodation & Food Services | 0 (0.0%) | 0 (0.0%) |
| Public Administration | 67 (59.3%) | 46 (40.7%) |
| Total | 829 (42.3%) | 1,131 (57.7%) |
Education in Lawrenceville
School Enrollment in Lawrenceville
The most common levels of schooling among the 622 students in Lawrenceville are high school (155 | 24.9%), middle school (148 | 23.8%), and nursery / preschool (104 | 16.7%).
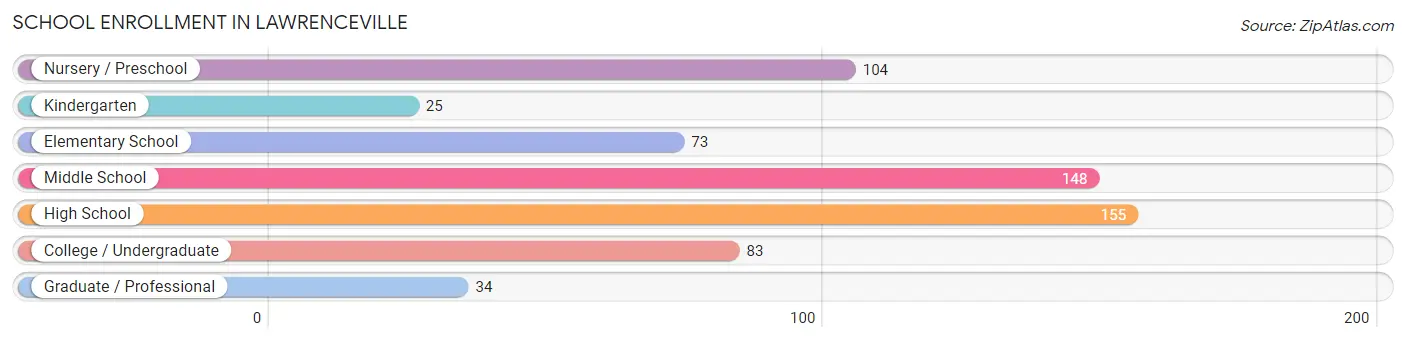
| School Level | # Students | % Students |
| Nursery / Preschool | 104 | 16.7% |
| Kindergarten | 25 | 4.0% |
| Elementary School | 73 | 11.7% |
| Middle School | 148 | 23.8% |
| High School | 155 | 24.9% |
| College / Undergraduate | 83 | 13.3% |
| Graduate / Professional | 34 | 5.5% |
| Total | 622 | 100.0% |
School Enrollment by Age by Funding Source in Lawrenceville
Out of a total of 622 students who are enrolled in schools in Lawrenceville, 258 (41.5%) attend a private institution, while the remaining 364 (58.5%) are enrolled in public schools. The age group of 20 to 24 year olds has the highest likelihood of being enrolled in private schools, with 42 (100.0% in the age bracket) enrolled. Conversely, the age group of 5 to 9 year old has the lowest likelihood of being enrolled in a private school, with 98 (100.0% in the age bracket) attending a public institution.
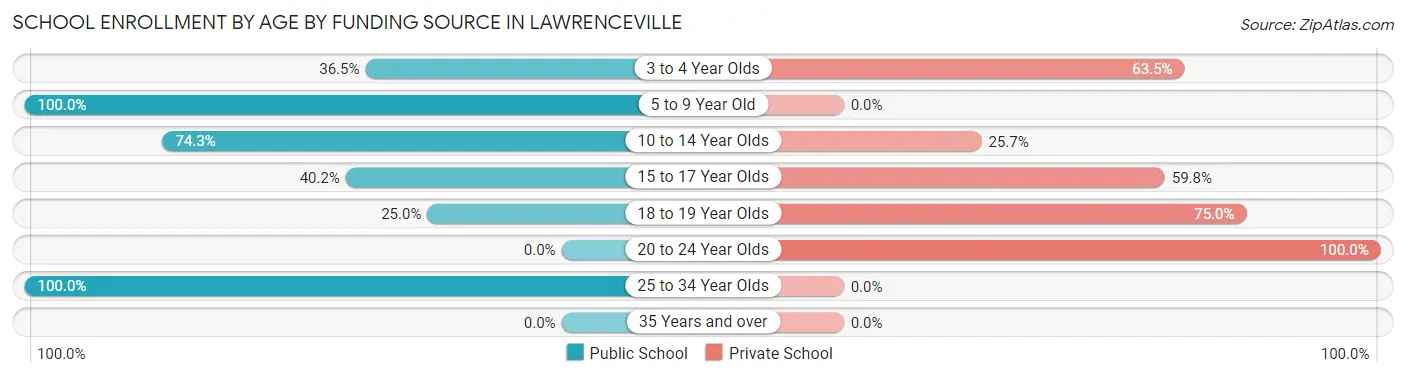
| Age Bracket | Public School | Private School |
| 3 to 4 Year Olds | 38 (36.5%) | 66 (63.5%) |
| 5 to 9 Year Old | 98 (100.0%) | 0 (0.0%) |
| 10 to 14 Year Olds | 110 (74.3%) | 38 (25.7%) |
| 15 to 17 Year Olds | 43 (40.2%) | 64 (59.8%) |
| 18 to 19 Year Olds | 16 (25.0%) | 48 (75.0%) |
| 20 to 24 Year Olds | 0 (0.0%) | 42 (100.0%) |
| 25 to 34 Year Olds | 59 (100.0%) | 0 (0.0%) |
| 35 Years and over | 0 (0.0%) | 0 (0.0%) |
| Total | 364 (58.5%) | 258 (41.5%) |
Educational Attainment by Field of Study in Lawrenceville
Business (277 | 12.9%), social sciences (270 | 12.6%), liberal arts & history (258 | 12.0%), education (219 | 10.2%), and engineering (193 | 9.0%) are the most common fields of study among 2,147 individuals in Lawrenceville who have obtained a bachelor's degree or higher.
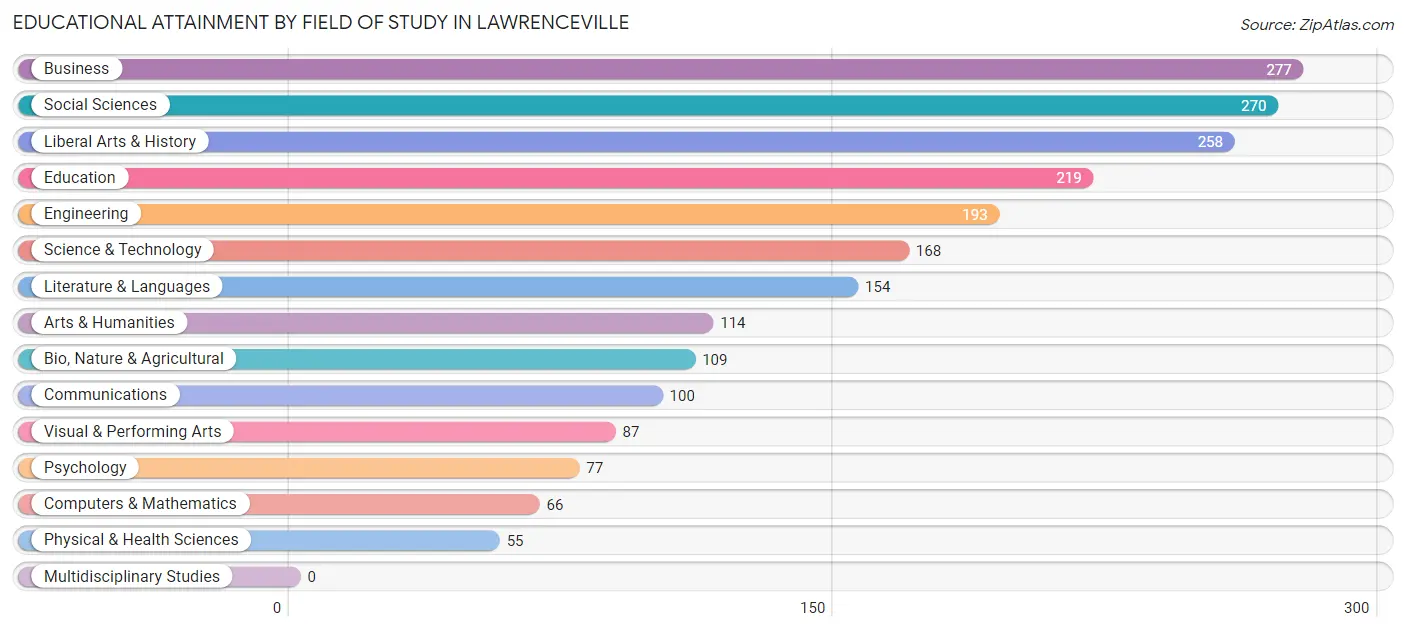
| Field of Study | # Graduates | % Graduates |
| Computers & Mathematics | 66 | 3.1% |
| Bio, Nature & Agricultural | 109 | 5.1% |
| Physical & Health Sciences | 55 | 2.6% |
| Psychology | 77 | 3.6% |
| Social Sciences | 270 | 12.6% |
| Engineering | 193 | 9.0% |
| Multidisciplinary Studies | 0 | 0.0% |
| Science & Technology | 168 | 7.8% |
| Business | 277 | 12.9% |
| Education | 219 | 10.2% |
| Literature & Languages | 154 | 7.2% |
| Liberal Arts & History | 258 | 12.0% |
| Visual & Performing Arts | 87 | 4.1% |
| Communications | 100 | 4.7% |
| Arts & Humanities | 114 | 5.3% |
| Total | 2,147 | 100.0% |
Transportation & Commute in Lawrenceville
Vehicle Availability by Sex in Lawrenceville
The most prevalent vehicle ownership categories in Lawrenceville are males with 2 vehicles (403, accounting for 49.7%) and females with 2 vehicles (471, making up 38.5%).
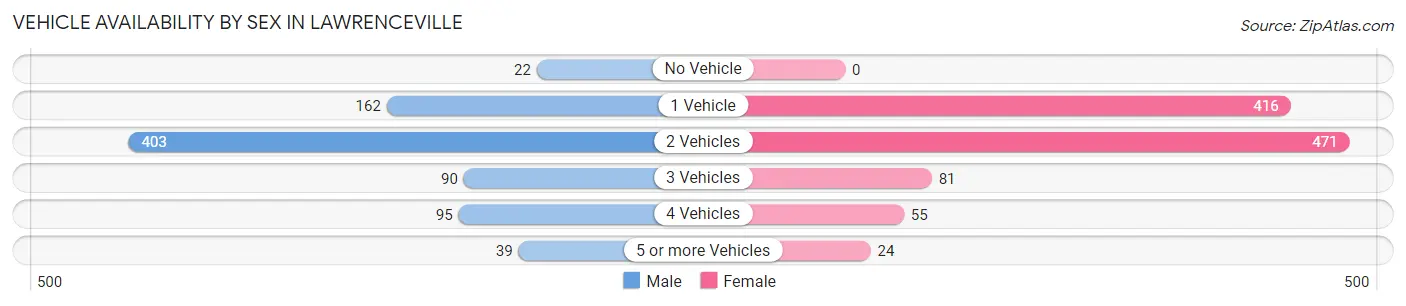
| Vehicles Available | Male | Female |
| No Vehicle | 22 (2.7%) | 0 (0.0%) |
| 1 Vehicle | 162 (20.0%) | 416 (39.7%) |
| 2 Vehicles | 403 (49.7%) | 471 (45.0%) |
| 3 Vehicles | 90 (11.1%) | 81 (7.7%) |
| 4 Vehicles | 95 (11.7%) | 55 (5.2%) |
| 5 or more Vehicles | 39 (4.8%) | 24 (2.3%) |
| Total | 811 (100.0%) | 1,047 (100.0%) |
Commute Time in Lawrenceville
The most frequently occuring commute durations in Lawrenceville are 15 to 19 minutes (238 commuters, 17.7%), 20 to 24 minutes (220 commuters, 16.3%), and 10 to 14 minutes (150 commuters, 11.1%).
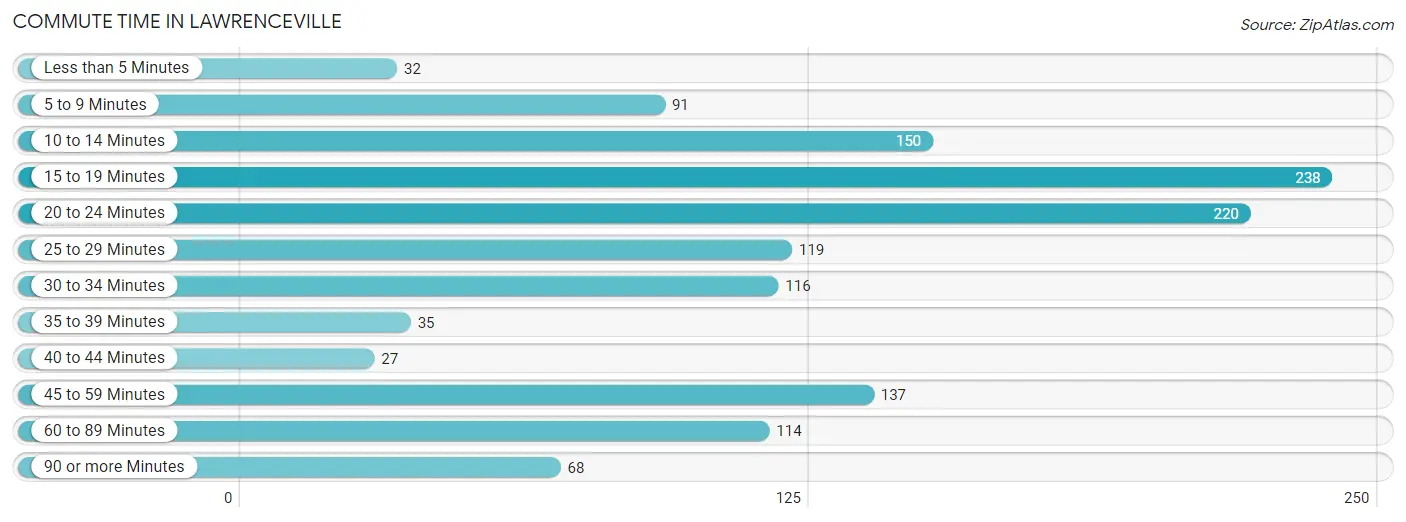
| Commute Time | # Commuters | % Commuters |
| Less than 5 Minutes | 32 | 2.4% |
| 5 to 9 Minutes | 91 | 6.8% |
| 10 to 14 Minutes | 150 | 11.1% |
| 15 to 19 Minutes | 238 | 17.7% |
| 20 to 24 Minutes | 220 | 16.3% |
| 25 to 29 Minutes | 119 | 8.8% |
| 30 to 34 Minutes | 116 | 8.6% |
| 35 to 39 Minutes | 35 | 2.6% |
| 40 to 44 Minutes | 27 | 2.0% |
| 45 to 59 Minutes | 137 | 10.2% |
| 60 to 89 Minutes | 114 | 8.5% |
| 90 or more Minutes | 68 | 5.1% |
Commute Time by Sex in Lawrenceville
The most common commute times in Lawrenceville are 20 to 24 minutes (110 commuters, 19.9%) for males and 15 to 19 minutes (147 commuters, 18.5%) for females.
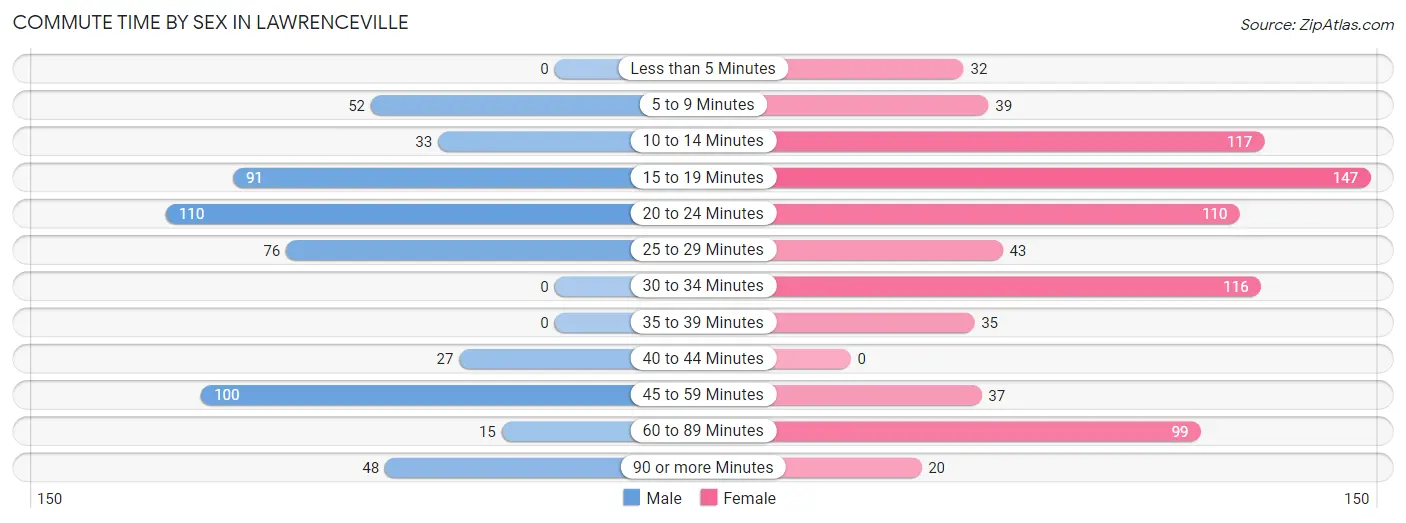
| Commute Time | Male | Female |
| Less than 5 Minutes | 0 (0.0%) | 32 (4.0%) |
| 5 to 9 Minutes | 52 (9.4%) | 39 (4.9%) |
| 10 to 14 Minutes | 33 (6.0%) | 117 (14.7%) |
| 15 to 19 Minutes | 91 (16.5%) | 147 (18.5%) |
| 20 to 24 Minutes | 110 (19.9%) | 110 (13.8%) |
| 25 to 29 Minutes | 76 (13.8%) | 43 (5.4%) |
| 30 to 34 Minutes | 0 (0.0%) | 116 (14.6%) |
| 35 to 39 Minutes | 0 (0.0%) | 35 (4.4%) |
| 40 to 44 Minutes | 27 (4.9%) | 0 (0.0%) |
| 45 to 59 Minutes | 100 (18.1%) | 37 (4.6%) |
| 60 to 89 Minutes | 15 (2.7%) | 99 (12.4%) |
| 90 or more Minutes | 48 (8.7%) | 20 (2.5%) |
Time of Departure to Work by Sex in Lawrenceville
The most frequent times of departure to work in Lawrenceville are 8:00 AM to 8:29 AM (113, 20.5%) for males and 7:30 AM to 7:59 AM (175, 22.0%) for females.
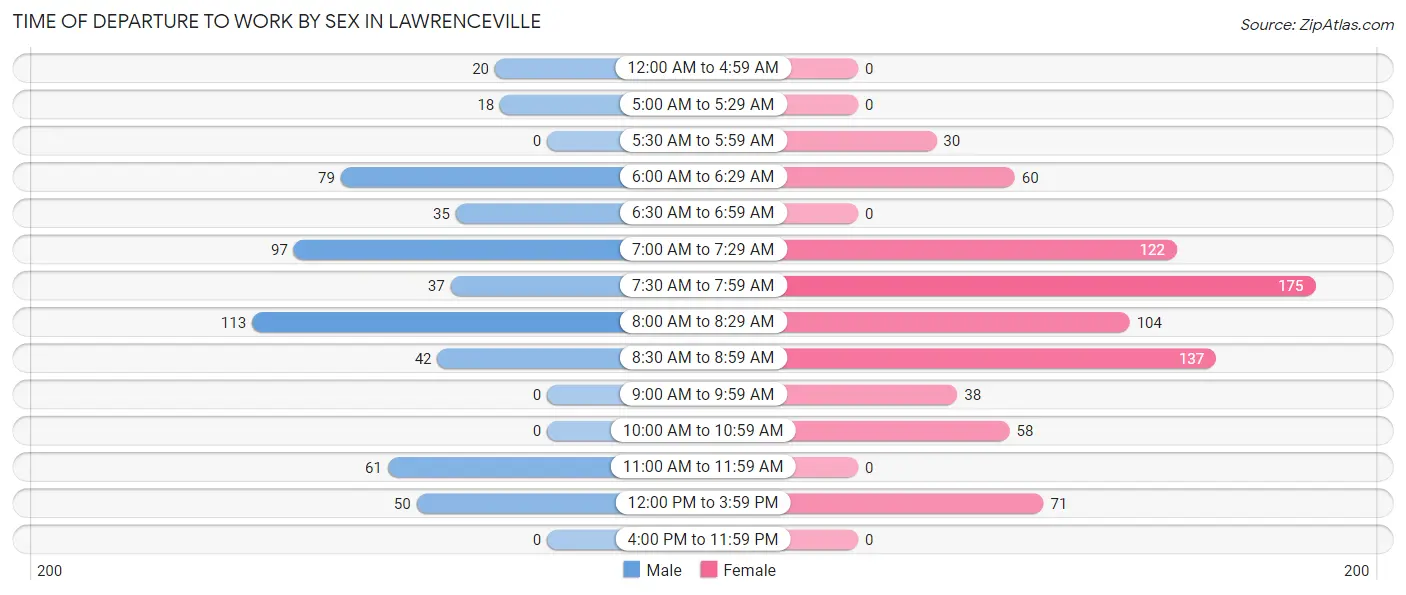
| Time of Departure | Male | Female |
| 12:00 AM to 4:59 AM | 20 (3.6%) | 0 (0.0%) |
| 5:00 AM to 5:29 AM | 18 (3.3%) | 0 (0.0%) |
| 5:30 AM to 5:59 AM | 0 (0.0%) | 30 (3.8%) |
| 6:00 AM to 6:29 AM | 79 (14.3%) | 60 (7.5%) |
| 6:30 AM to 6:59 AM | 35 (6.3%) | 0 (0.0%) |
| 7:00 AM to 7:29 AM | 97 (17.6%) | 122 (15.3%) |
| 7:30 AM to 7:59 AM | 37 (6.7%) | 175 (22.0%) |
| 8:00 AM to 8:29 AM | 113 (20.5%) | 104 (13.1%) |
| 8:30 AM to 8:59 AM | 42 (7.6%) | 137 (17.2%) |
| 9:00 AM to 9:59 AM | 0 (0.0%) | 38 (4.8%) |
| 10:00 AM to 10:59 AM | 0 (0.0%) | 58 (7.3%) |
| 11:00 AM to 11:59 AM | 61 (11.1%) | 0 (0.0%) |
| 12:00 PM to 3:59 PM | 50 (9.1%) | 71 (8.9%) |
| 4:00 PM to 11:59 PM | 0 (0.0%) | 0 (0.0%) |
| Total | 552 (100.0%) | 795 (100.0%) |
Housing Occupancy in Lawrenceville
Occupancy by Ownership in Lawrenceville
Of the total 1,736 dwellings in Lawrenceville, owner-occupied units account for 1,498 (86.3%), while renter-occupied units make up 238 (13.7%).
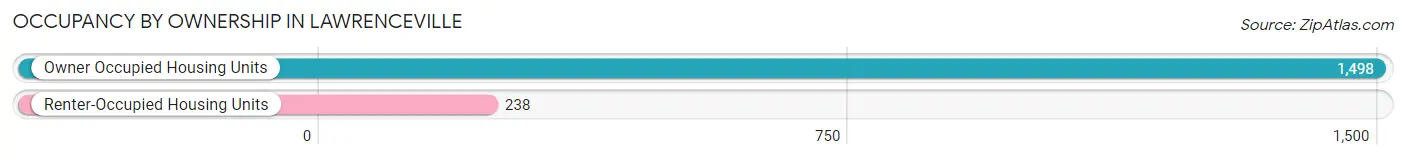
| Occupancy | # Housing Units | % Housing Units |
| Owner Occupied Housing Units | 1,498 | 86.3% |
| Renter-Occupied Housing Units | 238 | 13.7% |
| Total Occupied Housing Units | 1,736 | 100.0% |
Occupancy by Household Size in Lawrenceville
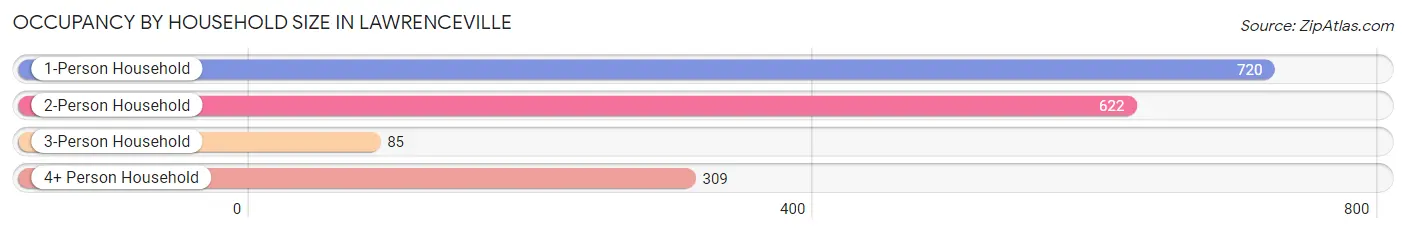
| Household Size | # Housing Units | % Housing Units |
| 1-Person Household | 720 | 41.5% |
| 2-Person Household | 622 | 35.8% |
| 3-Person Household | 85 | 4.9% |
| 4+ Person Household | 309 | 17.8% |
| Total Housing Units | 1,736 | 100.0% |
Occupancy by Ownership by Household Size in Lawrenceville
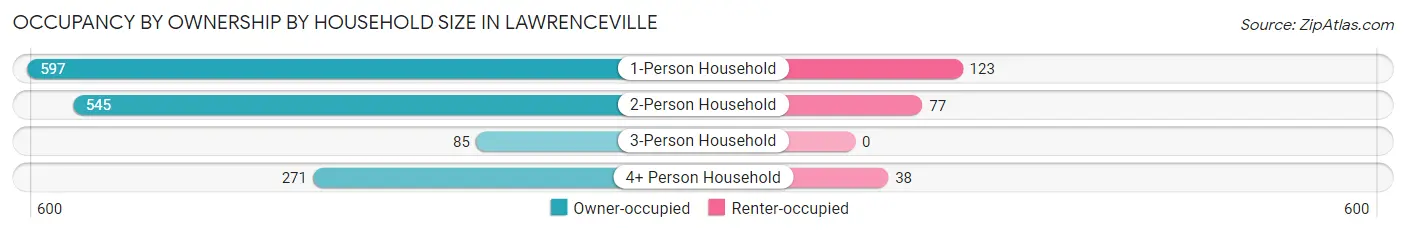
| Household Size | Owner-occupied | Renter-occupied |
| 1-Person Household | 597 (82.9%) | 123 (17.1%) |
| 2-Person Household | 545 (87.6%) | 77 (12.4%) |
| 3-Person Household | 85 (100.0%) | 0 (0.0%) |
| 4+ Person Household | 271 (87.7%) | 38 (12.3%) |
| Total Housing Units | 1,498 (86.3%) | 238 (13.7%) |
Occupancy by Educational Attainment in Lawrenceville
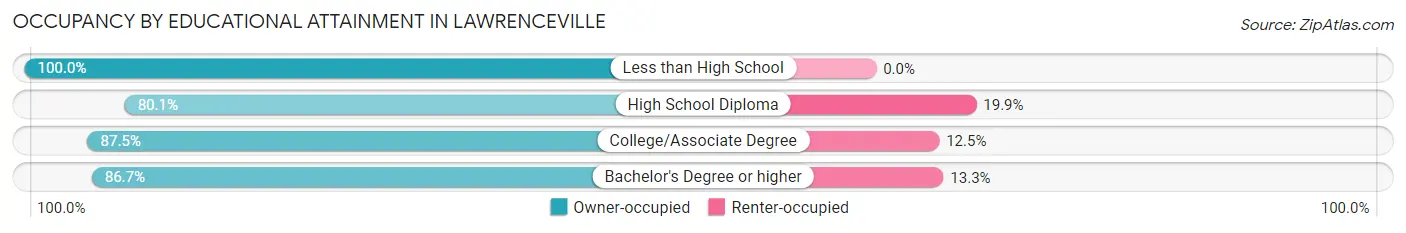
| Household Size | Owner-occupied | Renter-occupied |
| Less than High School | 6 (100.0%) | 0 (0.0%) |
| High School Diploma | 117 (80.1%) | 29 (19.9%) |
| College/Associate Degree | 231 (87.5%) | 33 (12.5%) |
| Bachelor's Degree or higher | 1,144 (86.7%) | 176 (13.3%) |
Occupancy by Age of Householder in Lawrenceville
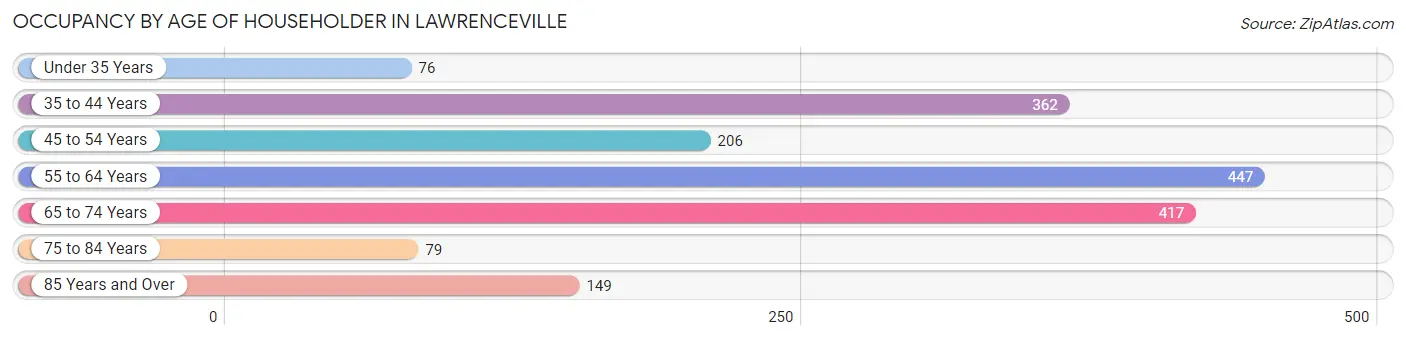
| Age Bracket | # Households | % Households |
| Under 35 Years | 76 | 4.4% |
| 35 to 44 Years | 362 | 20.8% |
| 45 to 54 Years | 206 | 11.9% |
| 55 to 64 Years | 447 | 25.8% |
| 65 to 74 Years | 417 | 24.0% |
| 75 to 84 Years | 79 | 4.5% |
| 85 Years and Over | 149 | 8.6% |
| Total | 1,736 | 100.0% |
Housing Finances in Lawrenceville
Median Income by Occupancy in Lawrenceville
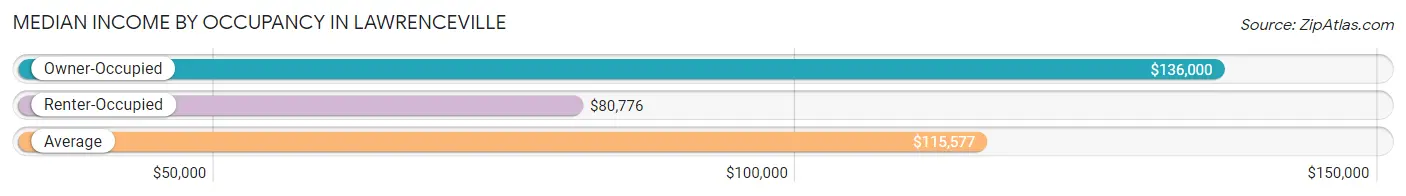
| Occupancy Type | # Households | Median Income |
| Owner-Occupied | 1,498 (86.3%) | $136,000 |
| Renter-Occupied | 238 (13.7%) | $80,776 |
| Average | 1,736 (100.0%) | $115,577 |
Occupancy by Householder Income Bracket in Lawrenceville
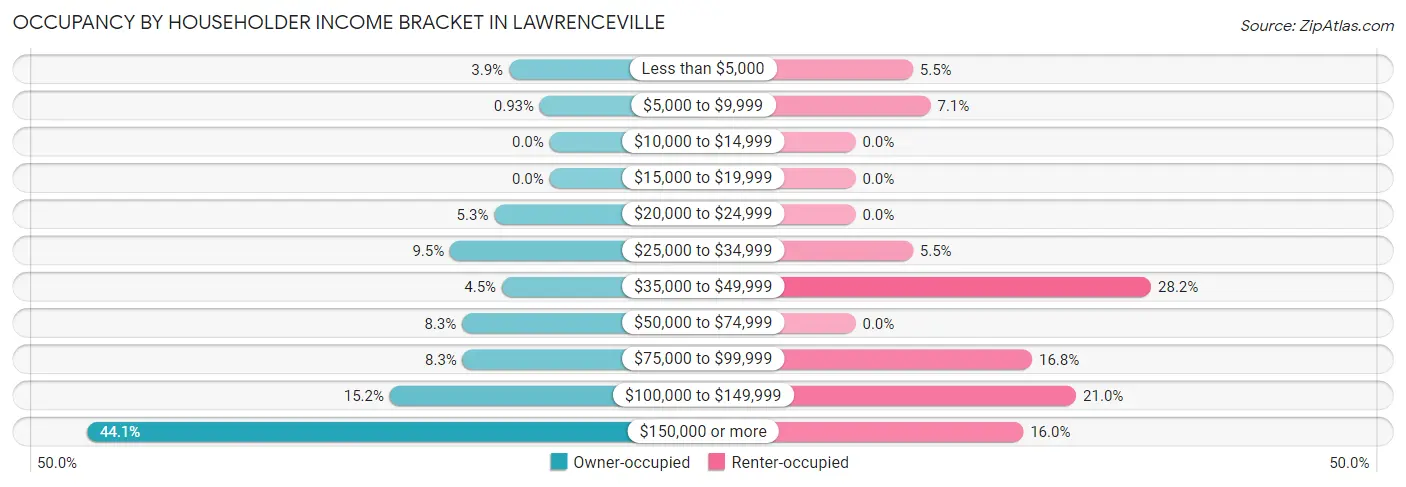
| Income Bracket | Owner-occupied | Renter-occupied |
| Less than $5,000 | 58 (3.9%) | 13 (5.5%) |
| $5,000 to $9,999 | 14 (0.9%) | 17 (7.1%) |
| $10,000 to $14,999 | 0 (0.0%) | 0 (0.0%) |
| $15,000 to $19,999 | 0 (0.0%) | 0 (0.0%) |
| $20,000 to $24,999 | 79 (5.3%) | 0 (0.0%) |
| $25,000 to $34,999 | 142 (9.5%) | 13 (5.5%) |
| $35,000 to $49,999 | 68 (4.5%) | 67 (28.1%) |
| $50,000 to $74,999 | 125 (8.3%) | 0 (0.0%) |
| $75,000 to $99,999 | 124 (8.3%) | 40 (16.8%) |
| $100,000 to $149,999 | 228 (15.2%) | 50 (21.0%) |
| $150,000 or more | 660 (44.1%) | 38 (16.0%) |
| Total | 1,498 (100.0%) | 238 (100.0%) |
Monthly Housing Cost Tiers in Lawrenceville
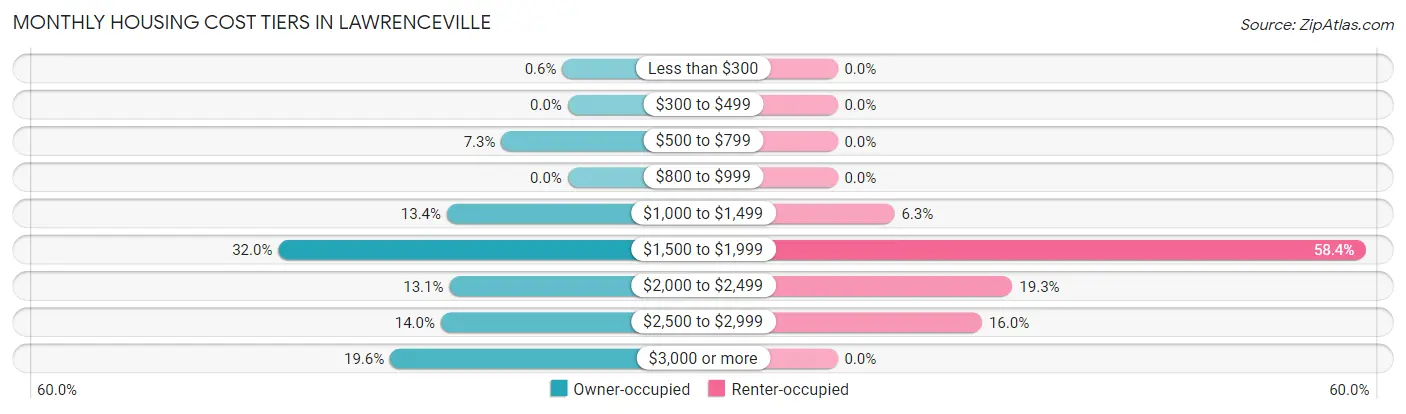
| Monthly Cost | Owner-occupied | Renter-occupied |
| Less than $300 | 9 (0.6%) | 0 (0.0%) |
| $300 to $499 | 0 (0.0%) | 0 (0.0%) |
| $500 to $799 | 110 (7.3%) | 0 (0.0%) |
| $800 to $999 | 0 (0.0%) | 0 (0.0%) |
| $1,000 to $1,499 | 200 (13.4%) | 15 (6.3%) |
| $1,500 to $1,999 | 479 (32.0%) | 139 (58.4%) |
| $2,000 to $2,499 | 196 (13.1%) | 46 (19.3%) |
| $2,500 to $2,999 | 210 (14.0%) | 38 (16.0%) |
| $3,000 or more | 294 (19.6%) | 0 (0.0%) |
| Total | 1,498 (100.0%) | 238 (100.0%) |
Physical Housing Characteristics in Lawrenceville
Housing Structures in Lawrenceville
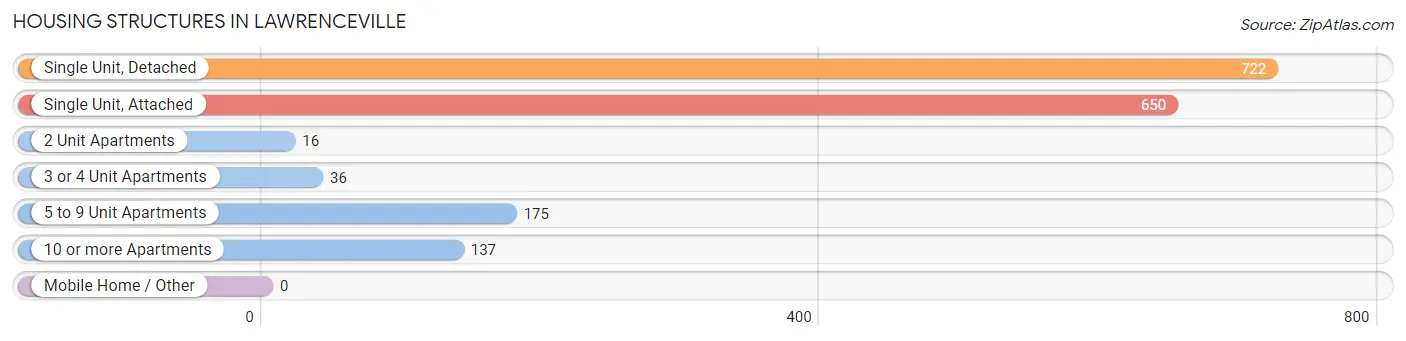
| Structure Type | # Housing Units | % Housing Units |
| Single Unit, Detached | 722 | 41.6% |
| Single Unit, Attached | 650 | 37.4% |
| 2 Unit Apartments | 16 | 0.9% |
| 3 or 4 Unit Apartments | 36 | 2.1% |
| 5 to 9 Unit Apartments | 175 | 10.1% |
| 10 or more Apartments | 137 | 7.9% |
| Mobile Home / Other | 0 | 0.0% |
| Total | 1,736 | 100.0% |
Housing Structures by Occupancy in Lawrenceville
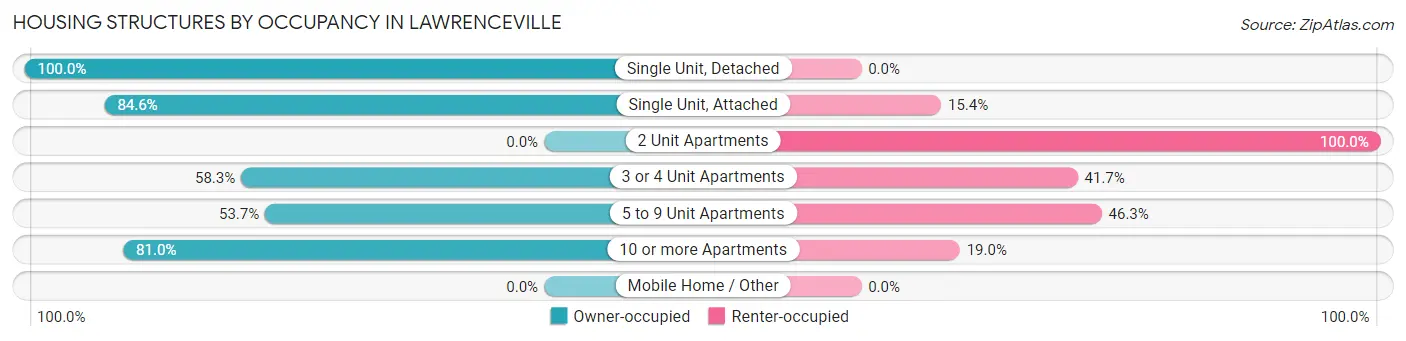
| Structure Type | Owner-occupied | Renter-occupied |
| Single Unit, Detached | 722 (100.0%) | 0 (0.0%) |
| Single Unit, Attached | 550 (84.6%) | 100 (15.4%) |
| 2 Unit Apartments | 0 (0.0%) | 16 (100.0%) |
| 3 or 4 Unit Apartments | 21 (58.3%) | 15 (41.7%) |
| 5 to 9 Unit Apartments | 94 (53.7%) | 81 (46.3%) |
| 10 or more Apartments | 111 (81.0%) | 26 (19.0%) |
| Mobile Home / Other | 0 (0.0%) | 0 (0.0%) |
| Total | 1,498 (86.3%) | 238 (13.7%) |
Housing Structures by Number of Rooms in Lawrenceville
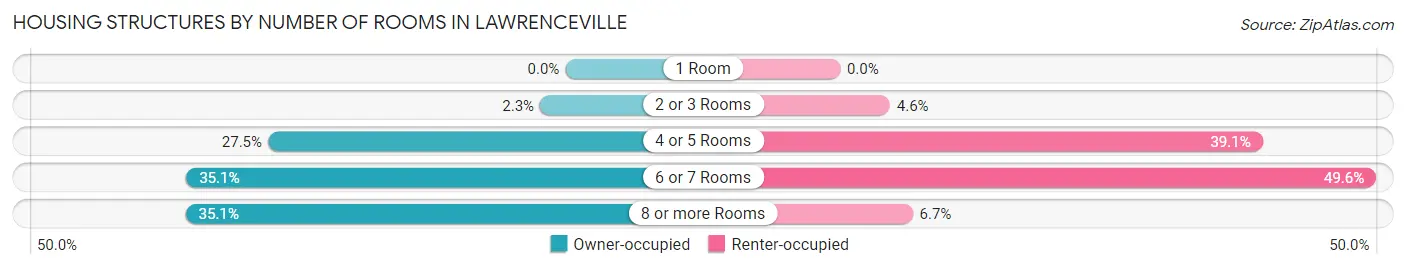
| Number of Rooms | Owner-occupied | Renter-occupied |
| 1 Room | 0 (0.0%) | 0 (0.0%) |
| 2 or 3 Rooms | 35 (2.3%) | 11 (4.6%) |
| 4 or 5 Rooms | 412 (27.5%) | 93 (39.1%) |
| 6 or 7 Rooms | 525 (35.0%) | 118 (49.6%) |
| 8 or more Rooms | 526 (35.1%) | 16 (6.7%) |
| Total | 1,498 (100.0%) | 238 (100.0%) |
Housing Structure by Heating Type in Lawrenceville
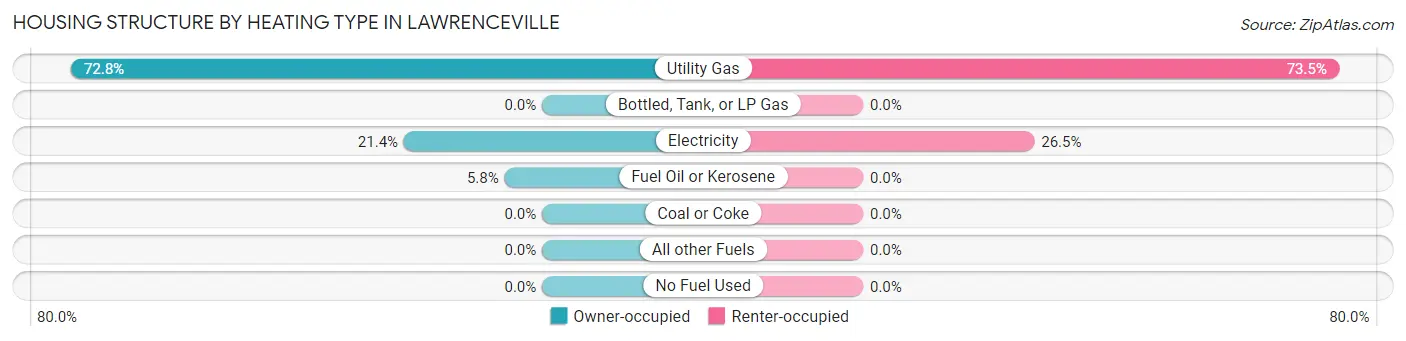
| Heating Type | Owner-occupied | Renter-occupied |
| Utility Gas | 1,091 (72.8%) | 175 (73.5%) |
| Bottled, Tank, or LP Gas | 0 (0.0%) | 0 (0.0%) |
| Electricity | 320 (21.4%) | 63 (26.5%) |
| Fuel Oil or Kerosene | 87 (5.8%) | 0 (0.0%) |
| Coal or Coke | 0 (0.0%) | 0 (0.0%) |
| All other Fuels | 0 (0.0%) | 0 (0.0%) |
| No Fuel Used | 0 (0.0%) | 0 (0.0%) |
| Total | 1,498 (100.0%) | 238 (100.0%) |
Household Vehicle Usage in Lawrenceville
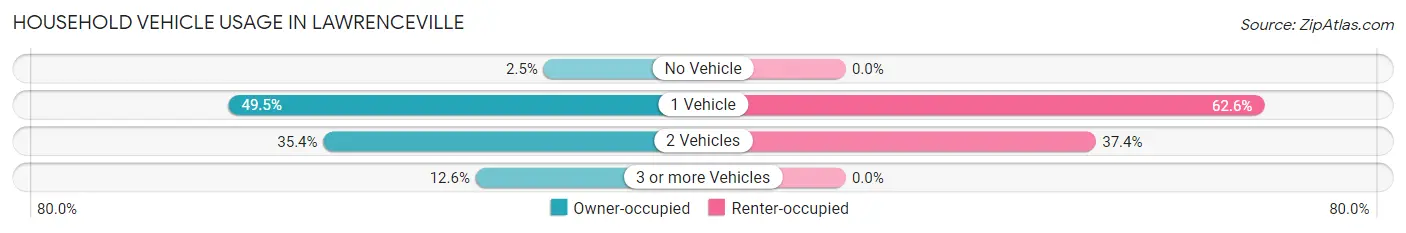
| Vehicles per Household | Owner-occupied | Renter-occupied |
| No Vehicle | 37 (2.5%) | 0 (0.0%) |
| 1 Vehicle | 742 (49.5%) | 149 (62.6%) |
| 2 Vehicles | 530 (35.4%) | 89 (37.4%) |
| 3 or more Vehicles | 189 (12.6%) | 0 (0.0%) |
| Total | 1,498 (100.0%) | 238 (100.0%) |
Real Estate & Mortgages in Lawrenceville
Real Estate and Mortgage Overview in Lawrenceville
| Characteristic | Without Mortgage | With Mortgage |
| Housing Units | 490 | 1,008 |
| Median Property Value | $531,400 | $292,800 |
| Median Household Income | $135,667 | $481 |
| Monthly Housing Costs | $1,439 | $294 |
| Real Estate Taxes | $10,001 | $0 |
Property Value by Mortgage Status in Lawrenceville
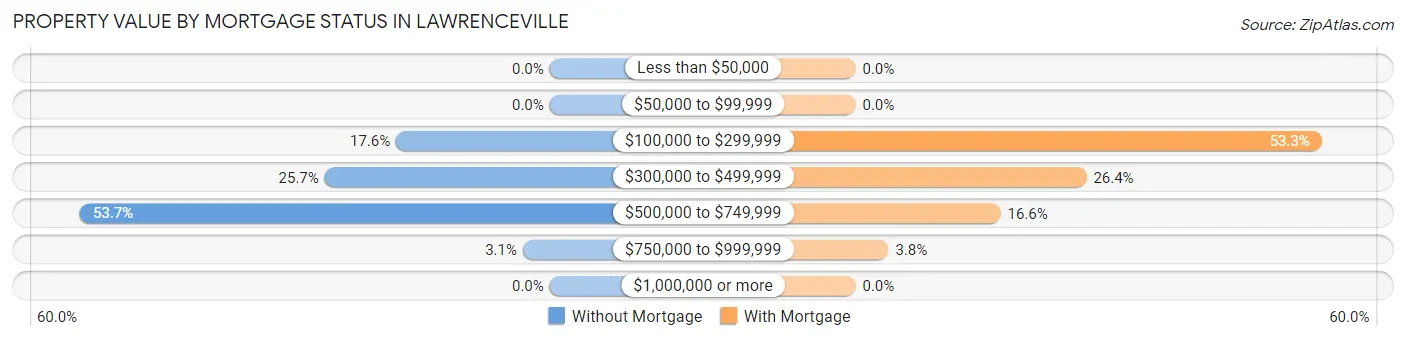
| Property Value | Without Mortgage | With Mortgage |
| Less than $50,000 | 0 (0.0%) | 0 (0.0%) |
| $50,000 to $99,999 | 0 (0.0%) | 0 (0.0%) |
| $100,000 to $299,999 | 86 (17.5%) | 537 (53.3%) |
| $300,000 to $499,999 | 126 (25.7%) | 266 (26.4%) |
| $500,000 to $749,999 | 263 (53.7%) | 167 (16.6%) |
| $750,000 to $999,999 | 15 (3.1%) | 38 (3.8%) |
| $1,000,000 or more | 0 (0.0%) | 0 (0.0%) |
| Total | 490 (100.0%) | 1,008 (100.0%) |
Household Income by Mortgage Status in Lawrenceville
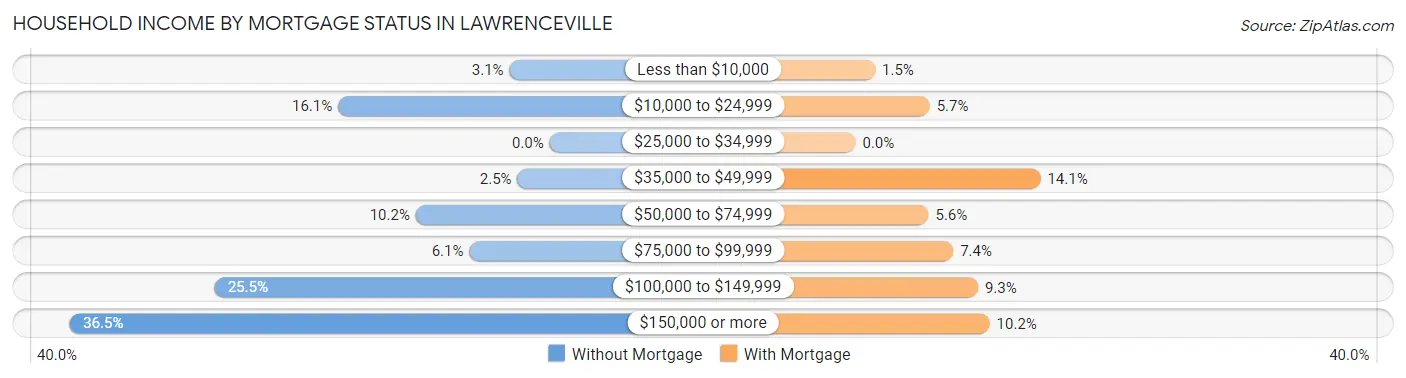
| Household Income | Without Mortgage | With Mortgage |
| Less than $10,000 | 15 (3.1%) | 15 (1.5%) |
| $10,000 to $24,999 | 79 (16.1%) | 57 (5.7%) |
| $25,000 to $34,999 | 0 (0.0%) | 0 (0.0%) |
| $35,000 to $49,999 | 12 (2.5%) | 142 (14.1%) |
| $50,000 to $74,999 | 50 (10.2%) | 56 (5.6%) |
| $75,000 to $99,999 | 30 (6.1%) | 75 (7.4%) |
| $100,000 to $149,999 | 125 (25.5%) | 94 (9.3%) |
| $150,000 or more | 179 (36.5%) | 103 (10.2%) |
| Total | 490 (100.0%) | 1,008 (100.0%) |
Property Value to Household Income Ratio in Lawrenceville
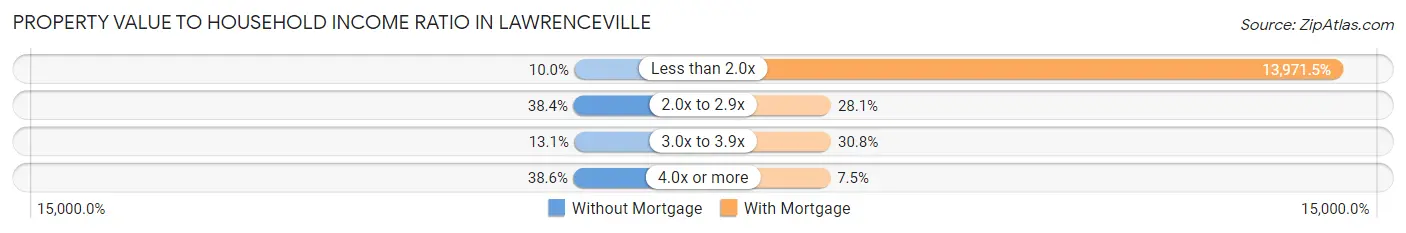
| Value-to-Income Ratio | Without Mortgage | With Mortgage |
| Less than 2.0x | 49 (10.0%) | 140,833 (13,971.5%) |
| 2.0x to 2.9x | 188 (38.4%) | 283 (28.1%) |
| 3.0x to 3.9x | 64 (13.1%) | 310 (30.7%) |
| 4.0x or more | 189 (38.6%) | 76 (7.5%) |
| Total | 490 (100.0%) | 1,008 (100.0%) |
Real Estate Taxes by Mortgage Status in Lawrenceville
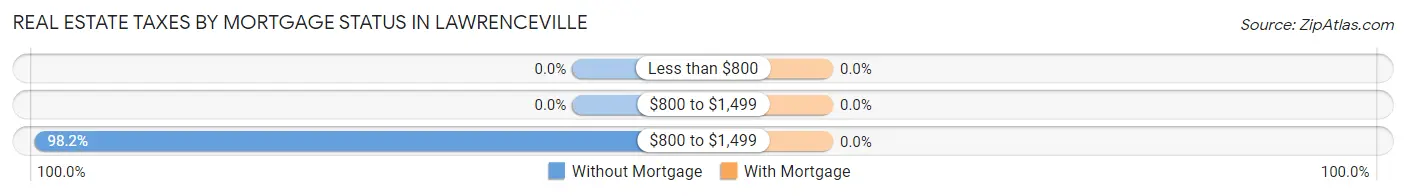
| Property Taxes | Without Mortgage | With Mortgage |
| Less than $800 | 0 (0.0%) | 0 (0.0%) |
| $800 to $1,499 | 0 (0.0%) | 0 (0.0%) |
| $800 to $1,499 | 481 (98.2%) | 0 (0.0%) |
| Total | 490 (100.0%) | 1,008 (100.0%) |
Health & Disability in Lawrenceville
Health Insurance Coverage by Age in Lawrenceville
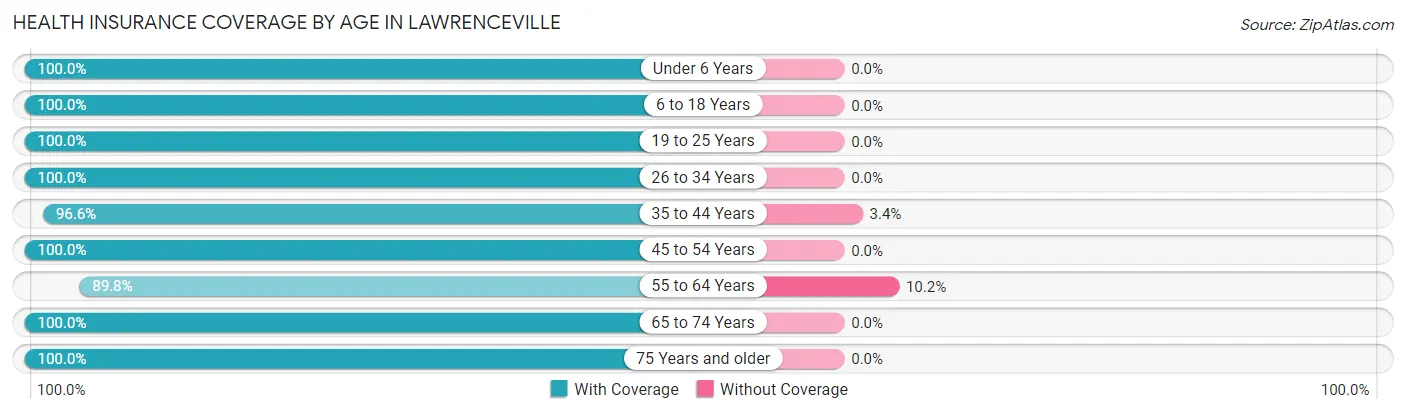
| Age Bracket | With Coverage | Without Coverage |
| Under 6 Years | 322 (100.0%) | 0 (0.0%) |
| 6 to 18 Years | 417 (100.0%) | 0 (0.0%) |
| 19 to 25 Years | 190 (100.0%) | 0 (0.0%) |
| 26 to 34 Years | 260 (100.0%) | 0 (0.0%) |
| 35 to 44 Years | 593 (96.6%) | 21 (3.4%) |
| 45 to 54 Years | 338 (100.0%) | 0 (0.0%) |
| 55 to 64 Years | 625 (89.8%) | 71 (10.2%) |
| 65 to 74 Years | 654 (100.0%) | 0 (0.0%) |
| 75 Years and older | 268 (100.0%) | 0 (0.0%) |
| Total | 3,667 (97.6%) | 92 (2.5%) |
Health Insurance Coverage by Citizenship Status in Lawrenceville
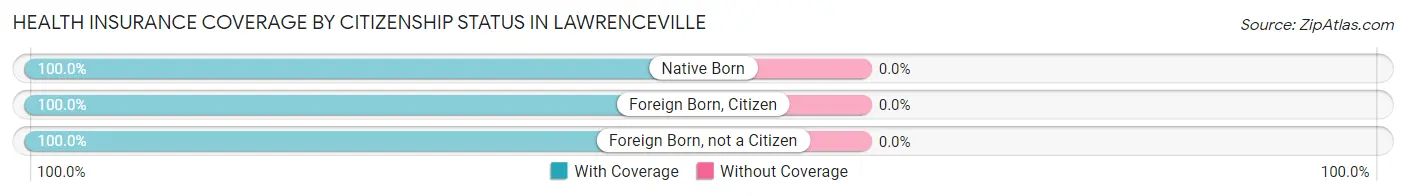
| Citizenship Status | With Coverage | Without Coverage |
| Native Born | 322 (100.0%) | 0 (0.0%) |
| Foreign Born, Citizen | 417 (100.0%) | 0 (0.0%) |
| Foreign Born, not a Citizen | 190 (100.0%) | 0 (0.0%) |
Health Insurance Coverage by Household Income in Lawrenceville
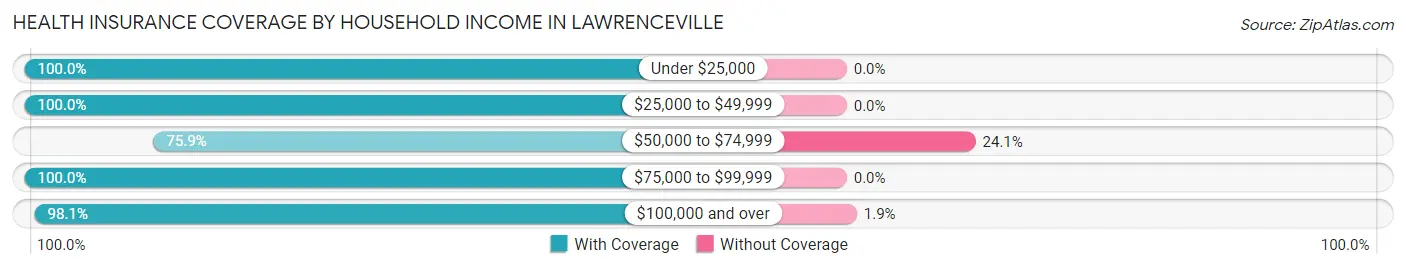
| Household Income | With Coverage | Without Coverage |
| Under $25,000 | 237 (100.0%) | 0 (0.0%) |
| $25,000 to $49,999 | 372 (100.0%) | 0 (0.0%) |
| $50,000 to $74,999 | 132 (75.9%) | 42 (24.1%) |
| $75,000 to $99,999 | 325 (100.0%) | 0 (0.0%) |
| $100,000 and over | 2,601 (98.1%) | 50 (1.9%) |
Public vs Private Health Insurance Coverage by Age in Lawrenceville
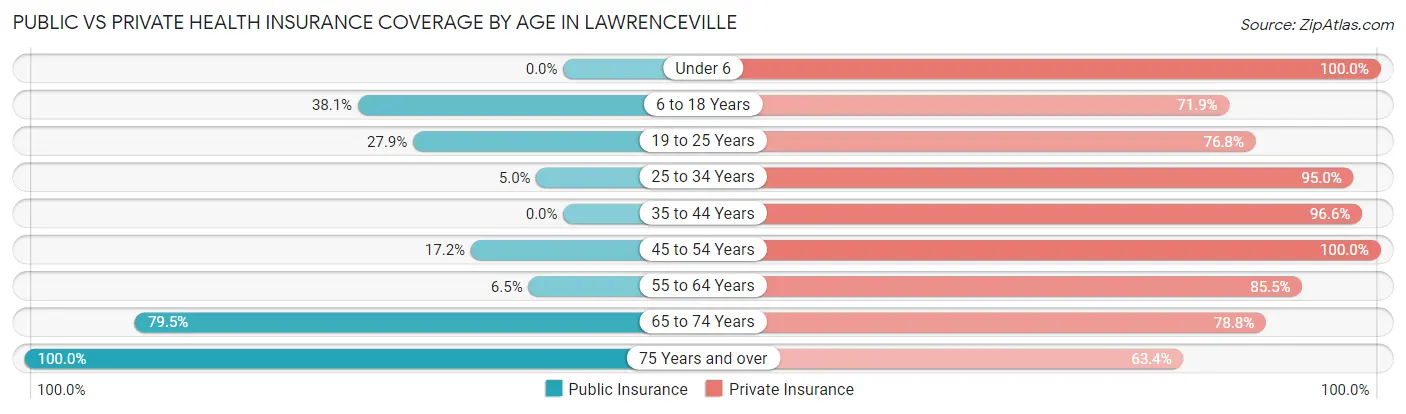
| Age Bracket | Public Insurance | Private Insurance |
| Under 6 | 0 (0.0%) | 322 (100.0%) |
| 6 to 18 Years | 159 (38.1%) | 300 (71.9%) |
| 19 to 25 Years | 53 (27.9%) | 146 (76.8%) |
| 25 to 34 Years | 13 (5.0%) | 247 (95.0%) |
| 35 to 44 Years | 0 (0.0%) | 593 (96.6%) |
| 45 to 54 Years | 58 (17.2%) | 338 (100.0%) |
| 55 to 64 Years | 45 (6.5%) | 595 (85.5%) |
| 65 to 74 Years | 520 (79.5%) | 515 (78.7%) |
| 75 Years and over | 268 (100.0%) | 170 (63.4%) |
| Total | 1,116 (29.7%) | 3,226 (85.8%) |
Disability Status by Sex by Age in Lawrenceville
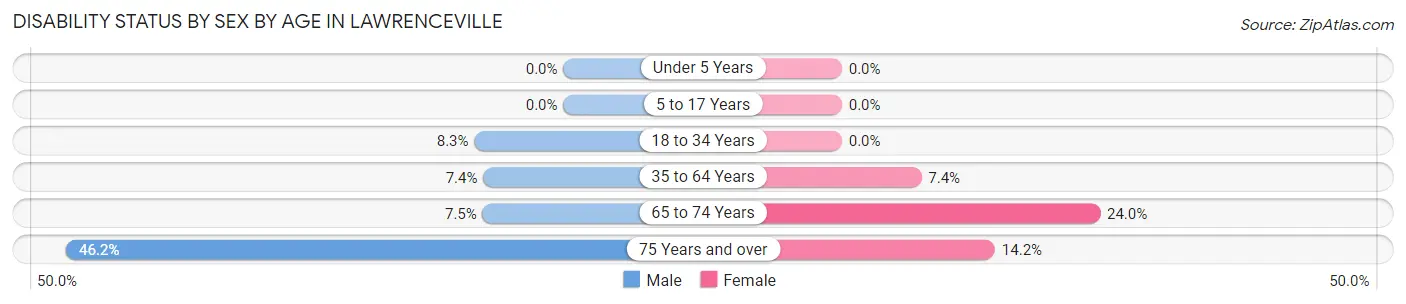
| Age Bracket | Male | Female |
| Under 5 Years | 0 (0.0%) | 0 (0.0%) |
| 5 to 17 Years | 0 (0.0%) | 0 (0.0%) |
| 18 to 34 Years | 20 (8.3%) | 0 (0.0%) |
| 35 to 64 Years | 50 (7.4%) | 72 (7.4%) |
| 65 to 74 Years | 29 (7.5%) | 64 (24.0%) |
| 75 Years and over | 36 (46.2%) | 27 (14.2%) |
Disability Class by Sex by Age in Lawrenceville
Disability Class: Hearing Difficulty
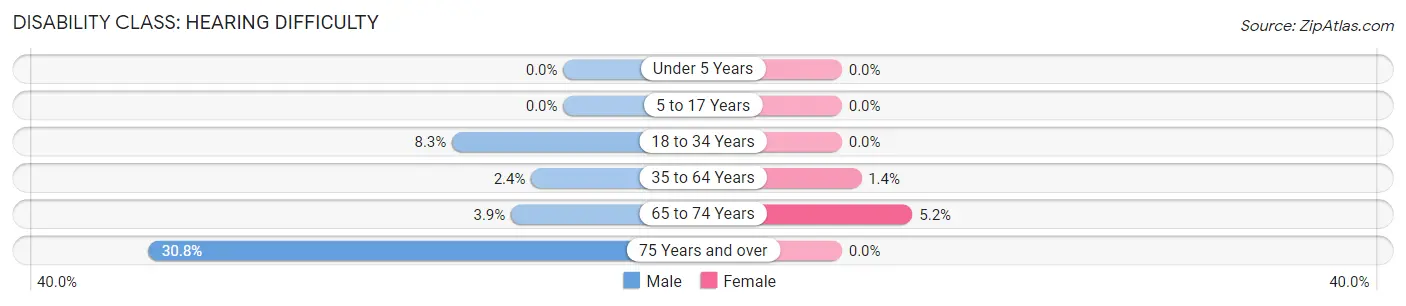
| Age Bracket | Male | Female |
| Under 5 Years | 0 (0.0%) | 0 (0.0%) |
| 5 to 17 Years | 0 (0.0%) | 0 (0.0%) |
| 18 to 34 Years | 20 (8.3%) | 0 (0.0%) |
| 35 to 64 Years | 16 (2.4%) | 14 (1.4%) |
| 65 to 74 Years | 15 (3.9%) | 14 (5.2%) |
| 75 Years and over | 24 (30.8%) | 0 (0.0%) |
Disability Class: Vision Difficulty
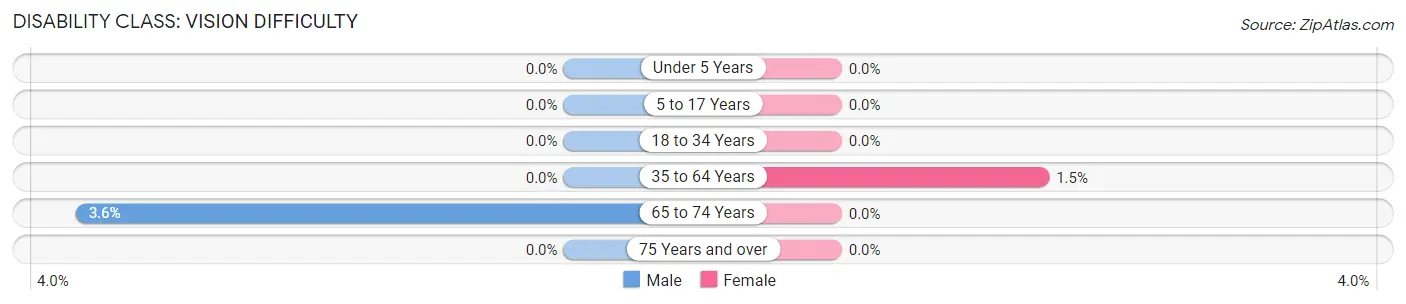
| Age Bracket | Male | Female |
| Under 5 Years | 0 (0.0%) | 0 (0.0%) |
| 5 to 17 Years | 0 (0.0%) | 0 (0.0%) |
| 18 to 34 Years | 0 (0.0%) | 0 (0.0%) |
| 35 to 64 Years | 0 (0.0%) | 15 (1.5%) |
| 65 to 74 Years | 14 (3.6%) | 0 (0.0%) |
| 75 Years and over | 0 (0.0%) | 0 (0.0%) |
Disability Class: Cognitive Difficulty
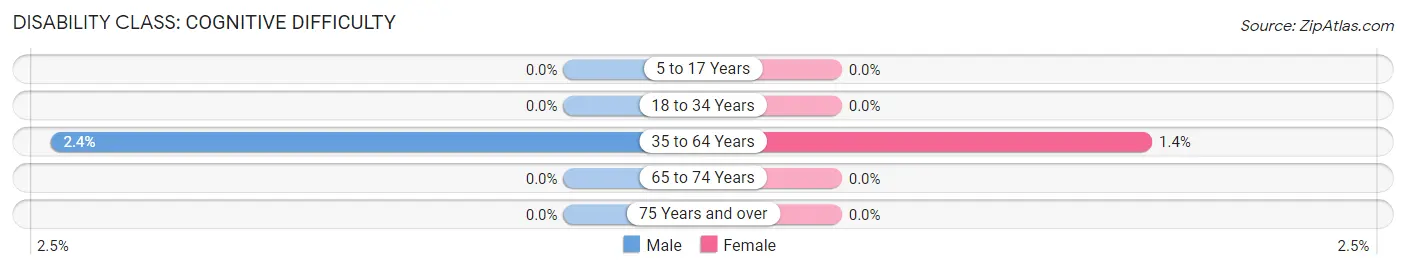
| Age Bracket | Male | Female |
| 5 to 17 Years | 0 (0.0%) | 0 (0.0%) |
| 18 to 34 Years | 0 (0.0%) | 0 (0.0%) |
| 35 to 64 Years | 16 (2.4%) | 14 (1.4%) |
| 65 to 74 Years | 0 (0.0%) | 0 (0.0%) |
| 75 Years and over | 0 (0.0%) | 0 (0.0%) |
Disability Class: Ambulatory Difficulty
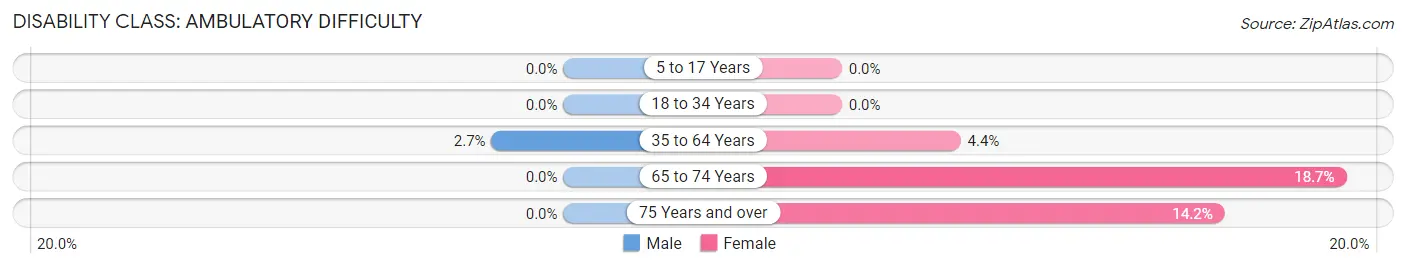
| Age Bracket | Male | Female |
| 5 to 17 Years | 0 (0.0%) | 0 (0.0%) |
| 18 to 34 Years | 0 (0.0%) | 0 (0.0%) |
| 35 to 64 Years | 18 (2.7%) | 43 (4.4%) |
| 65 to 74 Years | 0 (0.0%) | 50 (18.7%) |
| 75 Years and over | 0 (0.0%) | 27 (14.2%) |
Disability Class: Self-Care Difficulty
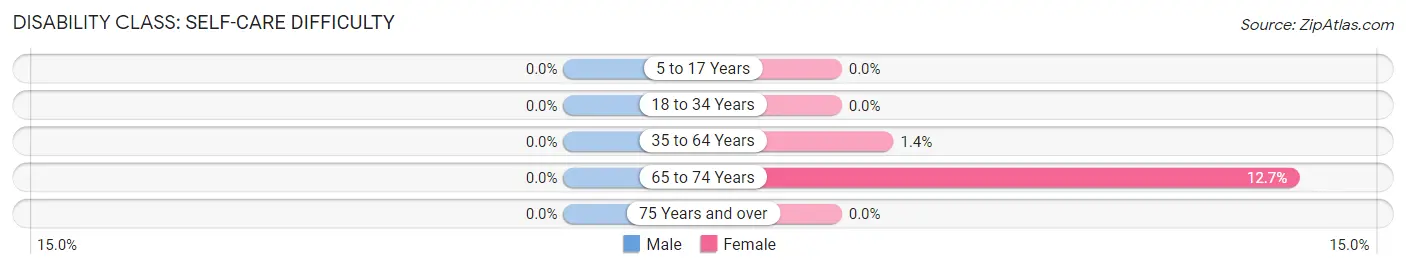
| Age Bracket | Male | Female |
| 5 to 17 Years | 0 (0.0%) | 0 (0.0%) |
| 18 to 34 Years | 0 (0.0%) | 0 (0.0%) |
| 35 to 64 Years | 0 (0.0%) | 14 (1.4%) |
| 65 to 74 Years | 0 (0.0%) | 34 (12.7%) |
| 75 Years and over | 0 (0.0%) | 0 (0.0%) |
Technology Access in Lawrenceville
Computing Device Access in Lawrenceville
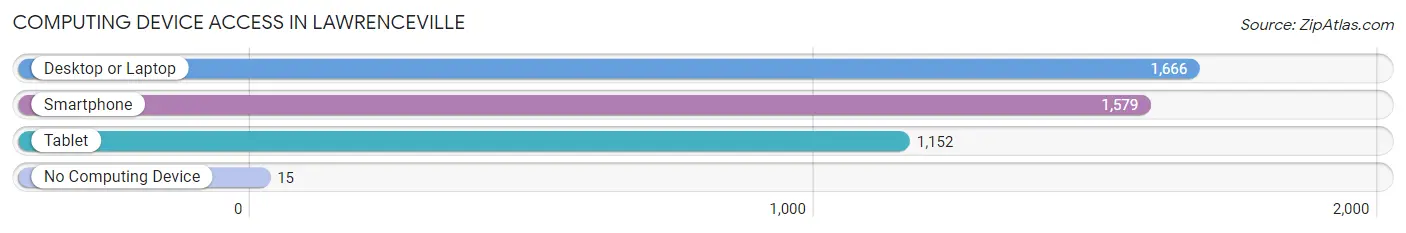
| Device Type | # Households | % Households |
| Desktop or Laptop | 1,666 | 96.0% |
| Smartphone | 1,579 | 91.0% |
| Tablet | 1,152 | 66.4% |
| No Computing Device | 15 | 0.9% |
| Total | 1,736 | 100.0% |
Internet Access in Lawrenceville
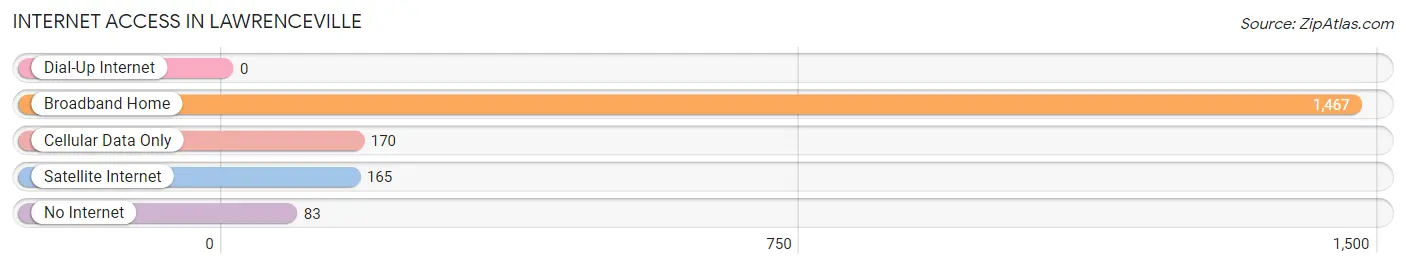
| Internet Type | # Households | % Households |
| Dial-Up Internet | 0 | 0.0% |
| Broadband Home | 1,467 | 84.5% |
| Cellular Data Only | 170 | 9.8% |
| Satellite Internet | 165 | 9.5% |
| No Internet | 83 | 4.8% |
| Total | 1,736 | 100.0% |
Lawrenceville Summary
Lawrenceville is a census-designated place (CDP) located in Mercer County, New Jersey, United States. As of the 2010 United States Census, the CDP's population was 3,887. It is located within the Lawrence Township, which is part of the Trenton metropolitan area.
History
The area now known as Lawrenceville was originally inhabited by the Lenni Lenape Native Americans. The first European settlers arrived in the area in the late 17th century, and the area was officially established as Lawrence Township in 1816. The village of Lawrenceville was founded in 1837, and was named after Captain James Lawrence, a naval hero of the War of 1812.
The village was originally a farming community, but it quickly developed into a center of industry and commerce. The first post office was established in 1838, and the first railroad line was built in 1848. The village was incorporated in 1868, and the first public school was built in 1871.
Geography
Lawrenceville is located at 40°14'45" North, 74°45'45" West (40.245833, -74.762500). According to the United States Census Bureau, the CDP has a total area of 2.2 square miles (5.7 km2), all of which is land.
The village is located in the Lawrence Township, which is part of the Trenton metropolitan area. It is bordered by the Delaware River to the east, and is situated between Princeton and Trenton.
Economy
Lawrenceville is a primarily residential community, but it is also home to a number of businesses and industries. The village is home to several corporate headquarters, including the headquarters of the pharmaceutical company Bristol-Myers Squibb. The village is also home to several educational institutions, including Rider University and The Lawrenceville School.
The village is served by the Lawrenceville-Princeton Airport, which is located just outside of the village. The airport is used primarily for private and corporate aircraft.
Demographics
As of the 2010 United States Census, there were 3,887 people, 1,541 households, and 990 families residing in the CDP. The population density was 1,743.3 per square mile (672.3/km2). There were 1,637 housing units at an average density of 730.3 per square mile (282.2/km2). The racial makeup of the CDP was 79.2% White, 11.2% African American, 0.2% Native American, 5.3% Asian, 0.1% Pacific Islander, 1.7% from other races, and 2.3% from two or more races. Hispanic or Latino of any race were 5.7% of the population.
There were 1,541 households, out of which 28.2% had children under the age of 18 living with them, 48.2% were married couples living together, 11.2% had a female householder with no husband present, and 36.3% were non-families. 29.7% of all households were made up of individuals, and 10.2% had someone living alone who was 65 years of age or older. The average household size was 2.51 and the average family size was 3.14.
In the CDP, the population was spread out, with 22.2% under the age of 18, 8.2% from 18 to 24, 28.2% from 25 to 44, 27.2% from 45 to 64, and 14.2% who were 65 years of age or older. The median age was 39.2 years. For every 100 females, there were 92.2 males. For every 100 females age 18 and over, there were 89.3 males.
The median income for a household in the CDP was $76,944, and the median income for a family was $95,938. Males had a median income of $63,750 versus $45,938 for females. The per capita income for the CDP was $37,945. About 3.2% of families and 5.2% of the population were below the poverty line, including 5.7% of those under age 18 and 4.2% of those age 65 or over.
Common Questions
What is Per Capita Income in Lawrenceville?
Per Capita income in Lawrenceville is $63,719.
What is the Median Family Income in Lawrenceville?
Median Family Income in Lawrenceville is $170,194.
What is the Median Household income in Lawrenceville?
Median Household Income in Lawrenceville is $115,577.
What is Income or Wage Gap in Lawrenceville?
Income or Wage Gap in Lawrenceville is 17.5%.
Women in Lawrenceville earn 82.5 cents for every dollar earned by a man.
What is Inequality or Gini Index in Lawrenceville?
Inequality or Gini Index in Lawrenceville is 0.43.
What is the Total Population of Lawrenceville?
Total Population of Lawrenceville is 3,759.
What is the Total Male Population of Lawrenceville?
Total Male Population of Lawrenceville is 1,806.
What is the Total Female Population of Lawrenceville?
Total Female Population of Lawrenceville is 1,953.
What is the Ratio of Males per 100 Females in Lawrenceville?
There are 92.47 Males per 100 Females in Lawrenceville.
What is the Ratio of Females per 100 Males in Lawrenceville?
There are 108.14 Females per 100 Males in Lawrenceville.
What is the Median Population Age in Lawrenceville?
Median Population Age in Lawrenceville is 47.2 Years.
What is the Average Family Size in Lawrenceville
Average Family Size in Lawrenceville is 3.0 People.
What is the Average Household Size in Lawrenceville
Average Household Size in Lawrenceville is 2.2 People.
How Large is the Labor Force in Lawrenceville?
There are 2,113 People in the Labor Forcein in Lawrenceville.
What is the Percentage of People in the Labor Force in Lawrenceville?
67.5% of People are in the Labor Force in Lawrenceville.
What is the Unemployment Rate in Lawrenceville?
Unemployment Rate in Lawrenceville is 7.2%.