Cities with the Highest Percentage of Slavic Population in New Jersey
RELATED REPORTS & OPTIONS
Slavic
New Jersey
Compare Cities
Map of Cities with the Highest Percentage of Slavic Population in New Jersey
0.00%
5.00%
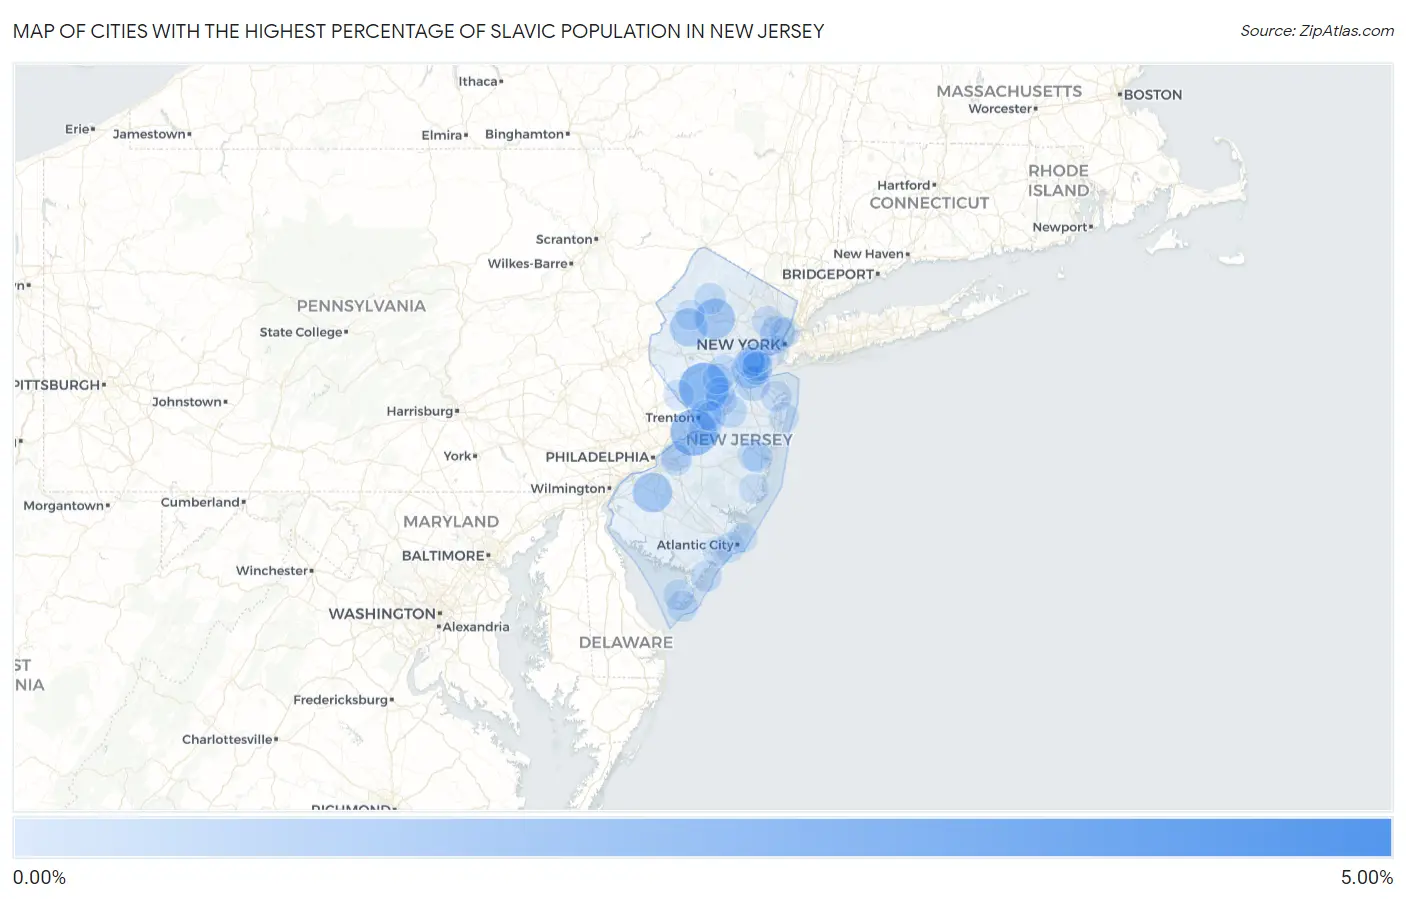
Cities with the Highest Percentage of Slavic Population in New Jersey
| City | Slavic | vs State | vs National | |
| 1. | Hopelawn | 4.54% | 0.071% (+4.47)#1 | 0.039% (+4.50)#30 |
| 2. | Palermo | 3.07% | 0.071% (+3.00)#2 | 0.039% (+3.03)#48 |
| 3. | Skillman | 2.36% | 0.071% (+2.29)#3 | 0.039% (+2.32)#63 |
| 4. | West Wildwood Borough | 2.11% | 0.071% (+2.04)#4 | 0.039% (+2.07)#75 |
| 5. | Florence | 2.04% | 0.071% (+1.96)#5 | 0.039% (+2.00)#81 |
| 6. | Sewell | 1.69% | 0.071% (+1.62)#6 | 0.039% (+1.65)#113 |
| 7. | Stanhope Borough | 1.53% | 0.071% (+1.46)#7 | 0.039% (+1.49)#128 |
| 8. | Troy Hills | 1.40% | 0.071% (+1.33)#8 | 0.039% (+1.36)#149 |
| 9. | Kenvil | 1.28% | 0.071% (+1.21)#9 | 0.039% (+1.24)#166 |
| 10. | Gillette | 1.25% | 0.071% (+1.18)#10 | 0.039% (+1.21)#170 |
| 11. | Richwood | 1.23% | 0.071% (+1.16)#11 | 0.039% (+1.19)#175 |
| 12. | Beattystown | 1.05% | 0.071% (+0.981)#12 | 0.039% (+1.01)#206 |
| 13. | Dunellen Borough | 1.00% | 0.071% (+0.930)#13 | 0.039% (+0.961)#223 |
| 14. | Fords | 0.92% | 0.071% (+0.853)#14 | 0.039% (+0.885)#259 |
| 15. | Secaucus | 0.76% | 0.071% (+0.689)#15 | 0.039% (+0.720)#325 |
| 16. | Belmar Borough | 0.75% | 0.071% (+0.678)#16 | 0.039% (+0.710)#330 |
| 17. | Frenchtown Borough | 0.73% | 0.071% (+0.662)#17 | 0.039% (+0.693)#337 |
| 18. | Madison Park | 0.66% | 0.071% (+0.593)#18 | 0.039% (+0.624)#367 |
| 19. | Chester Borough | 0.54% | 0.071% (+0.470)#19 | 0.039% (+0.501)#468 |
| 20. | Kean University | 0.53% | 0.071% (+0.463)#20 | 0.039% (+0.494)#474 |
| 21. | Bordentown | 0.53% | 0.071% (+0.456)#21 | 0.039% (+0.487)#480 |
| 22. | Twin Rivers | 0.52% | 0.071% (+0.445)#22 | 0.039% (+0.477)#490 |
| 23. | Rocky Hill Borough | 0.50% | 0.071% (+0.433)#23 | 0.039% (+0.465)#508 |
| 24. | Butler Borough | 0.47% | 0.071% (+0.402)#24 | 0.039% (+0.433)#543 |
| 25. | Preakness | 0.45% | 0.071% (+0.381)#25 | 0.039% (+0.413)#562 |
| 26. | Franklin Center | 0.45% | 0.071% (+0.377)#26 | 0.039% (+0.409)#569 |
| 27. | Kinnelon Borough | 0.44% | 0.071% (+0.370)#27 | 0.039% (+0.401)#578 |
| 28. | Hopatcong Borough | 0.43% | 0.071% (+0.360)#28 | 0.039% (+0.391)#600 |
| 29. | Sewaren | 0.41% | 0.071% (+0.338)#29 | 0.039% (+0.369)#624 |
| 30. | Audubon Borough | 0.40% | 0.071% (+0.332)#30 | 0.039% (+0.363)#627 |
| 31. | Ship Bottom Borough | 0.40% | 0.071% (+0.331)#31 | 0.039% (+0.363)#628 |
| 32. | Holiday City Berkeley | 0.39% | 0.071% (+0.317)#32 | 0.039% (+0.349)#653 |
| 33. | Roosevelt Borough | 0.39% | 0.071% (+0.315)#33 | 0.039% (+0.347)#659 |
| 34. | Far Hills Borough | 0.38% | 0.071% (+0.312)#34 | 0.039% (+0.343)#668 |
| 35. | Lake Hopatcong | 0.38% | 0.071% (+0.311)#35 | 0.039% (+0.343)#671 |
| 36. | Somerdale Borough | 0.38% | 0.071% (+0.310)#36 | 0.039% (+0.341)#676 |
| 37. | Middlesex Borough | 0.38% | 0.071% (+0.308)#37 | 0.039% (+0.340)#678 |
| 38. | Marmora | 0.37% | 0.071% (+0.301)#38 | 0.039% (+0.332)#690 |
| 39. | Haddonfield Borough | 0.35% | 0.071% (+0.283)#39 | 0.039% (+0.314)#721 |
| 40. | Manville Borough | 0.34% | 0.071% (+0.269)#40 | 0.039% (+0.301)#748 |
| 41. | Princeton Meadows | 0.33% | 0.071% (+0.263)#41 | 0.039% (+0.295)#768 |
| 42. | Lake Mohawk | 0.33% | 0.071% (+0.259)#42 | 0.039% (+0.291)#777 |
| 43. | Milford Borough | 0.32% | 0.071% (+0.251)#43 | 0.039% (+0.282)#799 |
| 44. | Clayton Borough | 0.32% | 0.071% (+0.248)#44 | 0.039% (+0.279)#806 |
| 45. | Rahway | 0.31% | 0.071% (+0.243)#45 | 0.039% (+0.274)#815 |
| 46. | Freehold Borough | 0.31% | 0.071% (+0.242)#46 | 0.039% (+0.273)#819 |
| 47. | Carteret Borough | 0.30% | 0.071% (+0.232)#47 | 0.039% (+0.263)#850 |
| 48. | Sea Isle City | 0.29% | 0.071% (+0.223)#48 | 0.039% (+0.254)#878 |
| 49. | Ramblewood | 0.28% | 0.071% (+0.214)#49 | 0.039% (+0.246)#894 |
| 50. | Cape May | 0.28% | 0.071% (+0.214)#50 | 0.039% (+0.245)#895 |
| 51. | Palmyra Borough | 0.28% | 0.071% (+0.212)#51 | 0.039% (+0.243)#898 |
| 52. | Avon By The Sea Borough | 0.28% | 0.071% (+0.209)#52 | 0.039% (+0.240)#907 |
| 53. | Bayonne | 0.27% | 0.071% (+0.200)#53 | 0.039% (+0.232)#925 |
| 54. | Helmetta Borough | 0.26% | 0.071% (+0.190)#54 | 0.039% (+0.222)#959 |
| 55. | Moonachie Borough | 0.26% | 0.071% (+0.188)#55 | 0.039% (+0.220)#967 |
| 56. | Caldwell Borough | 0.26% | 0.071% (+0.188)#56 | 0.039% (+0.219)#968 |
| 57. | Villas | 0.25% | 0.071% (+0.181)#57 | 0.039% (+0.213)#989 |
| 58. | Clifton | 0.24% | 0.071% (+0.168)#58 | 0.039% (+0.199)#1,033 |
| 59. | Whippany | 0.24% | 0.071% (+0.166)#59 | 0.039% (+0.197)#1,036 |
| 60. | Heathcote | 0.24% | 0.071% (+0.166)#60 | 0.039% (+0.197)#1,037 |
| 61. | Fairview | 0.24% | 0.071% (+0.166)#61 | 0.039% (+0.197)#1,040 |
| 62. | Pines Lake | 0.23% | 0.071% (+0.160)#62 | 0.039% (+0.192)#1,062 |
| 63. | Mercerville | 0.23% | 0.071% (+0.159)#63 | 0.039% (+0.191)#1,066 |
| 64. | Pompton Plains | 0.23% | 0.071% (+0.158)#64 | 0.039% (+0.189)#1,070 |
| 65. | South Toms River Borough | 0.22% | 0.071% (+0.148)#65 | 0.039% (+0.179)#1,114 |
| 66. | Lambertville | 0.22% | 0.071% (+0.148)#66 | 0.039% (+0.179)#1,115 |
| 67. | Linden | 0.21% | 0.071% (+0.141)#67 | 0.039% (+0.172)#1,141 |
| 68. | Blackwells Mills | 0.21% | 0.071% (+0.139)#68 | 0.039% (+0.170)#1,158 |
| 69. | Alpine Borough | 0.21% | 0.071% (+0.137)#69 | 0.039% (+0.168)#1,171 |
| 70. | Glen Ridge Borough | 0.21% | 0.071% (+0.135)#70 | 0.039% (+0.166)#1,179 |
| 71. | Mount Arlington Borough | 0.20% | 0.071% (+0.134)#71 | 0.039% (+0.166)#1,183 |
| 72. | Colonia | 0.20% | 0.071% (+0.134)#72 | 0.039% (+0.165)#1,184 |
| 73. | Holiday City South | 0.20% | 0.071% (+0.133)#73 | 0.039% (+0.165)#1,185 |
| 74. | Milltown Borough | 0.20% | 0.071% (+0.129)#74 | 0.039% (+0.160)#1,203 |
| 75. | Island Heights Borough | 0.20% | 0.071% (+0.127)#75 | 0.039% (+0.158)#1,211 |
| 76. | Riverdale Borough | 0.20% | 0.071% (+0.126)#76 | 0.039% (+0.157)#1,217 |
| 77. | Fort Lee Borough | 0.20% | 0.071% (+0.125)#77 | 0.039% (+0.157)#1,218 |
| 78. | Florham Park Borough | 0.20% | 0.071% (+0.125)#78 | 0.039% (+0.156)#1,226 |
| 79. | Northvale Borough | 0.19% | 0.071% (+0.118)#79 | 0.039% (+0.150)#1,259 |
| 80. | Oakland Borough | 0.19% | 0.071% (+0.118)#80 | 0.039% (+0.149)#1,261 |
| 81. | Ringwood Borough | 0.19% | 0.071% (+0.118)#81 | 0.039% (+0.149)#1,265 |
| 82. | Flemington Borough | 0.19% | 0.071% (+0.115)#82 | 0.039% (+0.146)#1,278 |
| 83. | Guttenberg | 0.18% | 0.071% (+0.108)#83 | 0.039% (+0.139)#1,307 |
| 84. | Asbury Park | 0.18% | 0.071% (+0.107)#84 | 0.039% (+0.138)#1,314 |
| 85. | Panther Valley | 0.18% | 0.071% (+0.105)#85 | 0.039% (+0.136)#1,318 |
| 86. | Moorestown Lenola | 0.17% | 0.071% (+0.103)#86 | 0.039% (+0.135)#1,324 |
| 87. | Port Reading | 0.17% | 0.071% (+0.103)#87 | 0.039% (+0.134)#1,327 |
| 88. | Ventnor City | 0.17% | 0.071% (+0.102)#88 | 0.039% (+0.133)#1,331 |
| 89. | Wood Ridge Borough | 0.17% | 0.071% (+0.100)#89 | 0.039% (+0.131)#1,343 |
| 90. | Brigantine | 0.17% | 0.071% (+0.096)#90 | 0.039% (+0.128)#1,359 |
| 91. | National Park Borough | 0.17% | 0.071% (+0.095)#91 | 0.039% (+0.126)#1,368 |
| 92. | Cresskill Borough | 0.16% | 0.071% (+0.094)#92 | 0.039% (+0.126)#1,371 |
| 93. | Keansburg Borough | 0.16% | 0.071% (+0.093)#93 | 0.039% (+0.125)#1,376 |
| 94. | Lebanon Borough | 0.16% | 0.071% (+0.090)#94 | 0.039% (+0.122)#1,393 |
| 95. | Hamilton Square | 0.15% | 0.071% (+0.081)#95 | 0.039% (+0.112)#1,442 |
| 96. | Rumson Borough | 0.15% | 0.071% (+0.080)#96 | 0.039% (+0.112)#1,444 |
| 97. | Haworth Borough | 0.15% | 0.071% (+0.079)#97 | 0.039% (+0.110)#1,451 |
| 98. | Ocean Acres | 0.15% | 0.071% (+0.078)#98 | 0.039% (+0.109)#1,460 |
| 99. | Bogota Borough | 0.15% | 0.071% (+0.075)#99 | 0.039% (+0.106)#1,479 |
| 100. | Somers Point | 0.14% | 0.071% (+0.073)#100 | 0.039% (+0.104)#1,489 |
Common Questions
What are the Top 10 Cities with the Highest Percentage of Slavic Population in New Jersey?
Top 10 Cities with the Highest Percentage of Slavic Population in New Jersey are:
#1
2.36%
#2
2.04%
#3
1.28%
#4
1.23%
#5
1.05%
#6
0.92%
#7
0.76%
#8
0.66%
#9
0.53%
#10
0.52%
What city has the Highest Percentage of Slavic Population in New Jersey?
Skillman has the Highest Percentage of Slavic Population in New Jersey with 2.36%.
What is the Percentage of Slavic Population in the State of New Jersey?
Percentage of Slavic Population in New Jersey is 0.071%.
What is the Percentage of Slavic Population in the United States?
Percentage of Slavic Population in the United States is 0.039%.