Bogota borough, NJ Map & Demographics
Bogota borough Overview
$48,011
PER CAPITA INCOME
$114,271
AVG FAMILY INCOME
$113,260
AVG HOUSEHOLD INCOME
31.8%
WAGE / INCOME GAP [ % ]
68.2¢/ $1
WAGE / INCOME GAP [ $ ]
0.36
INEQUALITY / GINI INDEX
8,940
TOTAL POPULATION
4,115
MALE POPULATION
4,825
FEMALE POPULATION
85.28
MALES / 100 FEMALES
117.25
FEMALES / 100 MALES
42.2
MEDIAN AGE
3.2
AVG FAMILY SIZE
2.8
AVG HOUSEHOLD SIZE
5,034
LABOR FORCE [ PEOPLE ]
69.0%
PERCENT IN LABOR FORCE
6.5%
UNEMPLOYMENT RATE
Income in Bogota borough
Income Overview in Bogota borough
Per Capita Income in Bogota borough is $48,011, while median incomes of families and households are $114,271 and $113,260 respectively.
| Characteristic | Number | Measure |
| Per Capita Income | 8,940 | $48,011 |
| Median Family Income | 2,292 | $114,271 |
| Mean Family Income | 2,292 | $134,970 |
| Median Household Income | 3,199 | $113,260 |
| Mean Household Income | 3,199 | $129,921 |
| Income Deficit | 2,292 | $0 |
| Wage / Income Gap (%) | 8,940 | 31.79% |
| Wage / Income Gap ($) | 8,940 | 68.21¢ per $1 |
| Gini / Inequality Index | 8,940 | 0.36 |
Earnings by Sex in Bogota borough
Average Earnings in Bogota borough are $58,869, $71,521 for men and $48,785 for women, a difference of 31.8%.
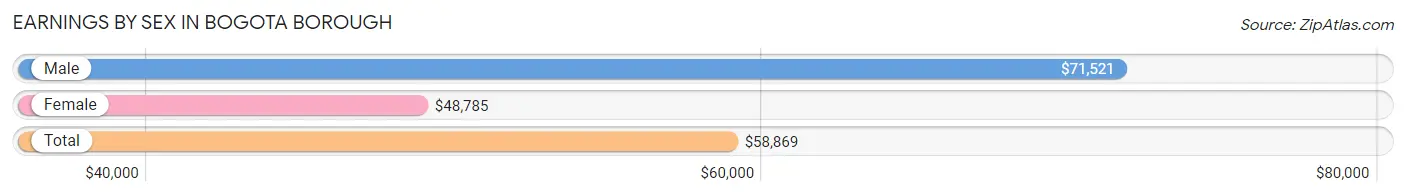
| Sex | Number | Average Earnings |
| Male | 2,583 (49.4%) | $71,521 |
| Female | 2,645 (50.6%) | $48,785 |
| Total | 5,228 (100.0%) | $58,869 |
Earnings by Sex by Income Bracket in Bogota borough
The most common earnings brackets in Bogota borough are $100,000+ for men (723 | 28.0%) and $100,000+ for women (494 | 18.7%).
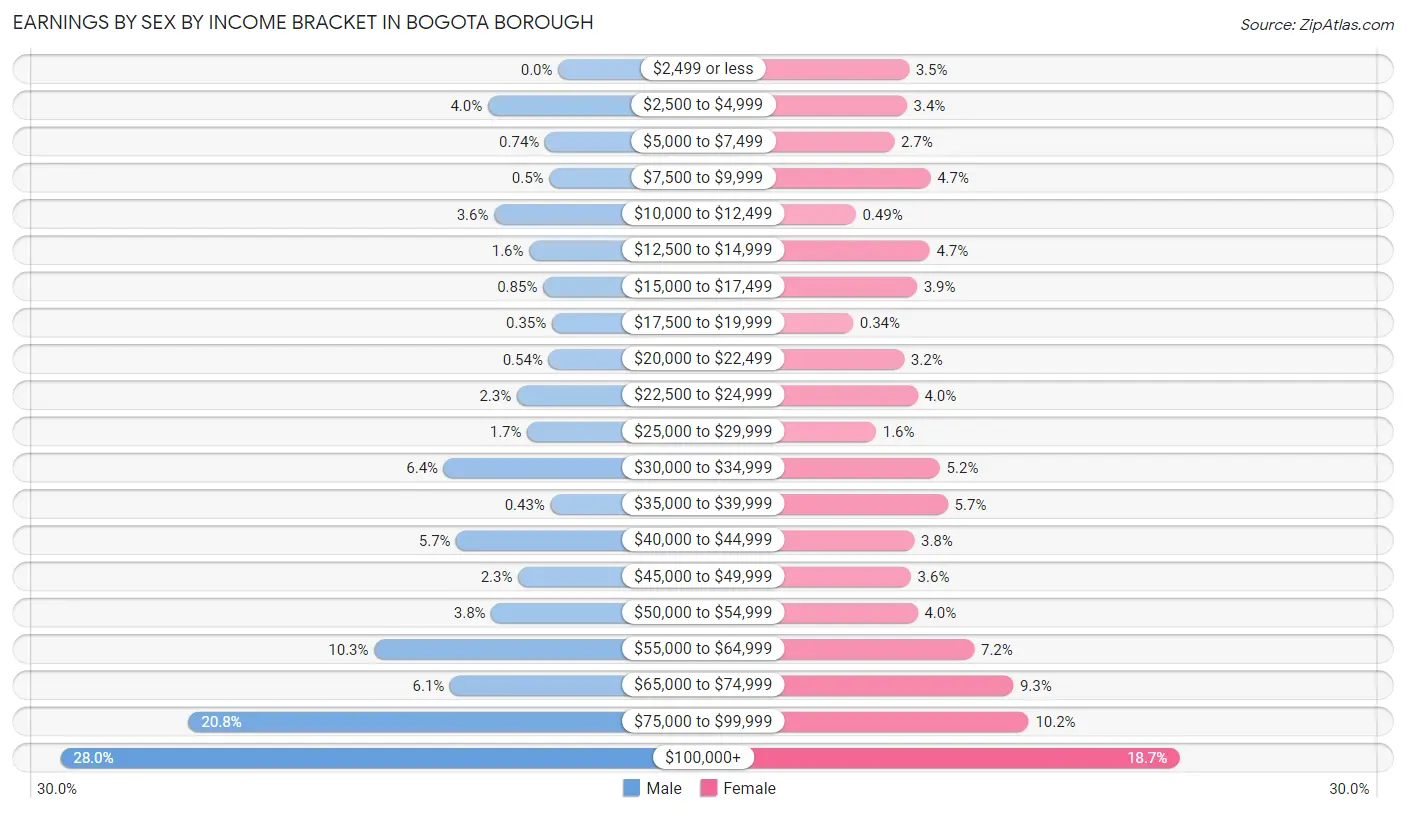
| Income | Male | Female |
| $2,499 or less | 0 (0.0%) | 92 (3.5%) |
| $2,500 to $4,999 | 102 (4.0%) | 89 (3.4%) |
| $5,000 to $7,499 | 19 (0.7%) | 70 (2.6%) |
| $7,500 to $9,999 | 13 (0.5%) | 124 (4.7%) |
| $10,000 to $12,499 | 93 (3.6%) | 13 (0.5%) |
| $12,500 to $14,999 | 42 (1.6%) | 123 (4.6%) |
| $15,000 to $17,499 | 22 (0.9%) | 104 (3.9%) |
| $17,500 to $19,999 | 9 (0.4%) | 9 (0.3%) |
| $20,000 to $22,499 | 14 (0.5%) | 85 (3.2%) |
| $22,500 to $24,999 | 60 (2.3%) | 105 (4.0%) |
| $25,000 to $29,999 | 45 (1.7%) | 43 (1.6%) |
| $30,000 to $34,999 | 166 (6.4%) | 138 (5.2%) |
| $35,000 to $39,999 | 11 (0.4%) | 150 (5.7%) |
| $40,000 to $44,999 | 148 (5.7%) | 100 (3.8%) |
| $45,000 to $49,999 | 58 (2.2%) | 95 (3.6%) |
| $50,000 to $54,999 | 97 (3.8%) | 105 (4.0%) |
| $55,000 to $64,999 | 267 (10.3%) | 189 (7.1%) |
| $65,000 to $74,999 | 157 (6.1%) | 247 (9.3%) |
| $75,000 to $99,999 | 537 (20.8%) | 270 (10.2%) |
| $100,000+ | 723 (28.0%) | 494 (18.7%) |
| Total | 2,583 (100.0%) | 2,645 (100.0%) |
Earnings by Sex by Educational Attainment in Bogota borough
Average earnings in Bogota borough are $78,646 for men and $55,813 for women, a difference of 29.0%. Men with an educational attainment of bachelor's degree enjoy the highest average annual earnings of $105,223, while those with less than high school education earn the least with $40,234. Women with an educational attainment of graduate degree earn the most with the average annual earnings of $98,011, while those with high school diploma education have the smallest earnings of $37,115.
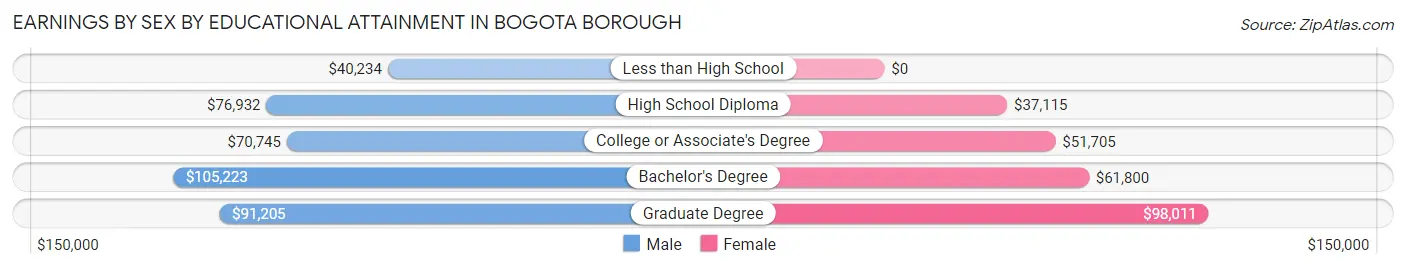
| Educational Attainment | Male Income | Female Income |
| Less than High School | $40,234 | $0 |
| High School Diploma | $76,932 | $37,115 |
| College or Associate's Degree | $70,745 | $51,705 |
| Bachelor's Degree | $105,223 | $61,800 |
| Graduate Degree | $91,205 | $98,011 |
| Total | $78,646 | $55,813 |
Family Income in Bogota borough
Family Income Brackets in Bogota borough
According to the Bogota borough family income data, there are 504 families falling into the $100,000 to $149,999 income range, which is the most common income bracket and makes up 22.0% of all families.
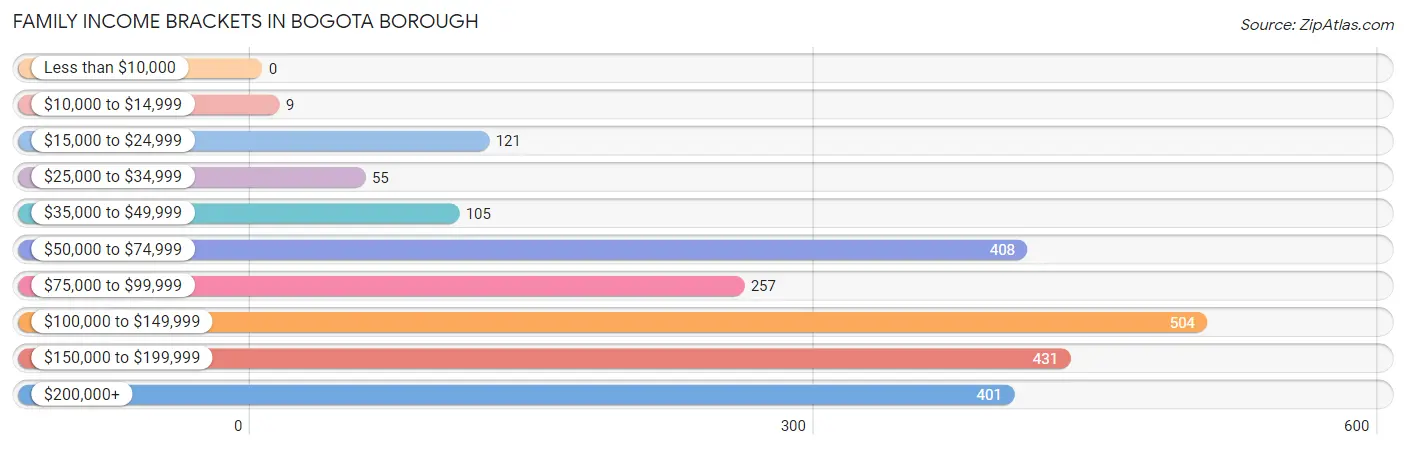
| Income Bracket | # Families | % Families |
| Less than $10,000 | 0 | 0.0% |
| $10,000 to $14,999 | 9 | 0.4% |
| $15,000 to $24,999 | 121 | 5.3% |
| $25,000 to $34,999 | 55 | 2.4% |
| $35,000 to $49,999 | 105 | 4.6% |
| $50,000 to $74,999 | 408 | 17.8% |
| $75,000 to $99,999 | 257 | 11.2% |
| $100,000 to $149,999 | 504 | 22.0% |
| $150,000 to $199,999 | 431 | 18.8% |
| $200,000+ | 401 | 17.5% |
Family Income by Famaliy Size in Bogota borough
6-person families (68 | 3.0%) account for the highest median family income in Bogota borough with $250,001 per family, while 2-person families (955 | 41.7%) have the highest median income of $50,718 per family member.
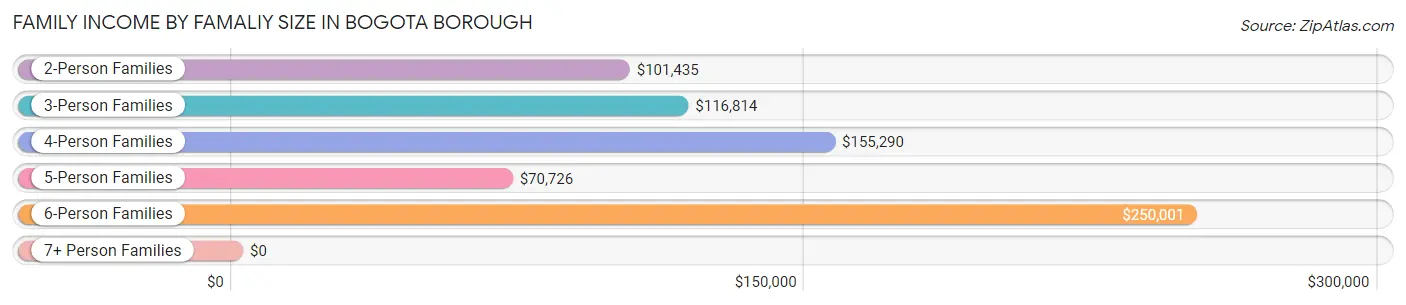
| Income Bracket | # Families | Median Income |
| 2-Person Families | 955 (41.7%) | $101,435 |
| 3-Person Families | 648 (28.3%) | $116,814 |
| 4-Person Families | 367 (16.0%) | $155,290 |
| 5-Person Families | 206 (9.0%) | $70,726 |
| 6-Person Families | 68 (3.0%) | $250,001 |
| 7+ Person Families | 48 (2.1%) | $0 |
| Total | 2,292 (100.0%) | $114,271 |
Family Income by Number of Earners in Bogota borough
The median family income in Bogota borough is $114,271, with families comprising 3+ earners (318) having the highest median family income of $167,300, while families with no earners (176) have the lowest median family income of $62,222, accounting for 13.9% and 7.7% of families, respectively.
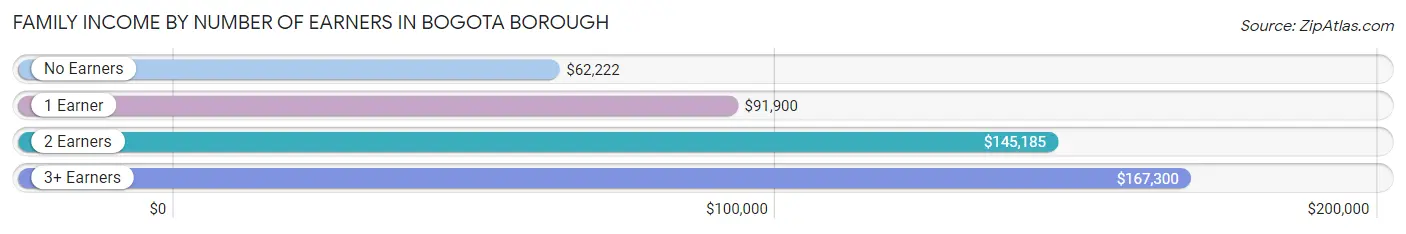
| Number of Earners | # Families | Median Income |
| No Earners | 176 (7.7%) | $62,222 |
| 1 Earner | 770 (33.6%) | $91,900 |
| 2 Earners | 1,028 (44.9%) | $145,185 |
| 3+ Earners | 318 (13.9%) | $167,300 |
| Total | 2,292 (100.0%) | $114,271 |
Household Income in Bogota borough
Household Income Brackets in Bogota borough
With 742 households falling in the category, the $100,000 to $149,999 income range is the most frequent in Bogota borough, accounting for 23.2% of all households. In contrast, only 10 households (0.3%) fall into the $10,000 to $14,999 income bracket, making it the least populous group.
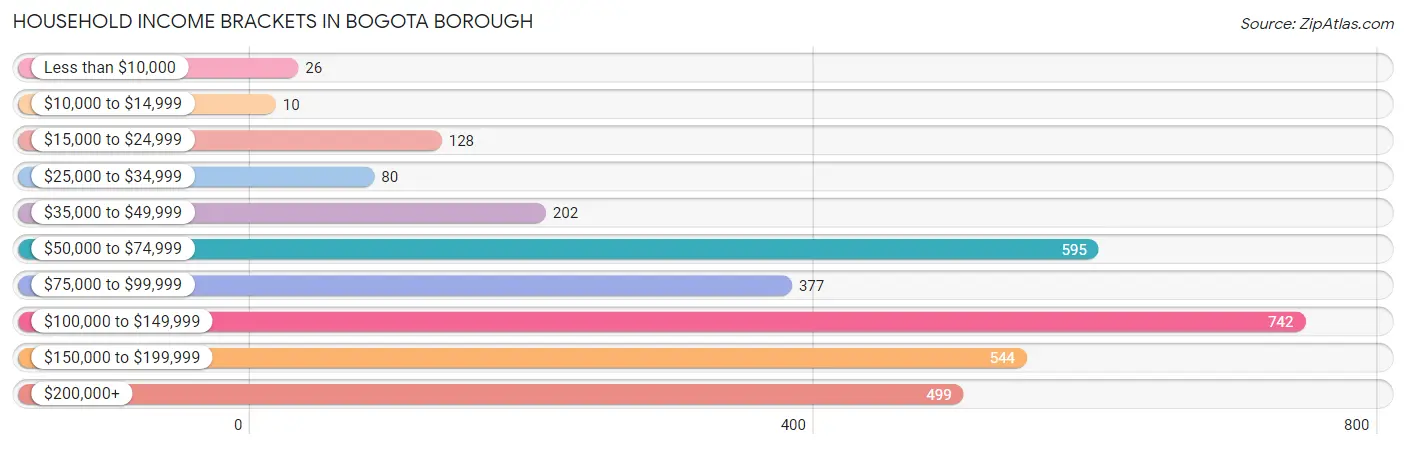
| Income Bracket | # Households | % Households |
| Less than $10,000 | 26 | 0.8% |
| $10,000 to $14,999 | 10 | 0.3% |
| $15,000 to $24,999 | 128 | 4.0% |
| $25,000 to $34,999 | 80 | 2.5% |
| $35,000 to $49,999 | 202 | 6.3% |
| $50,000 to $74,999 | 595 | 18.6% |
| $75,000 to $99,999 | 377 | 11.8% |
| $100,000 to $149,999 | 742 | 23.2% |
| $150,000 to $199,999 | 544 | 17.0% |
| $200,000+ | 499 | 15.6% |
Household Income by Householder Age in Bogota borough
The median household income in Bogota borough is $113,260, with the highest median household income of $129,485 found in the 25 to 44 years age bracket for the primary householder. A total of 979 households (30.6%) fall into this category. Meanwhile, the 15 to 24 years age bracket for the primary householder has the lowest median household income of $70,726, with 70 households (2.2%) in this group.
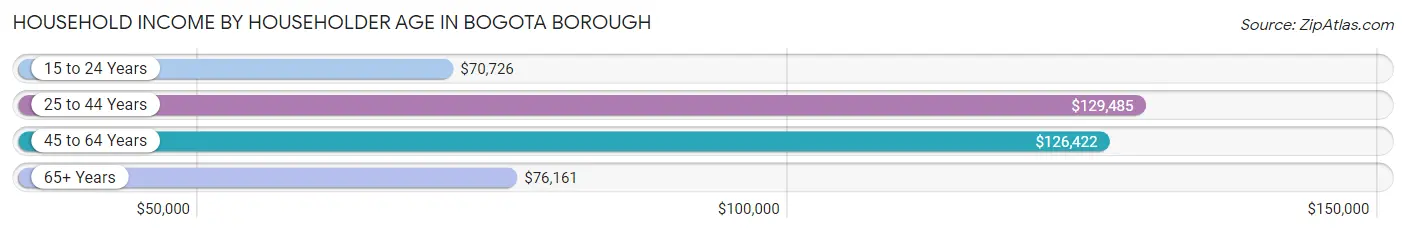
| Income Bracket | # Households | Median Income |
| 15 to 24 Years | 70 (2.2%) | $70,726 |
| 25 to 44 Years | 979 (30.6%) | $129,485 |
| 45 to 64 Years | 1,268 (39.6%) | $126,422 |
| 65+ Years | 882 (27.6%) | $76,161 |
| Total | 3,199 (100.0%) | $113,260 |
Poverty in Bogota borough
Income Below Poverty by Sex and Age in Bogota borough
With 4.5% poverty level for males and 3.3% for females among the residents of Bogota borough, 5 year old males and 45 to 54 year old females are the most vulnerable to poverty, with 46 males (30.3%) and 34 females (7.3%) in their respective age groups living below the poverty level.
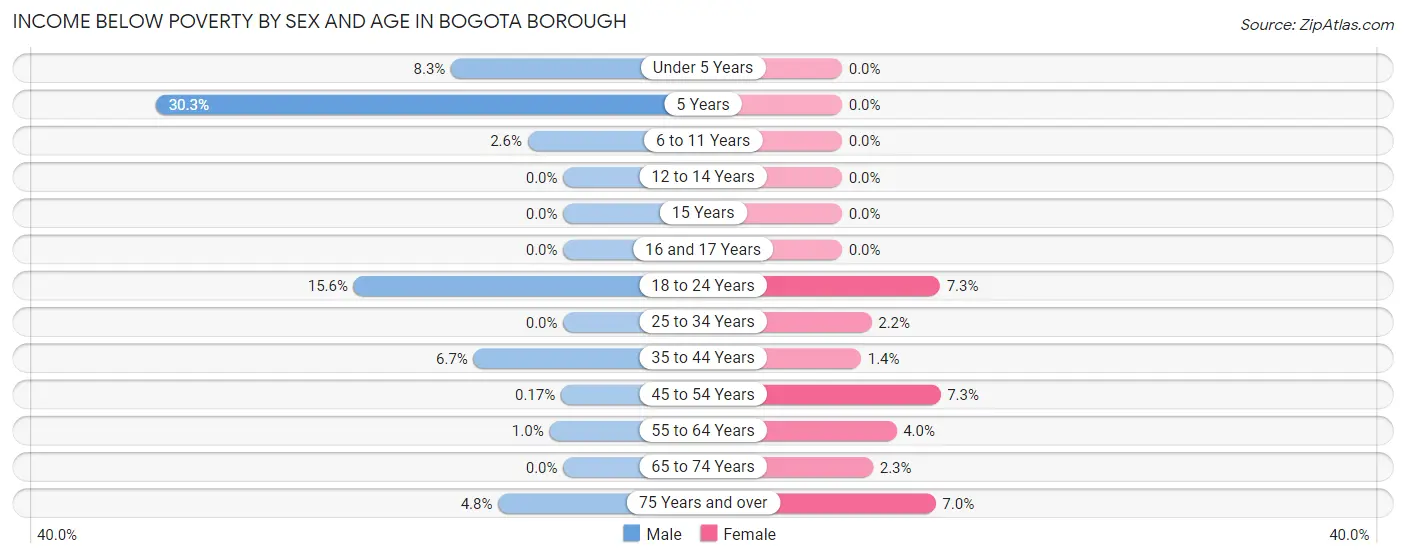
| Age Bracket | Male | Female |
| Under 5 Years | 11 (8.3%) | 0 (0.0%) |
| 5 Years | 46 (30.3%) | 0 (0.0%) |
| 6 to 11 Years | 10 (2.6%) | 0 (0.0%) |
| 12 to 14 Years | 0 (0.0%) | 0 (0.0%) |
| 15 Years | 0 (0.0%) | 0 (0.0%) |
| 16 and 17 Years | 0 (0.0%) | 0 (0.0%) |
| 18 to 24 Years | 40 (15.6%) | 36 (7.3%) |
| 25 to 34 Years | 0 (0.0%) | 12 (2.2%) |
| 35 to 44 Years | 60 (6.7%) | 12 (1.4%) |
| 45 to 54 Years | 1 (0.2%) | 34 (7.3%) |
| 55 to 64 Years | 6 (1.0%) | 29 (4.0%) |
| 65 to 74 Years | 0 (0.0%) | 11 (2.3%) |
| 75 Years and over | 10 (4.8%) | 23 (7.0%) |
| Total | 184 (4.5%) | 157 (3.3%) |
Income Above Poverty by Sex and Age in Bogota borough
According to the poverty statistics in Bogota borough, males aged 12 to 14 years and females aged under 5 years are the age groups that are most secure financially, with 100.0% of males and 100.0% of females in these age groups living above the poverty line.
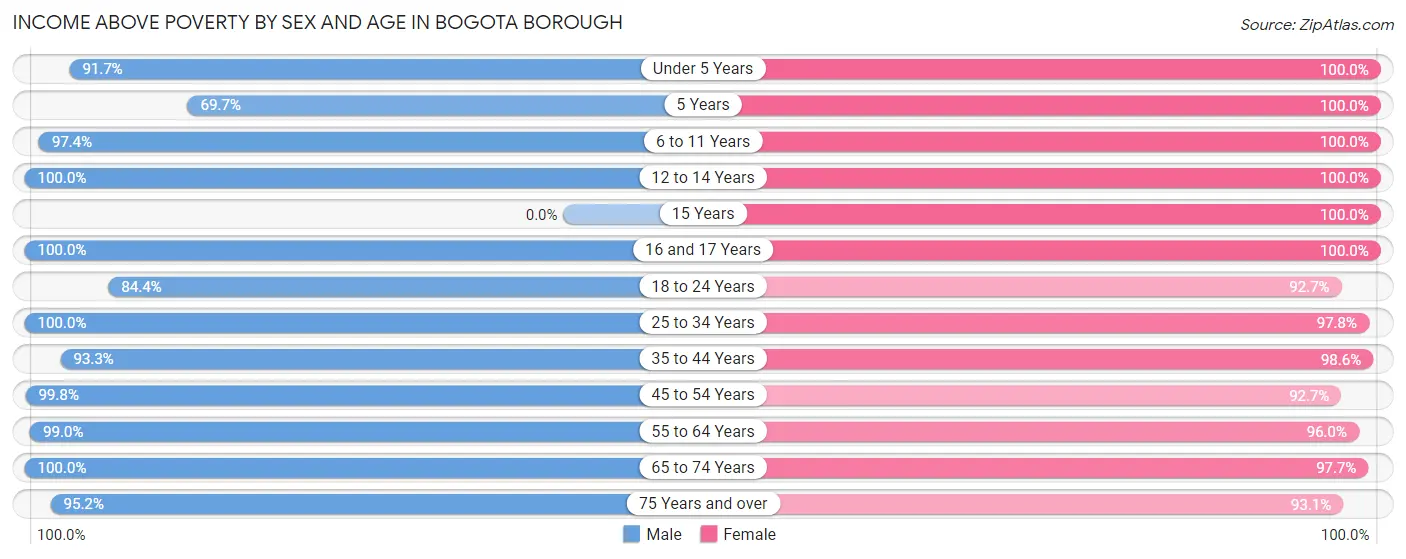
| Age Bracket | Male | Female |
| Under 5 Years | 121 (91.7%) | 358 (100.0%) |
| 5 Years | 106 (69.7%) | 68 (100.0%) |
| 6 to 11 Years | 369 (97.4%) | 281 (100.0%) |
| 12 to 14 Years | 101 (100.0%) | 137 (100.0%) |
| 15 Years | 0 (0.0%) | 34 (100.0%) |
| 16 and 17 Years | 76 (100.0%) | 56 (100.0%) |
| 18 to 24 Years | 217 (84.4%) | 459 (92.7%) |
| 25 to 34 Years | 253 (100.0%) | 537 (97.8%) |
| 35 to 44 Years | 841 (93.3%) | 838 (98.6%) |
| 45 to 54 Years | 602 (99.8%) | 431 (92.7%) |
| 55 to 64 Years | 574 (99.0%) | 688 (96.0%) |
| 65 to 74 Years | 474 (100.0%) | 468 (97.7%) |
| 75 Years and over | 197 (95.2%) | 308 (93.0%) |
| Total | 3,931 (95.5%) | 4,663 (96.7%) |
Income Below Poverty Among Married-Couple Families in Bogota borough
The poverty statistics for married-couple families in Bogota borough show that 0.6% or 10 of the total 1,640 families live below the poverty line. Families with no children have the highest poverty rate of 1.0%, comprising of 10 families. On the other hand, families with 1 or 2 children have the lowest poverty rate of 0.0%, which includes 0 families.
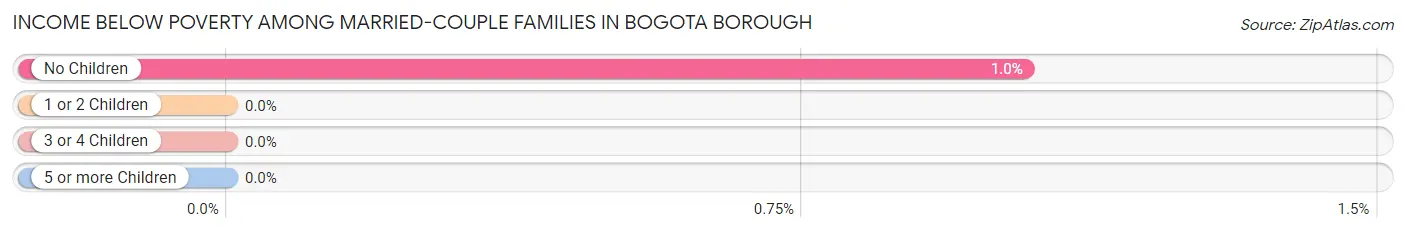
| Children | Above Poverty | Below Poverty |
| No Children | 947 (99.0%) | 10 (1.0%) |
| 1 or 2 Children | 602 (100.0%) | 0 (0.0%) |
| 3 or 4 Children | 81 (100.0%) | 0 (0.0%) |
| 5 or more Children | 0 (0.0%) | 0 (0.0%) |
| Total | 1,630 (99.4%) | 10 (0.6%) |
Income Below Poverty Among Single-Parent Households in Bogota borough
According to the poverty data in Bogota borough, 19.8% or 60 single-father households and 6.6% or 23 single-mother households are living below the poverty line. Among single-father households, those with 1 or 2 children have the highest poverty rate, with 60 households (30.5%) experiencing poverty. Likewise, among single-mother households, those with no children have the highest poverty rate, with 11 households (10.4%) falling below the poverty line.
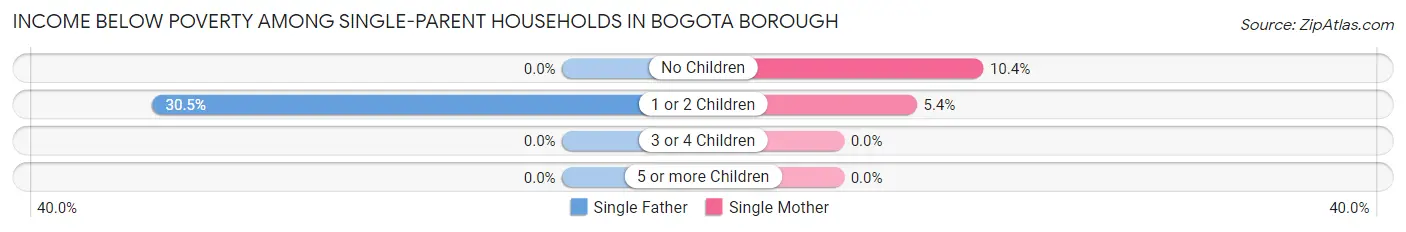
| Children | Single Father | Single Mother |
| No Children | 0 (0.0%) | 11 (10.4%) |
| 1 or 2 Children | 60 (30.5%) | 12 (5.4%) |
| 3 or 4 Children | 0 (0.0%) | 0 (0.0%) |
| 5 or more Children | 0 (0.0%) | 0 (0.0%) |
| Total | 60 (19.8%) | 23 (6.6%) |
Income Below Poverty Among Married-Couple vs Single-Parent Households in Bogota borough
The poverty data for Bogota borough shows that 10 of the married-couple family households (0.6%) and 83 of the single-parent households (12.7%) are living below the poverty level. Within the married-couple family households, those with no children have the highest poverty rate, with 10 households (1.0%) falling below the poverty line. Among the single-parent households, those with 1 or 2 children have the highest poverty rate, with 72 household (17.2%) living below poverty.
| Children | Married-Couple Families | Single-Parent Households |
| No Children | 10 (1.0%) | 11 (5.2%) |
| 1 or 2 Children | 0 (0.0%) | 72 (17.2%) |
| 3 or 4 Children | 0 (0.0%) | 0 (0.0%) |
| 5 or more Children | 0 (0.0%) | 0 (0.0%) |
| Total | 10 (0.6%) | 83 (12.7%) |
Race in Bogota borough
The most populous races in Bogota borough are White / Caucasian (4,559 | 51.0%), Hispanic or Latino (4,498 | 50.3%), and Some other Race (1,421 | 15.9%).
| Race | # Population | % Population |
| Asian | 729 | 8.2% |
| Black / African American | 1,156 | 12.9% |
| Hawaiian / Pacific | 0 | 0.0% |
| Hispanic or Latino | 4,498 | 50.3% |
| Native / Alaskan | 65 | 0.7% |
| White / Caucasian | 4,559 | 51.0% |
| Two or more Races | 1,010 | 11.3% |
| Some other Race | 1,421 | 15.9% |
| Total | 8,940 | 100.0% |
Ancestry in Bogota borough
The most populous ancestries reported in Bogota borough are Dominican (1,727 | 19.3%), South American (1,333 | 14.9%), Irish (1,017 | 11.4%), Puerto Rican (854 | 9.6%), and Italian (656 | 7.3%), together accounting for 62.5% of all Bogota borough residents.
| Ancestry | # Population | % Population |
| Albanian | 48 | 0.5% |
| American | 208 | 2.3% |
| Arab | 135 | 1.5% |
| Argentinean | 60 | 0.7% |
| Austrian | 61 | 0.7% |
| British | 34 | 0.4% |
| Bulgarian | 25 | 0.3% |
| Burmese | 62 | 0.7% |
| Canadian | 26 | 0.3% |
| Central American | 309 | 3.5% |
| Central American Indian | 71 | 0.8% |
| Colombian | 602 | 6.7% |
| Costa Rican | 32 | 0.4% |
| Croatian | 10 | 0.1% |
| Cuban | 67 | 0.7% |
| Cypriot | 12 | 0.1% |
| Czech | 13 | 0.2% |
| Czechoslovakian | 13 | 0.2% |
| Dominican | 1,727 | 19.3% |
| Dutch | 13 | 0.2% |
| Eastern European | 18 | 0.2% |
| Ecuadorian | 619 | 6.9% |
| English | 286 | 3.2% |
| Estonian | 12 | 0.1% |
| Filipino | 10 | 0.1% |
| French | 57 | 0.6% |
| German | 460 | 5.1% |
| Greek | 10 | 0.1% |
| Guatemalan | 21 | 0.2% |
| Honduran | 73 | 0.8% |
| Hungarian | 90 | 1.0% |
| Indian (Asian) | 19 | 0.2% |
| Irish | 1,017 | 11.4% |
| Israeli | 13 | 0.2% |
| Italian | 656 | 7.3% |
| Jamaican | 342 | 3.8% |
| Jordanian | 51 | 0.6% |
| Korean | 347 | 3.9% |
| Latvian | 13 | 0.2% |
| Lebanese | 49 | 0.5% |
| Mexican | 70 | 0.8% |
| Mexican American Indian | 45 | 0.5% |
| Nigerian | 31 | 0.4% |
| Norwegian | 16 | 0.2% |
| Palestinian | 22 | 0.3% |
| Peruvian | 52 | 0.6% |
| Polish | 142 | 1.6% |
| Portuguese | 15 | 0.2% |
| Puerto Rican | 854 | 9.6% |
| Romanian | 28 | 0.3% |
| Russian | 13 | 0.2% |
| Salvadoran | 183 | 2.1% |
| Scandinavian | 14 | 0.2% |
| Scottish | 16 | 0.2% |
| Slavic | 13 | 0.2% |
| Slovak | 21 | 0.2% |
| South American | 1,333 | 14.9% |
| Spaniard | 28 | 0.3% |
| Spanish | 13 | 0.2% |
| Subsaharan African | 31 | 0.4% |
| Swedish | 10 | 0.1% |
| Swiss | 26 | 0.3% |
| Thai | 145 | 1.6% |
| Trinidadian and Tobagonian | 103 | 1.1% |
| Ukrainian | 34 | 0.4% |
| Vietnamese | 202 | 2.3% |
| West Indian | 212 | 2.4% | View All 67 Rows |
Immigrants in Bogota borough
The most numerous immigrant groups reported in Bogota borough came from Latin America (2,097 | 23.5%), Caribbean (1,076 | 12.0%), South America (841 | 9.4%), Dominican Republic (703 | 7.9%), and Asia (577 | 6.5%), together accounting for 59.2% of all Bogota borough residents.
| Immigration Origin | # Population | % Population |
| Africa | 31 | 0.4% |
| Albania | 25 | 0.3% |
| Argentina | 24 | 0.3% |
| Asia | 577 | 6.5% |
| Bangladesh | 161 | 1.8% |
| Barbados | 13 | 0.2% |
| Bulgaria | 25 | 0.3% |
| Canada | 57 | 0.6% |
| Caribbean | 1,076 | 12.0% |
| Central America | 180 | 2.0% |
| China | 14 | 0.2% |
| Colombia | 358 | 4.0% |
| Costa Rica | 32 | 0.4% |
| Croatia | 10 | 0.1% |
| Cuba | 14 | 0.2% |
| Dominica | 37 | 0.4% |
| Dominican Republic | 703 | 7.9% |
| Eastern Asia | 71 | 0.8% |
| Eastern Europe | 122 | 1.4% |
| Ecuador | 355 | 4.0% |
| El Salvador | 82 | 0.9% |
| England | 20 | 0.2% |
| Europe | 292 | 3.3% |
| Germany | 29 | 0.3% |
| Guatemala | 21 | 0.2% |
| Guyana | 67 | 0.7% |
| India | 47 | 0.5% |
| Ireland | 51 | 0.6% |
| Israel | 13 | 0.2% |
| Italy | 42 | 0.5% |
| Jamaica | 253 | 2.8% |
| Jordan | 10 | 0.1% |
| Korea | 57 | 0.6% |
| Latin America | 2,097 | 23.5% |
| Latvia | 13 | 0.2% |
| Mexico | 45 | 0.5% |
| Nigeria | 31 | 0.4% |
| Northern Europe | 71 | 0.8% |
| Peru | 37 | 0.4% |
| Philippines | 220 | 2.5% |
| Romania | 37 | 0.4% |
| South America | 841 | 9.4% |
| South Central Asia | 252 | 2.8% |
| South Eastern Asia | 220 | 2.5% |
| Southern Europe | 59 | 0.7% |
| Spain | 17 | 0.2% |
| Sri Lanka | 44 | 0.5% |
| Switzerland | 11 | 0.1% |
| Trinidad and Tobago | 56 | 0.6% |
| Western Africa | 31 | 0.4% |
| Western Asia | 23 | 0.3% |
| Western Europe | 40 | 0.4% | View All 52 Rows |
Sex and Age in Bogota borough
Sex and Age in Bogota borough
The most populous age groups in Bogota borough are 40 to 44 Years (546 | 13.3%) for men and 35 to 39 Years (448 | 9.3%) for women.
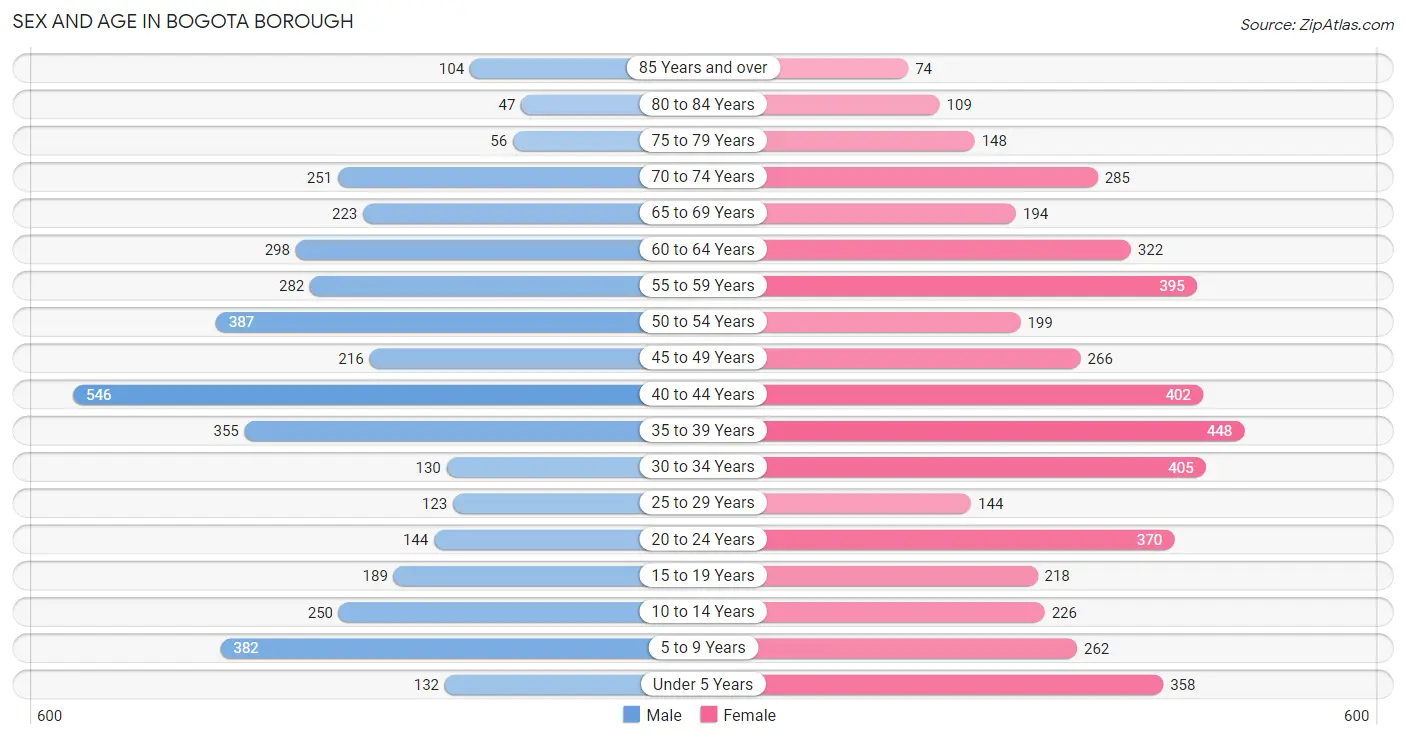
| Age Bracket | Male | Female |
| Under 5 Years | 132 (3.2%) | 358 (7.4%) |
| 5 to 9 Years | 382 (9.3%) | 262 (5.4%) |
| 10 to 14 Years | 250 (6.1%) | 226 (4.7%) |
| 15 to 19 Years | 189 (4.6%) | 218 (4.5%) |
| 20 to 24 Years | 144 (3.5%) | 370 (7.7%) |
| 25 to 29 Years | 123 (3.0%) | 144 (3.0%) |
| 30 to 34 Years | 130 (3.2%) | 405 (8.4%) |
| 35 to 39 Years | 355 (8.6%) | 448 (9.3%) |
| 40 to 44 Years | 546 (13.3%) | 402 (8.3%) |
| 45 to 49 Years | 216 (5.2%) | 266 (5.5%) |
| 50 to 54 Years | 387 (9.4%) | 199 (4.1%) |
| 55 to 59 Years | 282 (6.9%) | 395 (8.2%) |
| 60 to 64 Years | 298 (7.2%) | 322 (6.7%) |
| 65 to 69 Years | 223 (5.4%) | 194 (4.0%) |
| 70 to 74 Years | 251 (6.1%) | 285 (5.9%) |
| 75 to 79 Years | 56 (1.4%) | 148 (3.1%) |
| 80 to 84 Years | 47 (1.1%) | 109 (2.3%) |
| 85 Years and over | 104 (2.5%) | 74 (1.5%) |
| Total | 4,115 (100.0%) | 4,825 (100.0%) |
Families and Households in Bogota borough
Median Family Size in Bogota borough
The median family size in Bogota borough is 3.20 persons per family, with married-couple families (1,640 | 71.6%) accounting for the largest median family size of 3.39 persons per family. On the other hand, single male/father families (303 | 13.2%) represent the smallest median family size with 2.20 persons per family.
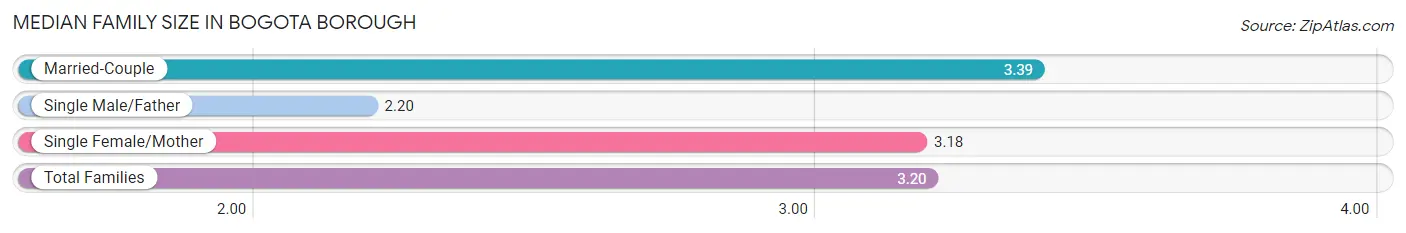
| Family Type | # Families | Family Size |
| Married-Couple | 1,640 (71.6%) | 3.39 |
| Single Male/Father | 303 (13.2%) | 2.20 |
| Single Female/Mother | 349 (15.2%) | 3.18 |
| Total Families | 2,292 (100.0%) | 3.20 |
Median Household Size in Bogota borough
The median household size in Bogota borough is 2.78 persons per household, with single female/mother households (349 | 10.9%) accounting for the largest median household size of 3.8 persons per household. non-family households (907 | 28.3%) represent the smallest median household size with 1.16 persons per household.
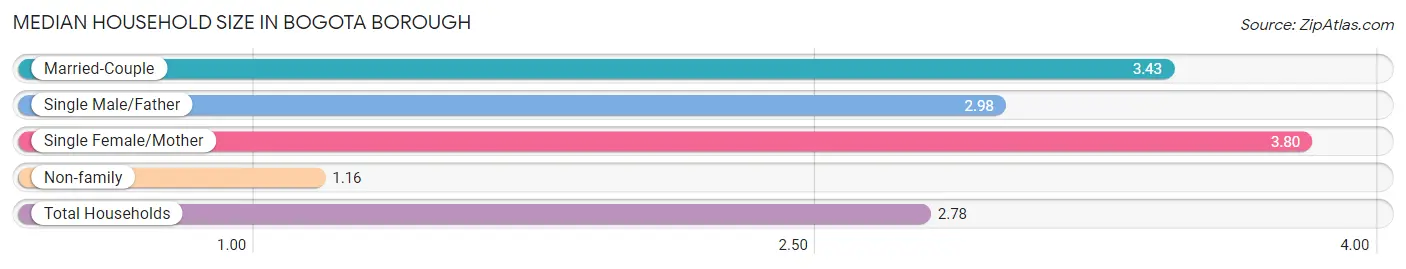
| Household Type | # Households | Household Size |
| Married-Couple | 1,640 (51.3%) | 3.43 |
| Single Male/Father | 303 (9.5%) | 2.98 |
| Single Female/Mother | 349 (10.9%) | 3.80 |
| Non-family | 907 (28.3%) | 1.16 |
| Total Households | 3,199 (100.0%) | 2.78 |
Household Size by Marriage Status in Bogota borough
Out of a total of 3,199 households in Bogota borough, 2,292 (71.7%) are family households, while 907 (28.3%) are nonfamily households. The most numerous type of family households are 2-person households, comprising 749, and the most common type of nonfamily households are 1-person households, comprising 783.
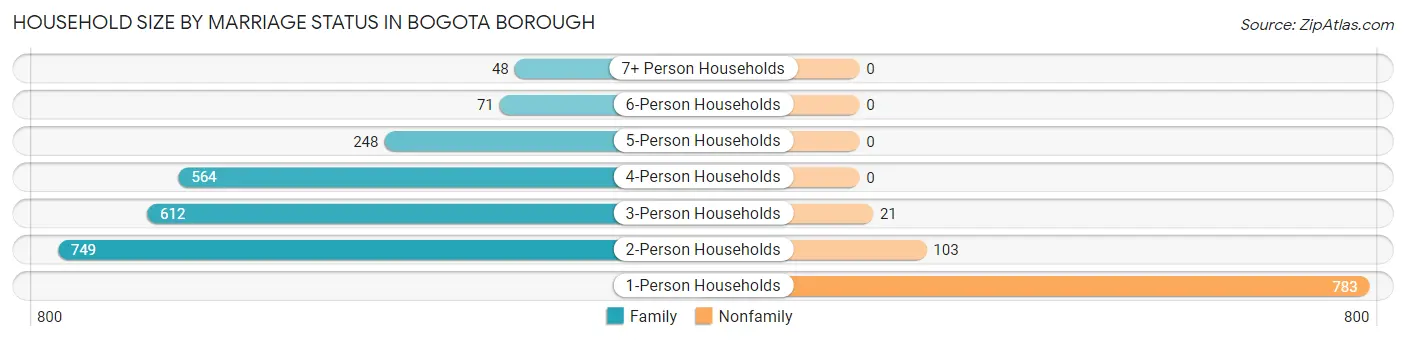
| Household Size | Family Households | Nonfamily Households |
| 1-Person Households | - | 783 (24.5%) |
| 2-Person Households | 749 (23.4%) | 103 (3.2%) |
| 3-Person Households | 612 (19.1%) | 21 (0.7%) |
| 4-Person Households | 564 (17.6%) | 0 (0.0%) |
| 5-Person Households | 248 (7.7%) | 0 (0.0%) |
| 6-Person Households | 71 (2.2%) | 0 (0.0%) |
| 7+ Person Households | 48 (1.5%) | 0 (0.0%) |
| Total | 2,292 (71.7%) | 907 (28.3%) |
Female Fertility in Bogota borough
Fertility by Age in Bogota borough
Average fertility rate in Bogota borough is 61.0 births per 1,000 women. Women in the age bracket of 20 to 34 years have the highest fertility rate with 70.0 births per 1,000 women. Women in the age bracket of 35 to 50 years acount for 53.3% of all women with births.
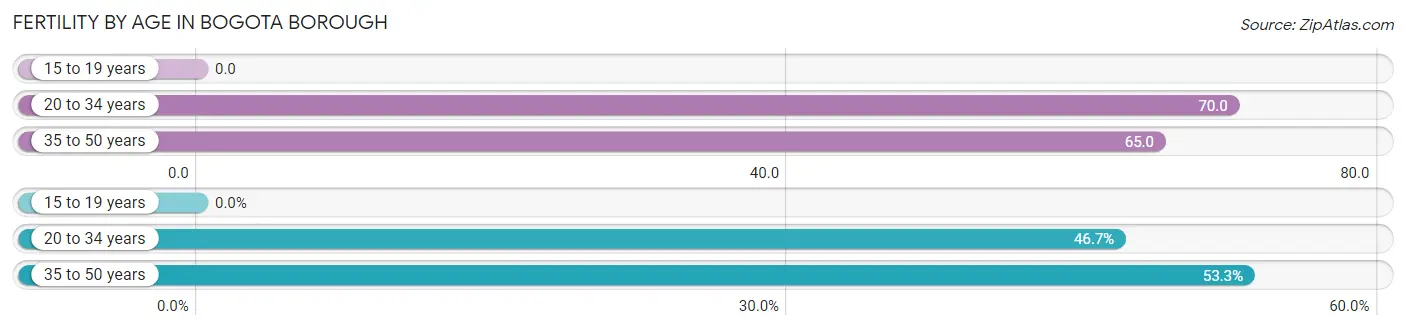
| Age Bracket | Women with Births | Births / 1,000 Women |
| 15 to 19 years | 0 (0.0%) | 0.0 |
| 20 to 34 years | 64 (46.7%) | 70.0 |
| 35 to 50 years | 73 (53.3%) | 65.0 |
| Total | 137 (100.0%) | 61.0 |
Fertility by Age by Marriage Status in Bogota borough
59.1% of women with births (137) in Bogota borough are married. The highest percentage of unmarried women with births falls into 20 to 34 years age bracket with 65.6% of them unmarried at the time of birth, while the lowest percentage of unmarried women with births belong to 35 to 50 years age bracket with 19.2% of them unmarried.
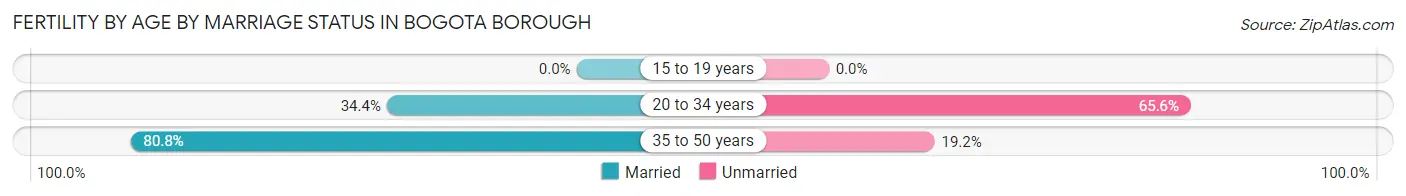
| Age Bracket | Married | Unmarried |
| 15 to 19 years | 0 (0.0%) | 0 (0.0%) |
| 20 to 34 years | 22 (34.4%) | 42 (65.6%) |
| 35 to 50 years | 59 (80.8%) | 14 (19.2%) |
| Total | 81 (59.1%) | 56 (40.9%) |
Fertility by Education in Bogota borough
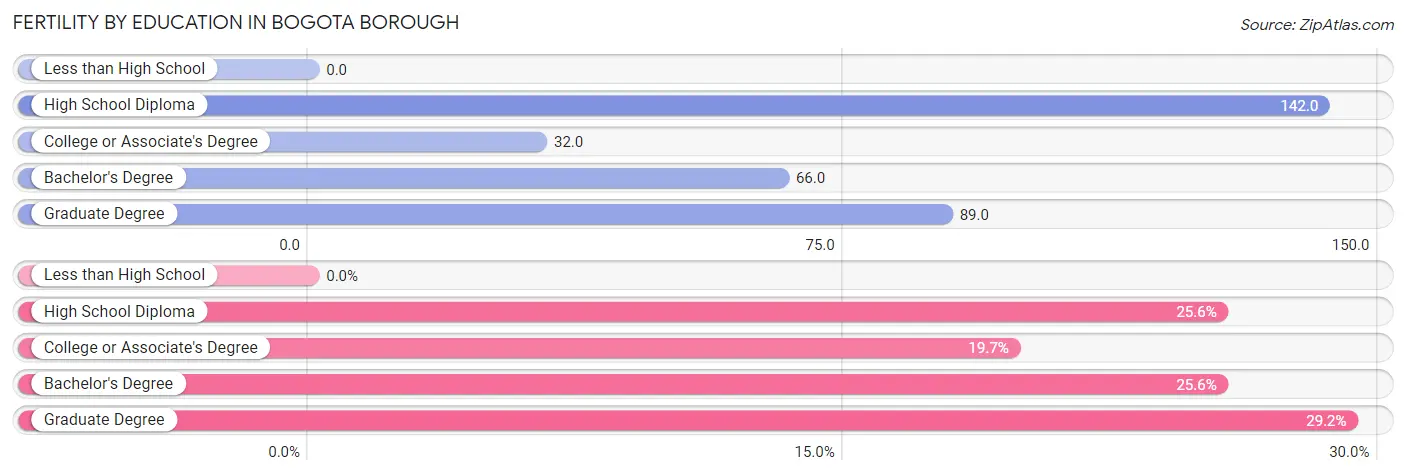
| Educational Attainment | Women with Births | Births / 1,000 Women |
| Less than High School | 0 (0.0%) | 0.0 |
| High School Diploma | 35 (25.6%) | 142.0 |
| College or Associate's Degree | 27 (19.7%) | 32.0 |
| Bachelor's Degree | 35 (25.6%) | 66.0 |
| Graduate Degree | 40 (29.2%) | 89.0 |
| Total | 137 (100.0%) | 61.0 |
Fertility by Education by Marriage Status in Bogota borough
40.9% of women with births in Bogota borough are unmarried. Women with the educational attainment of graduate degree are most likely to be married with 100.0% of them married at childbirth, while women with the educational attainment of high school diploma are least likely to be married with 74.3% of them unmarried at childbirth.
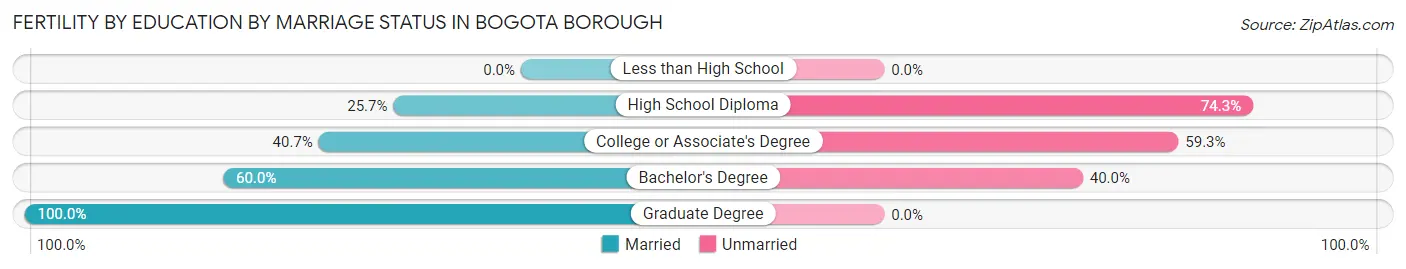
| Educational Attainment | Married | Unmarried |
| Less than High School | 0 (0.0%) | 0 (0.0%) |
| High School Diploma | 9 (25.7%) | 26 (74.3%) |
| College or Associate's Degree | 11 (40.7%) | 16 (59.3%) |
| Bachelor's Degree | 21 (60.0%) | 14 (40.0%) |
| Graduate Degree | 40 (100.0%) | 0 (0.0%) |
| Total | 81 (59.1%) | 56 (40.9%) |
Employment Characteristics in Bogota borough
Employment by Class of Employer in Bogota borough
Among the 4,598 employed individuals in Bogota borough, private company employees (3,174 | 69.0%), local government employees (558 | 12.1%), and not-for-profit organizations (474 | 10.3%) make up the most common classes of employment.
| Employer Class | # Employees | % Employees |
| Private Company Employees | 3,174 | 69.0% |
| Self-Employed (Incorporated) | 33 | 0.7% |
| Self-Employed (Not Incorporated) | 185 | 4.0% |
| Not-for-profit Organizations | 474 | 10.3% |
| Local Government Employees | 558 | 12.1% |
| State Government Employees | 105 | 2.3% |
| Federal Government Employees | 69 | 1.5% |
| Unpaid Family Workers | 0 | 0.0% |
| Total | 4,598 | 100.0% |
Employment Status by Age in Bogota borough
According to the labor force statistics for Bogota borough, out of the total population over 16 years of age (7,296), 69.0% or 5,034 individuals are in the labor force, with 6.5% or 327 of them unemployed. The age group with the highest labor force participation rate is 30 to 34 years, with 89.5% or 479 individuals in the labor force. Within the labor force, the 16 to 19 years age range has the highest percentage of unemployed individuals, with 63.1% or 77 of them being unemployed.
| Age Bracket | In Labor Force | Unemployed |
| 16 to 19 Years | 122 (32.7%) | 77 (63.1%) |
| 20 to 24 Years | 431 (83.9%) | 39 (9.0%) |
| 25 to 29 Years | 232 (86.9%) | 20 (8.6%) |
| 30 to 34 Years | 479 (89.5%) | 86 (18.0%) |
| 35 to 44 Years | 1,448 (82.7%) | 22 (1.5%) |
| 45 to 54 Years | 948 (88.8%) | 28 (3.0%) |
| 55 to 59 Years | 540 (79.8%) | 21 (3.9%) |
| 60 to 64 Years | 393 (63.4%) | 13 (3.3%) |
| 65 to 74 Years | 417 (43.8%) | 21 (5.0%) |
| 75 Years and over | 21 (3.9%) | 0 (0.0%) |
| Total | 5,034 (69.0%) | 327 (6.5%) |
Employment Status by Educational Attainment in Bogota borough
According to labor force statistics for Bogota borough, 82.1% of individuals (4,038) out of the total population between 25 and 64 years of age (4,918) are in the labor force, with 4.7% or 190 of them being unemployed. The group with the highest labor force participation rate are those with the educational attainment of bachelor's degree or higher, with 87.3% or 1,859 individuals in the labor force. Within the labor force, individuals with college / associate degree education have the highest percentage of unemployment, with 9.6% or 118 of them being unemployed.
| Educational Attainment | In Labor Force | Unemployed |
| Less than High School | 241 (58.2%) | 0 (0.0%) |
| High School Diploma | 706 (86.6%) | 33 (4.0%) |
| College / Associate Degree | 1,233 (79.1%) | 150 (9.6%) |
| Bachelor's Degree or higher | 1,859 (87.3%) | 51 (2.4%) |
| Total | 4,038 (82.1%) | 231 (4.7%) |
Employment Occupations by Sex in Bogota borough
Management, Business, Science and Arts Occupations
The most common Management, Business, Science and Arts occupations in Bogota borough are Management (659 | 14.1%), Community & Social Service (642 | 13.7%), Computers, Engineering & Science (522 | 11.2%), Education Instruction & Library (319 | 6.8%), and Computers & Mathematics (273 | 5.8%).
Management, Business, Science and Arts Occupations by Sex
Within the Management, Business, Science and Arts occupations in Bogota borough, the most male-oriented occupations are Architecture & Engineering (90.4%), Computers, Engineering & Science (78.9%), and Life, Physical & Social Science (76.6%), while the most female-oriented occupations are Legal Services & Support (100.0%), Education Instruction & Library (91.5%), and Health Diagnosing & Treating (86.7%).
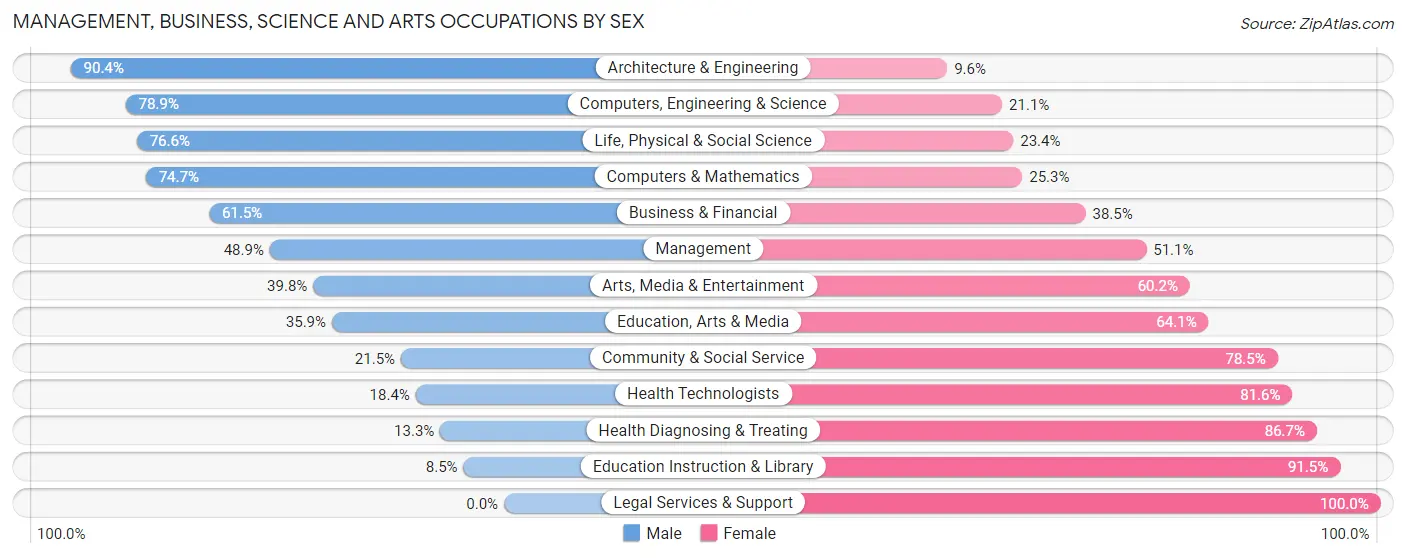
| Occupation | Male | Female |
| Management | 322 (48.9%) | 337 (51.1%) |
| Business & Financial | 104 (61.5%) | 65 (38.5%) |
| Computers, Engineering & Science | 412 (78.9%) | 110 (21.1%) |
| Computers & Mathematics | 204 (74.7%) | 69 (25.3%) |
| Architecture & Engineering | 113 (90.4%) | 12 (9.6%) |
| Life, Physical & Social Science | 95 (76.6%) | 29 (23.4%) |
| Community & Social Service | 138 (21.5%) | 504 (78.5%) |
| Education, Arts & Media | 70 (35.9%) | 125 (64.1%) |
| Legal Services & Support | 0 (0.0%) | 25 (100.0%) |
| Education Instruction & Library | 27 (8.5%) | 292 (91.5%) |
| Arts, Media & Entertainment | 41 (39.8%) | 62 (60.2%) |
| Health Diagnosing & Treating | 35 (13.3%) | 228 (86.7%) |
| Health Technologists | 35 (18.4%) | 155 (81.6%) |
| Total (Category) | 1,011 (44.8%) | 1,244 (55.2%) |
| Total (Overall) | 2,311 (49.4%) | 2,366 (50.6%) |
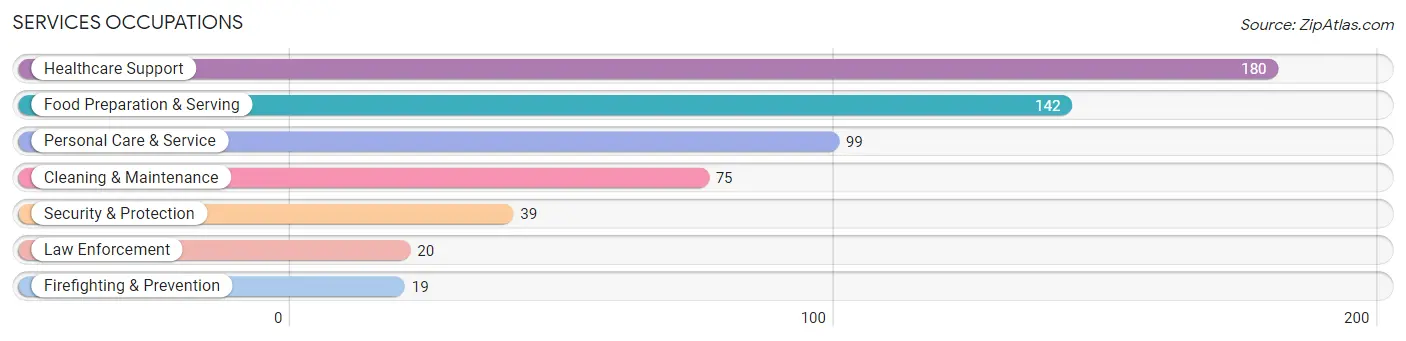
Services Occupations
The most common Services occupations in Bogota borough are Healthcare Support (180 | 3.8%), Food Preparation & Serving (142 | 3.0%), Personal Care & Service (99 | 2.1%), Cleaning & Maintenance (75 | 1.6%), and Security & Protection (39 | 0.8%).
Services Occupations by Sex
Within the Services occupations in Bogota borough, the most male-oriented occupations are Security & Protection (100.0%), Firefighting & Prevention (100.0%), and Law Enforcement (100.0%), while the most female-oriented occupations are Personal Care & Service (100.0%), Healthcare Support (77.2%), and Cleaning & Maintenance (56.0%).
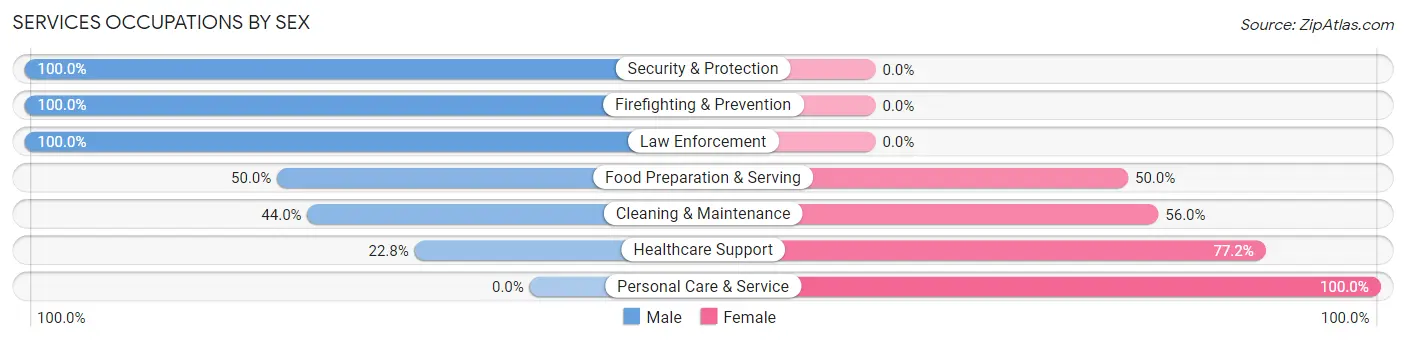
| Occupation | Male | Female |
| Healthcare Support | 41 (22.8%) | 139 (77.2%) |
| Security & Protection | 39 (100.0%) | 0 (0.0%) |
| Firefighting & Prevention | 19 (100.0%) | 0 (0.0%) |
| Law Enforcement | 20 (100.0%) | 0 (0.0%) |
| Food Preparation & Serving | 71 (50.0%) | 71 (50.0%) |
| Cleaning & Maintenance | 33 (44.0%) | 42 (56.0%) |
| Personal Care & Service | 0 (0.0%) | 99 (100.0%) |
| Total (Category) | 184 (34.4%) | 351 (65.6%) |
| Total (Overall) | 2,311 (49.4%) | 2,366 (50.6%) |
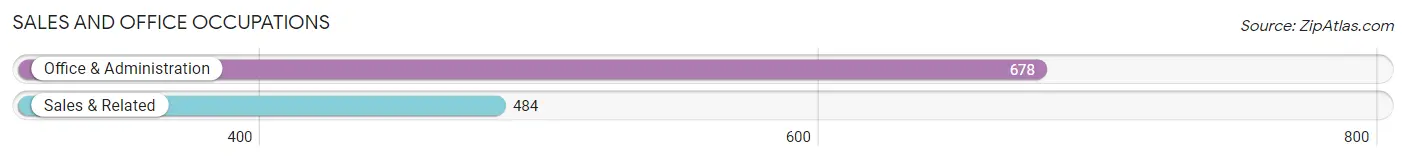
Sales and Office Occupations
The most common Sales and Office occupations in Bogota borough are Office & Administration (678 | 14.5%), and Sales & Related (484 | 10.3%).
Sales and Office Occupations by Sex
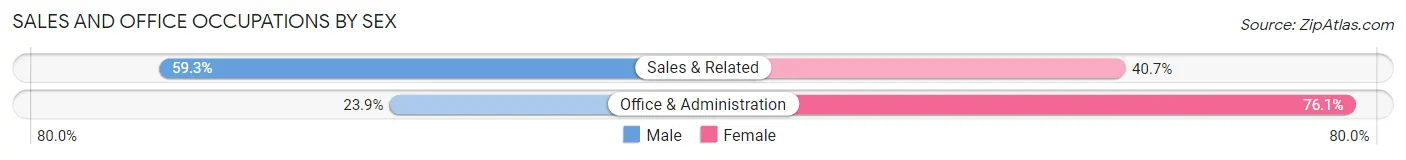
| Occupation | Male | Female |
| Sales & Related | 287 (59.3%) | 197 (40.7%) |
| Office & Administration | 162 (23.9%) | 516 (76.1%) |
| Total (Category) | 449 (38.6%) | 713 (61.4%) |
| Total (Overall) | 2,311 (49.4%) | 2,366 (50.6%) |
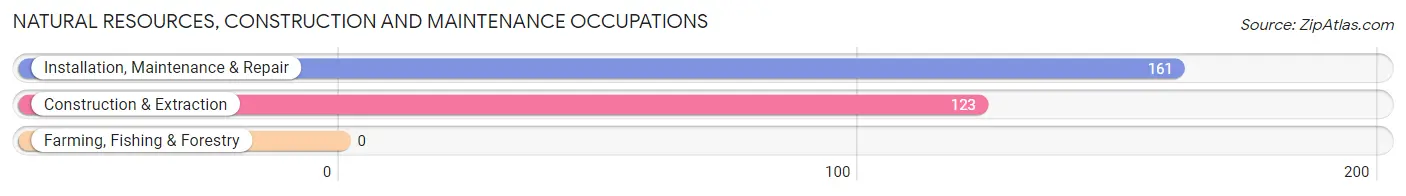
Natural Resources, Construction and Maintenance Occupations
The most common Natural Resources, Construction and Maintenance occupations in Bogota borough are Installation, Maintenance & Repair (161 | 3.4%), and Construction & Extraction (123 | 2.6%).
Natural Resources, Construction and Maintenance Occupations by Sex
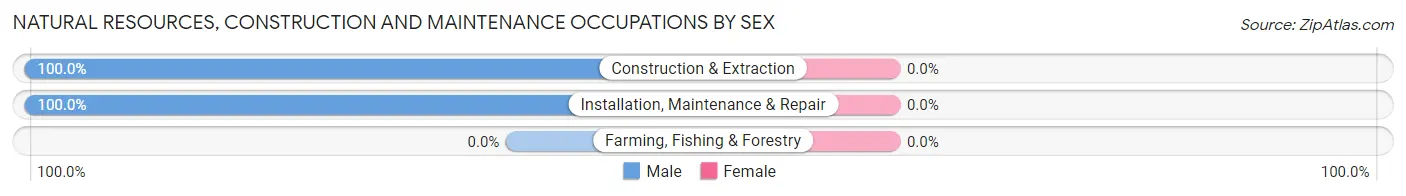
| Occupation | Male | Female |
| Farming, Fishing & Forestry | 0 (0.0%) | 0 (0.0%) |
| Construction & Extraction | 123 (100.0%) | 0 (0.0%) |
| Installation, Maintenance & Repair | 161 (100.0%) | 0 (0.0%) |
| Total (Category) | 284 (100.0%) | 0 (0.0%) |
| Total (Overall) | 2,311 (49.4%) | 2,366 (50.6%) |
Production, Transportation and Moving Occupations
The most common Production, Transportation and Moving occupations in Bogota borough are Material Moving (162 | 3.5%), Transportation (144 | 3.1%), and Production (135 | 2.9%).
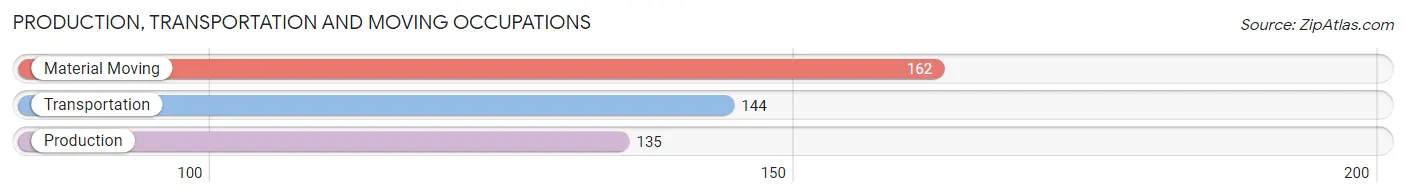
Production, Transportation and Moving Occupations by Sex
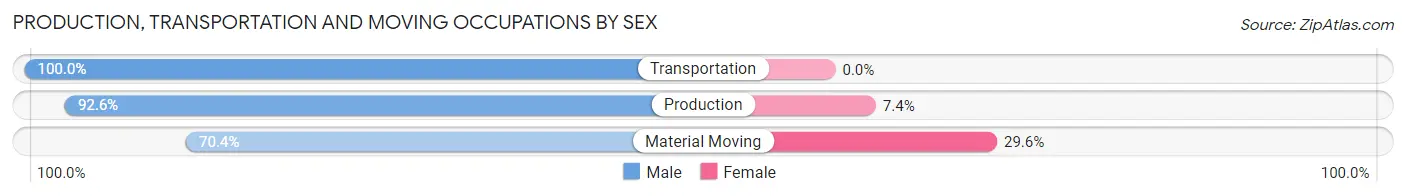
| Occupation | Male | Female |
| Production | 125 (92.6%) | 10 (7.4%) |
| Transportation | 144 (100.0%) | 0 (0.0%) |
| Material Moving | 114 (70.4%) | 48 (29.6%) |
| Total (Category) | 383 (86.9%) | 58 (13.2%) |
| Total (Overall) | 2,311 (49.4%) | 2,366 (50.6%) |
Employment Industries by Sex in Bogota borough
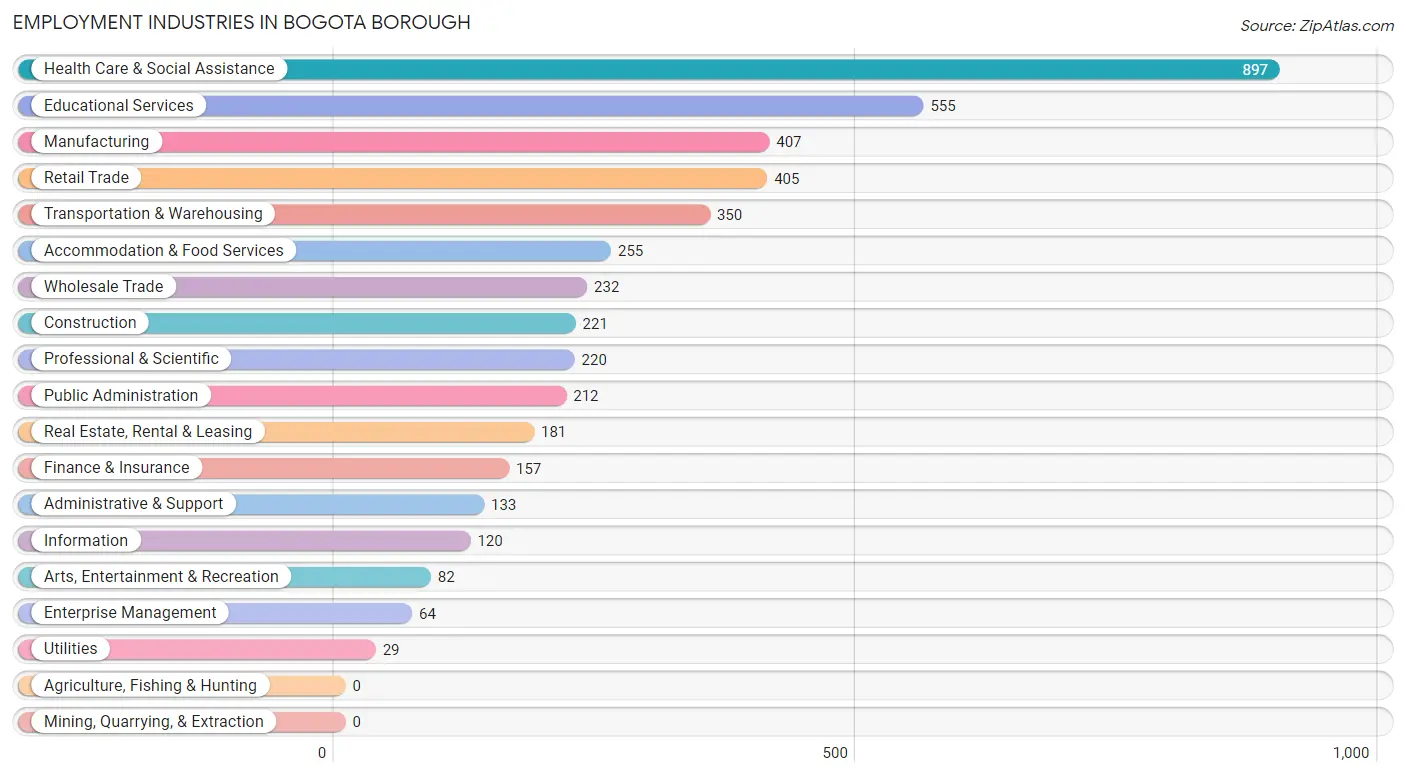
Employment Industries in Bogota borough
The major employment industries in Bogota borough include Health Care & Social Assistance (897 | 19.2%), Educational Services (555 | 11.9%), Manufacturing (407 | 8.7%), Retail Trade (405 | 8.7%), and Transportation & Warehousing (350 | 7.5%).
Employment Industries by Sex in Bogota borough
The Bogota borough industries that see more men than women are Utilities (100.0%), Construction (89.1%), and Manufacturing (79.8%), whereas the industries that tend to have a higher number of women are Enterprise Management (100.0%), Health Care & Social Assistance (84.7%), and Educational Services (82.7%).
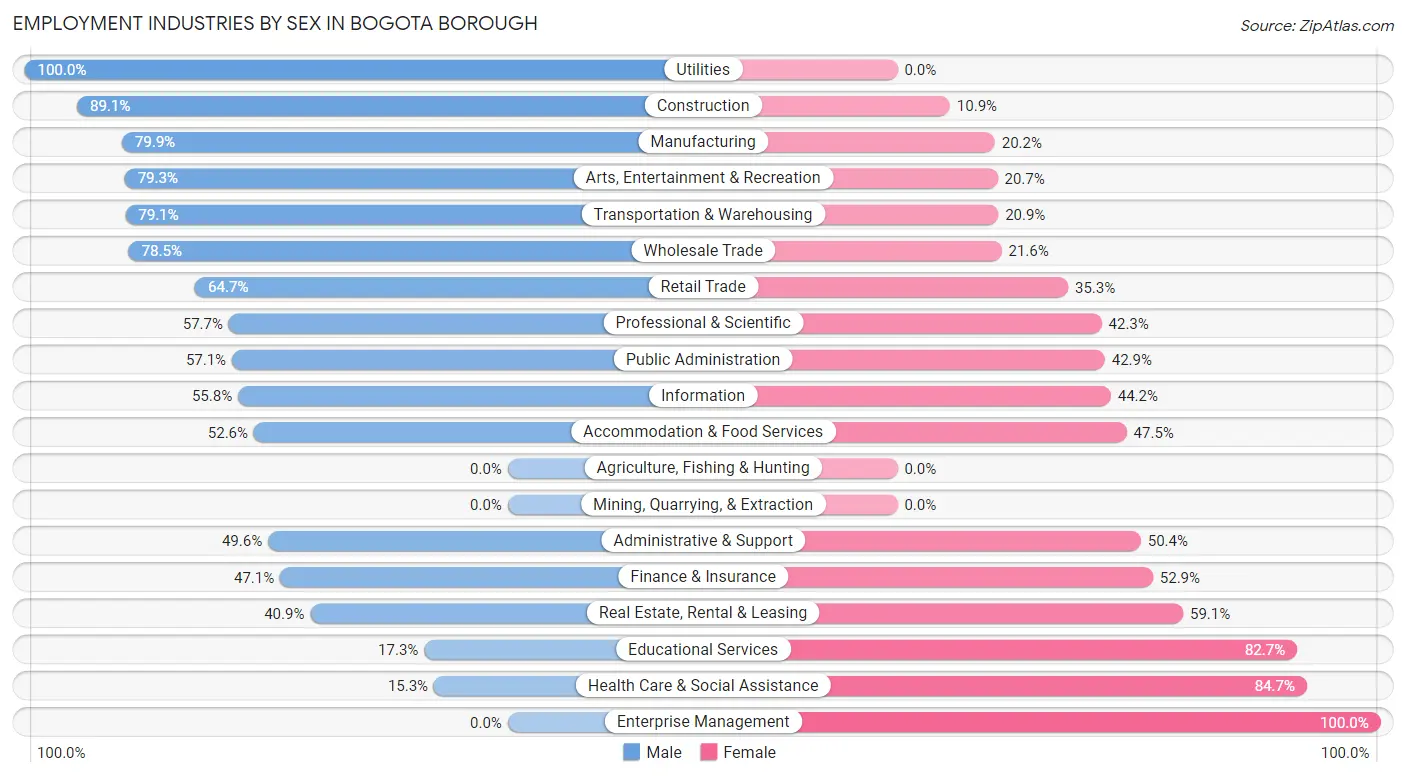
| Industry | Male | Female |
| Agriculture, Fishing & Hunting | 0 (0.0%) | 0 (0.0%) |
| Mining, Quarrying, & Extraction | 0 (0.0%) | 0 (0.0%) |
| Construction | 197 (89.1%) | 24 (10.9%) |
| Manufacturing | 325 (79.8%) | 82 (20.2%) |
| Wholesale Trade | 182 (78.4%) | 50 (21.5%) |
| Retail Trade | 262 (64.7%) | 143 (35.3%) |
| Transportation & Warehousing | 277 (79.1%) | 73 (20.9%) |
| Utilities | 29 (100.0%) | 0 (0.0%) |
| Information | 67 (55.8%) | 53 (44.2%) |
| Finance & Insurance | 74 (47.1%) | 83 (52.9%) |
| Real Estate, Rental & Leasing | 74 (40.9%) | 107 (59.1%) |
| Professional & Scientific | 127 (57.7%) | 93 (42.3%) |
| Enterprise Management | 0 (0.0%) | 64 (100.0%) |
| Administrative & Support | 66 (49.6%) | 67 (50.4%) |
| Educational Services | 96 (17.3%) | 459 (82.7%) |
| Health Care & Social Assistance | 137 (15.3%) | 760 (84.7%) |
| Arts, Entertainment & Recreation | 65 (79.3%) | 17 (20.7%) |
| Accommodation & Food Services | 134 (52.5%) | 121 (47.4%) |
| Public Administration | 121 (57.1%) | 91 (42.9%) |
| Total | 2,311 (49.4%) | 2,366 (50.6%) |
Education in Bogota borough
School Enrollment in Bogota borough
The most common levels of schooling among the 1,993 students in Bogota borough are college / undergraduate (425 | 21.3%), elementary school (422 | 21.2%), and high school (317 | 15.9%).
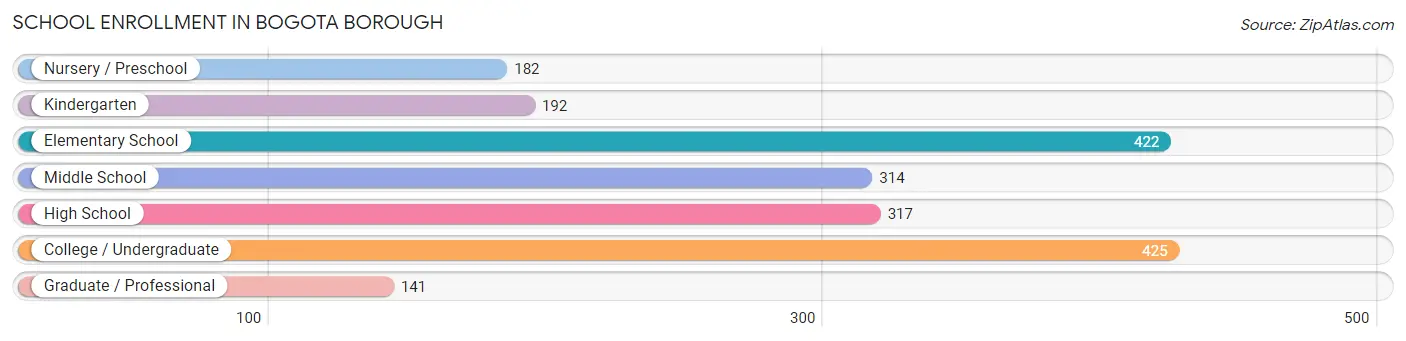
| School Level | # Students | % Students |
| Nursery / Preschool | 182 | 9.1% |
| Kindergarten | 192 | 9.6% |
| Elementary School | 422 | 21.2% |
| Middle School | 314 | 15.8% |
| High School | 317 | 15.9% |
| College / Undergraduate | 425 | 21.3% |
| Graduate / Professional | 141 | 7.1% |
| Total | 1,993 | 100.0% |
School Enrollment by Age by Funding Source in Bogota borough
Out of a total of 1,993 students who are enrolled in schools in Bogota borough, 285 (14.3%) attend a private institution, while the remaining 1,708 (85.7%) are enrolled in public schools. The age group of 25 to 34 year olds has the highest likelihood of being enrolled in private schools, with 63 (44.4% in the age bracket) enrolled. Conversely, the age group of 10 to 14 year olds has the lowest likelihood of being enrolled in a private school, with 451 (97.6% in the age bracket) attending a public institution.
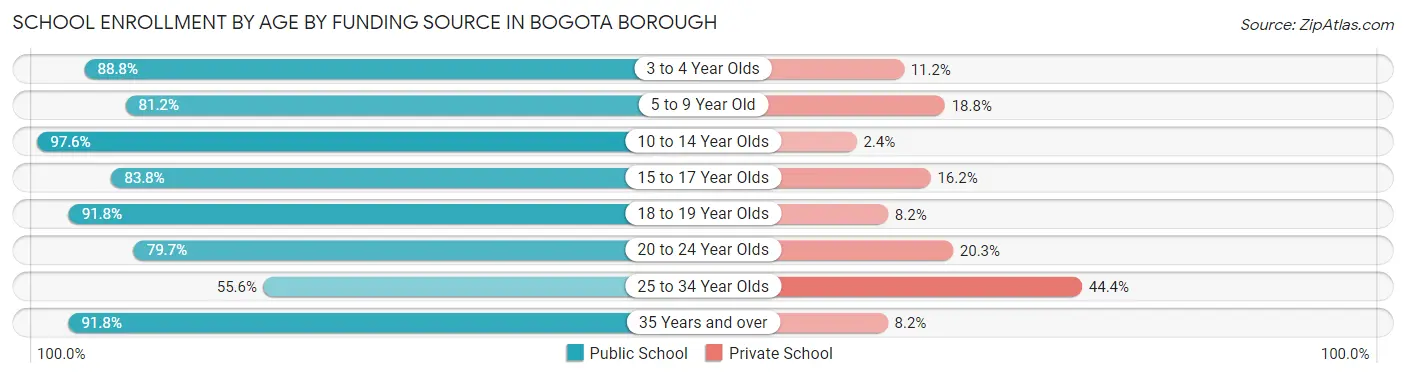
| Age Bracket | Public School | Private School |
| 3 to 4 Year Olds | 135 (88.8%) | 17 (11.2%) |
| 5 to 9 Year Old | 496 (81.2%) | 115 (18.8%) |
| 10 to 14 Year Olds | 451 (97.6%) | 11 (2.4%) |
| 15 to 17 Year Olds | 140 (83.8%) | 27 (16.2%) |
| 18 to 19 Year Olds | 167 (91.8%) | 15 (8.2%) |
| 20 to 24 Year Olds | 94 (79.7%) | 24 (20.3%) |
| 25 to 34 Year Olds | 79 (55.6%) | 63 (44.4%) |
| 35 Years and over | 146 (91.8%) | 13 (8.2%) |
| Total | 1,708 (85.7%) | 285 (14.3%) |
Educational Attainment by Field of Study in Bogota borough
Business (567 | 21.6%), education (391 | 14.9%), science & technology (351 | 13.4%), social sciences (200 | 7.6%), and computers & mathematics (179 | 6.8%) are the most common fields of study among 2,628 individuals in Bogota borough who have obtained a bachelor's degree or higher.
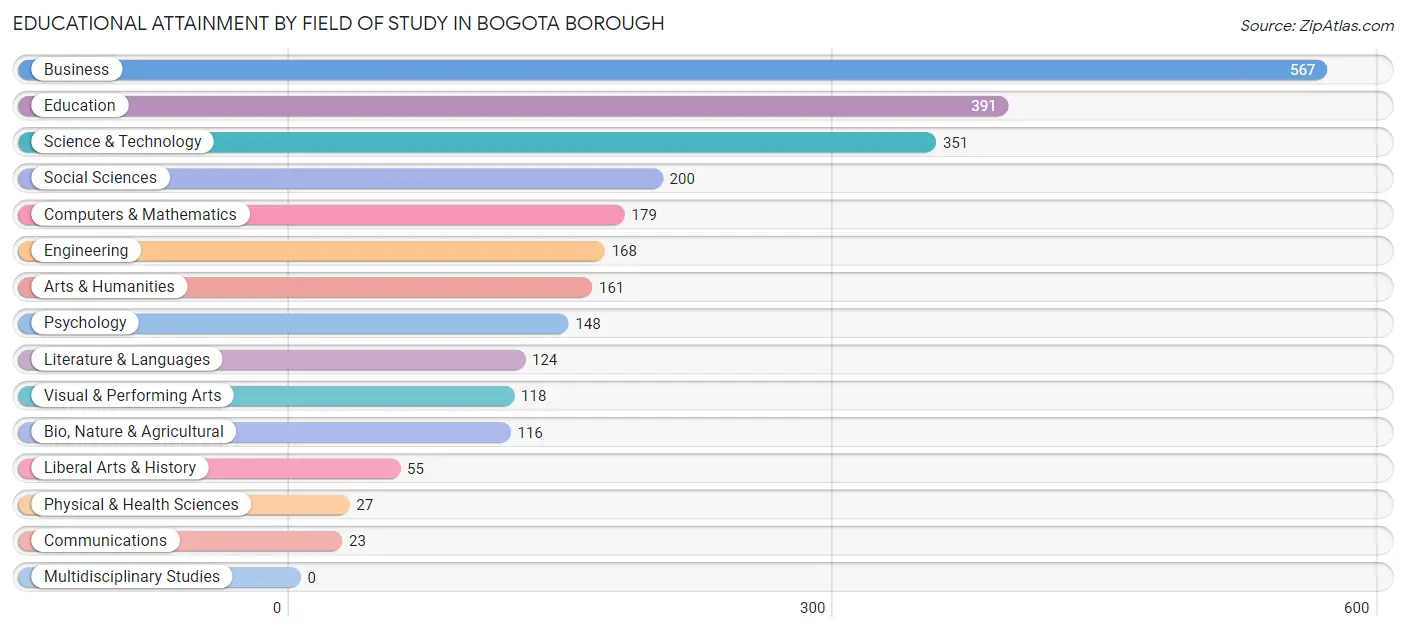
| Field of Study | # Graduates | % Graduates |
| Computers & Mathematics | 179 | 6.8% |
| Bio, Nature & Agricultural | 116 | 4.4% |
| Physical & Health Sciences | 27 | 1.0% |
| Psychology | 148 | 5.6% |
| Social Sciences | 200 | 7.6% |
| Engineering | 168 | 6.4% |
| Multidisciplinary Studies | 0 | 0.0% |
| Science & Technology | 351 | 13.4% |
| Business | 567 | 21.6% |
| Education | 391 | 14.9% |
| Literature & Languages | 124 | 4.7% |
| Liberal Arts & History | 55 | 2.1% |
| Visual & Performing Arts | 118 | 4.5% |
| Communications | 23 | 0.9% |
| Arts & Humanities | 161 | 6.1% |
| Total | 2,628 | 100.0% |
Transportation & Commute in Bogota borough
Vehicle Availability by Sex in Bogota borough
The most prevalent vehicle ownership categories in Bogota borough are males with 2 vehicles (963, accounting for 41.2%) and females with 2 vehicles (986, making up 42.6%).
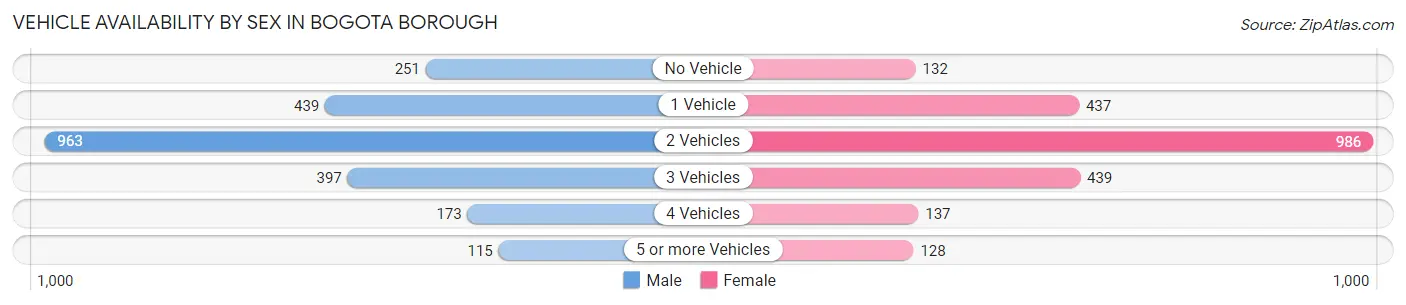
| Vehicles Available | Male | Female |
| No Vehicle | 251 (10.7%) | 132 (5.8%) |
| 1 Vehicle | 439 (18.8%) | 437 (19.3%) |
| 2 Vehicles | 963 (41.2%) | 986 (43.6%) |
| 3 Vehicles | 397 (17.0%) | 439 (19.4%) |
| 4 Vehicles | 173 (7.4%) | 137 (6.1%) |
| 5 or more Vehicles | 115 (4.9%) | 128 (5.7%) |
| Total | 2,338 (100.0%) | 2,259 (100.0%) |
Commute Time in Bogota borough
The most frequently occuring commute durations in Bogota borough are 30 to 34 minutes (643 commuters, 14.9%), 20 to 24 minutes (602 commuters, 14.0%), and 10 to 14 minutes (585 commuters, 13.6%).
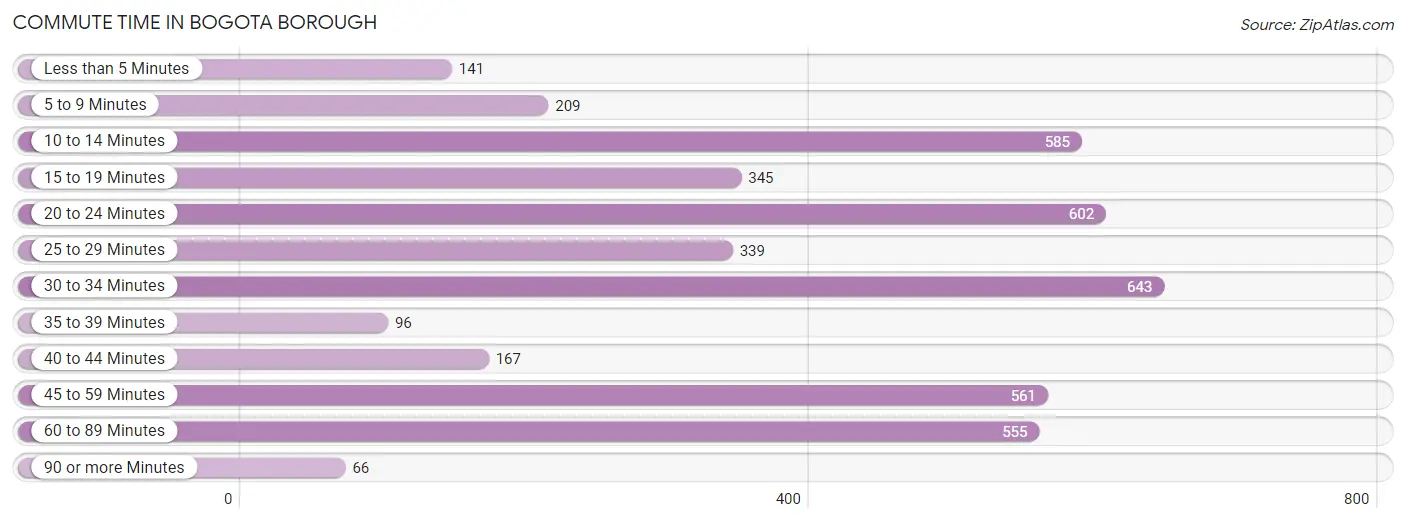
| Commute Time | # Commuters | % Commuters |
| Less than 5 Minutes | 141 | 3.3% |
| 5 to 9 Minutes | 209 | 4.9% |
| 10 to 14 Minutes | 585 | 13.6% |
| 15 to 19 Minutes | 345 | 8.0% |
| 20 to 24 Minutes | 602 | 14.0% |
| 25 to 29 Minutes | 339 | 7.9% |
| 30 to 34 Minutes | 643 | 14.9% |
| 35 to 39 Minutes | 96 | 2.2% |
| 40 to 44 Minutes | 167 | 3.9% |
| 45 to 59 Minutes | 561 | 13.0% |
| 60 to 89 Minutes | 555 | 12.9% |
| 90 or more Minutes | 66 | 1.5% |
Commute Time by Sex in Bogota borough
The most common commute times in Bogota borough are 10 to 14 minutes (394 commuters, 17.6%) for males and 60 to 89 minutes (312 commuters, 15.1%) for females.
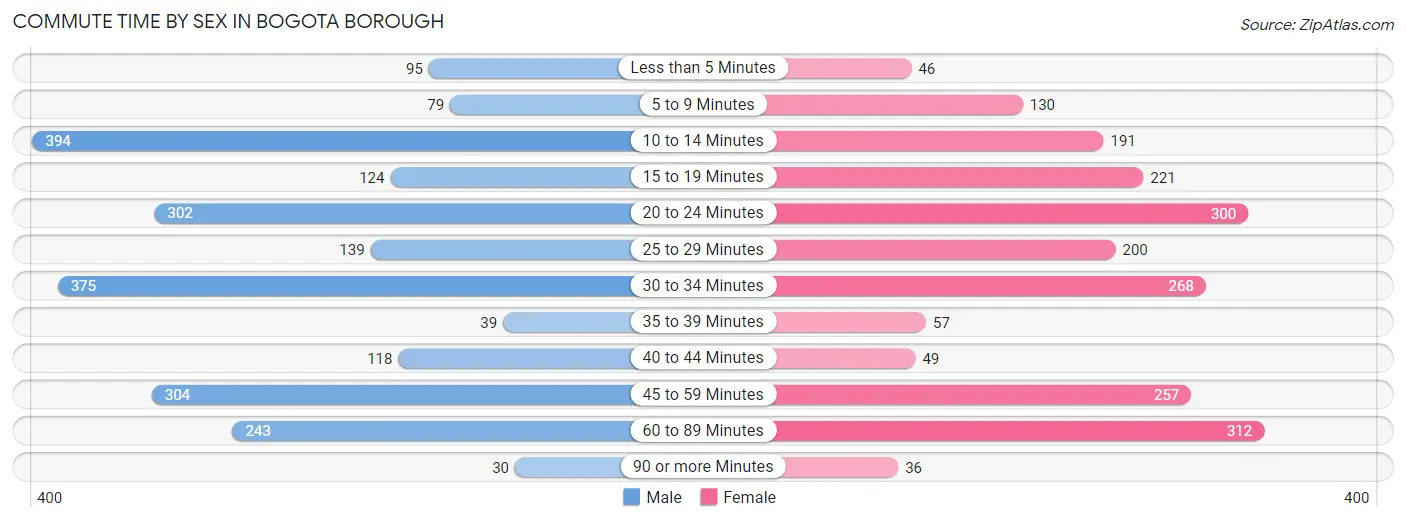
| Commute Time | Male | Female |
| Less than 5 Minutes | 95 (4.2%) | 46 (2.2%) |
| 5 to 9 Minutes | 79 (3.5%) | 130 (6.3%) |
| 10 to 14 Minutes | 394 (17.6%) | 191 (9.2%) |
| 15 to 19 Minutes | 124 (5.5%) | 221 (10.7%) |
| 20 to 24 Minutes | 302 (13.5%) | 300 (14.5%) |
| 25 to 29 Minutes | 139 (6.2%) | 200 (9.7%) |
| 30 to 34 Minutes | 375 (16.7%) | 268 (13.0%) |
| 35 to 39 Minutes | 39 (1.7%) | 57 (2.8%) |
| 40 to 44 Minutes | 118 (5.3%) | 49 (2.4%) |
| 45 to 59 Minutes | 304 (13.6%) | 257 (12.4%) |
| 60 to 89 Minutes | 243 (10.8%) | 312 (15.1%) |
| 90 or more Minutes | 30 (1.3%) | 36 (1.7%) |
Time of Departure to Work by Sex in Bogota borough
The most frequent times of departure to work in Bogota borough are 7:30 AM to 7:59 AM (341, 15.2%) for males and 7:30 AM to 7:59 AM (388, 18.8%) for females.
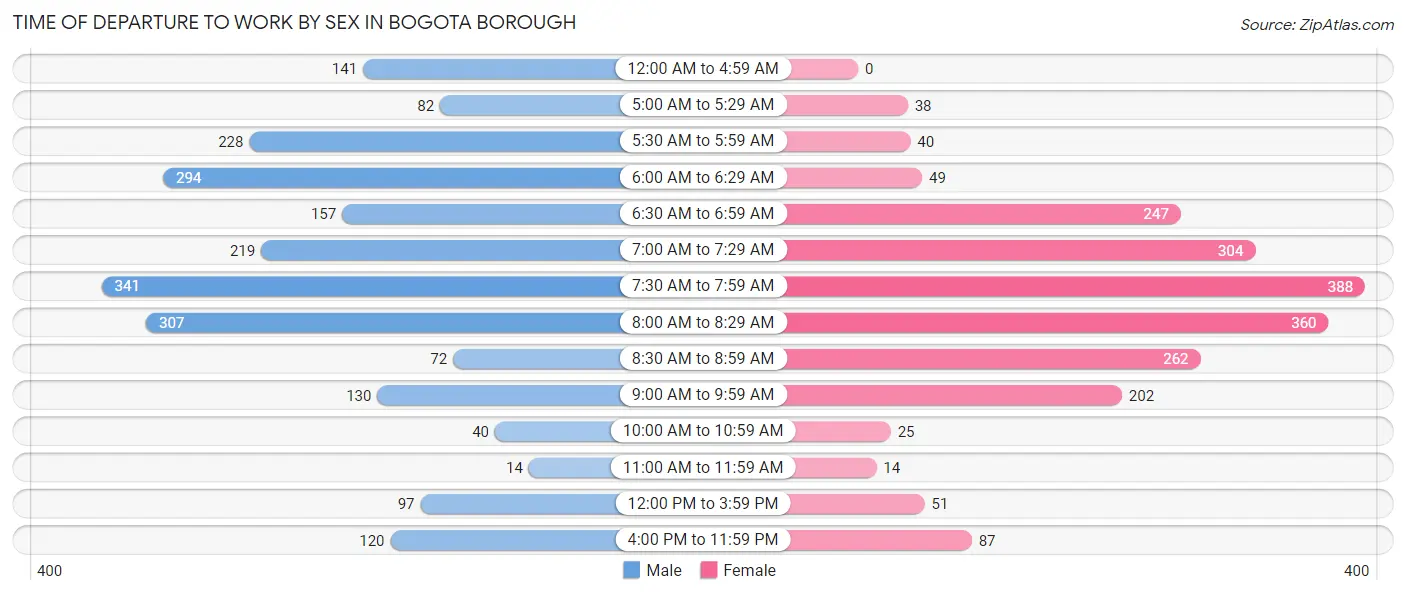
| Time of Departure | Male | Female |
| 12:00 AM to 4:59 AM | 141 (6.3%) | 0 (0.0%) |
| 5:00 AM to 5:29 AM | 82 (3.7%) | 38 (1.8%) |
| 5:30 AM to 5:59 AM | 228 (10.2%) | 40 (1.9%) |
| 6:00 AM to 6:29 AM | 294 (13.1%) | 49 (2.4%) |
| 6:30 AM to 6:59 AM | 157 (7.0%) | 247 (11.9%) |
| 7:00 AM to 7:29 AM | 219 (9.8%) | 304 (14.7%) |
| 7:30 AM to 7:59 AM | 341 (15.2%) | 388 (18.8%) |
| 8:00 AM to 8:29 AM | 307 (13.7%) | 360 (17.4%) |
| 8:30 AM to 8:59 AM | 72 (3.2%) | 262 (12.7%) |
| 9:00 AM to 9:59 AM | 130 (5.8%) | 202 (9.8%) |
| 10:00 AM to 10:59 AM | 40 (1.8%) | 25 (1.2%) |
| 11:00 AM to 11:59 AM | 14 (0.6%) | 14 (0.7%) |
| 12:00 PM to 3:59 PM | 97 (4.3%) | 51 (2.5%) |
| 4:00 PM to 11:59 PM | 120 (5.3%) | 87 (4.2%) |
| Total | 2,242 (100.0%) | 2,067 (100.0%) |
Housing Occupancy in Bogota borough
Occupancy by Ownership in Bogota borough
Of the total 3,199 dwellings in Bogota borough, owner-occupied units account for 2,155 (67.4%), while renter-occupied units make up 1,044 (32.6%).
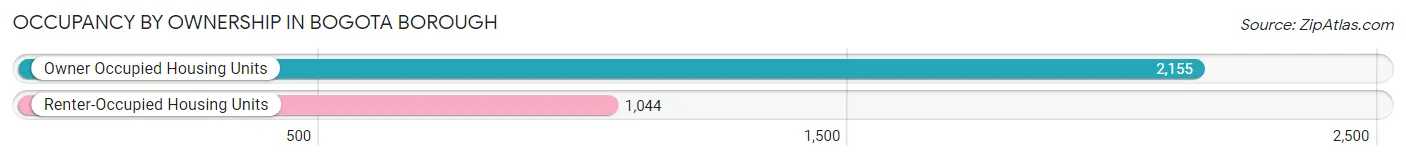
| Occupancy | # Housing Units | % Housing Units |
| Owner Occupied Housing Units | 2,155 | 67.4% |
| Renter-Occupied Housing Units | 1,044 | 32.6% |
| Total Occupied Housing Units | 3,199 | 100.0% |
Occupancy by Household Size in Bogota borough
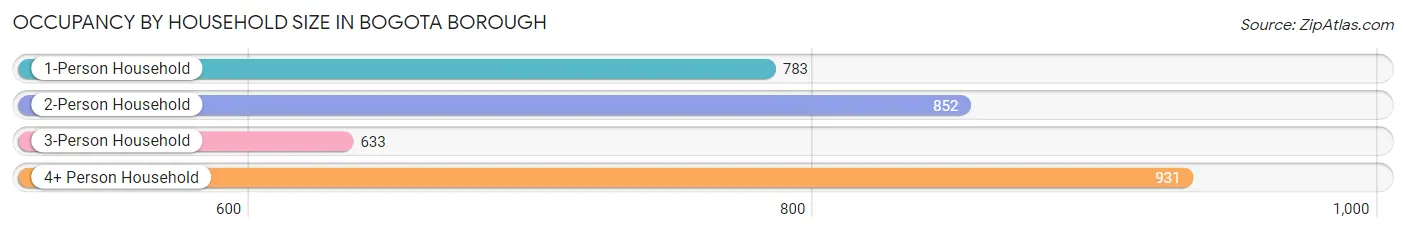
| Household Size | # Housing Units | % Housing Units |
| 1-Person Household | 783 | 24.5% |
| 2-Person Household | 852 | 26.6% |
| 3-Person Household | 633 | 19.8% |
| 4+ Person Household | 931 | 29.1% |
| Total Housing Units | 3,199 | 100.0% |
Occupancy by Ownership by Household Size in Bogota borough
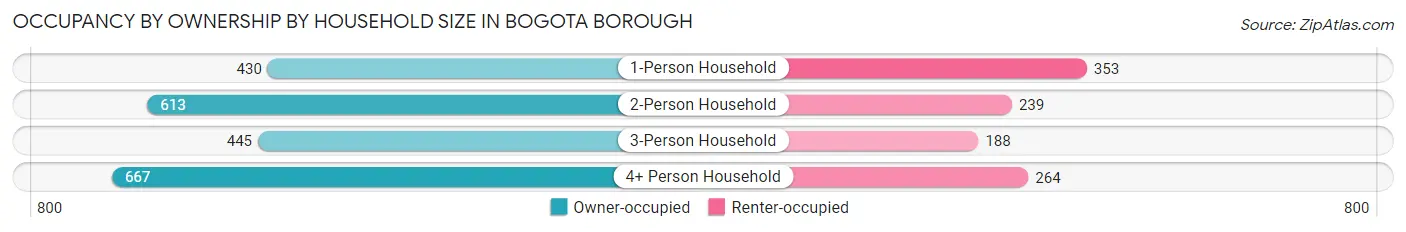
| Household Size | Owner-occupied | Renter-occupied |
| 1-Person Household | 430 (54.9%) | 353 (45.1%) |
| 2-Person Household | 613 (72.0%) | 239 (28.1%) |
| 3-Person Household | 445 (70.3%) | 188 (29.7%) |
| 4+ Person Household | 667 (71.6%) | 264 (28.4%) |
| Total Housing Units | 2,155 (67.4%) | 1,044 (32.6%) |
Occupancy by Educational Attainment in Bogota borough
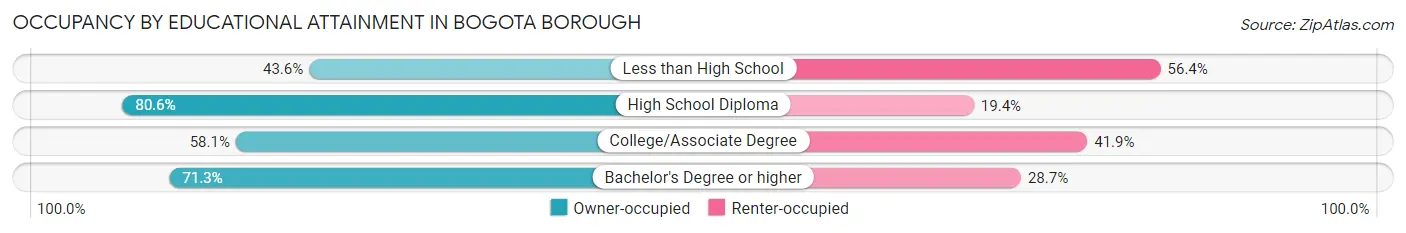
| Household Size | Owner-occupied | Renter-occupied |
| Less than High School | 133 (43.6%) | 172 (56.4%) |
| High School Diploma | 649 (80.6%) | 156 (19.4%) |
| College/Associate Degree | 514 (58.1%) | 370 (41.9%) |
| Bachelor's Degree or higher | 859 (71.3%) | 346 (28.7%) |
Occupancy by Age of Householder in Bogota borough
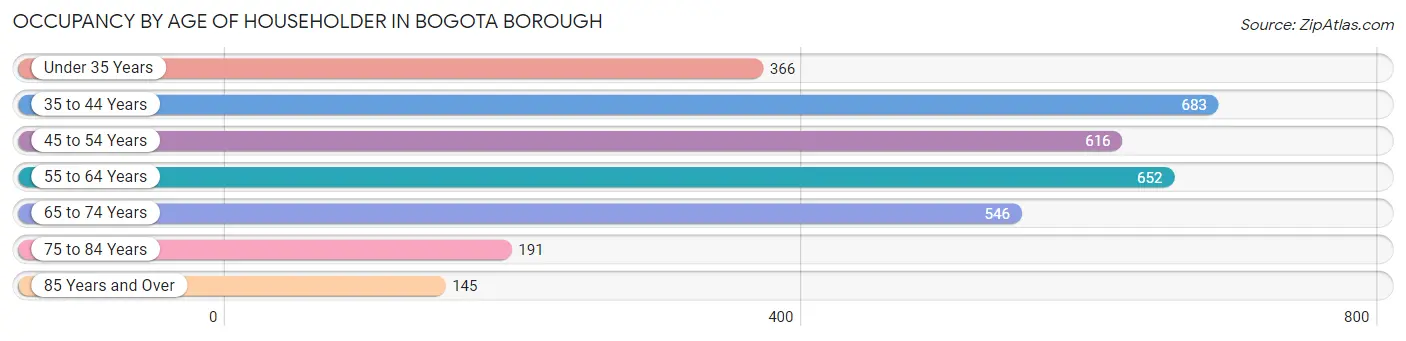
| Age Bracket | # Households | % Households |
| Under 35 Years | 366 | 11.4% |
| 35 to 44 Years | 683 | 21.3% |
| 45 to 54 Years | 616 | 19.3% |
| 55 to 64 Years | 652 | 20.4% |
| 65 to 74 Years | 546 | 17.1% |
| 75 to 84 Years | 191 | 6.0% |
| 85 Years and Over | 145 | 4.5% |
| Total | 3,199 | 100.0% |
Housing Finances in Bogota borough
Median Income by Occupancy in Bogota borough
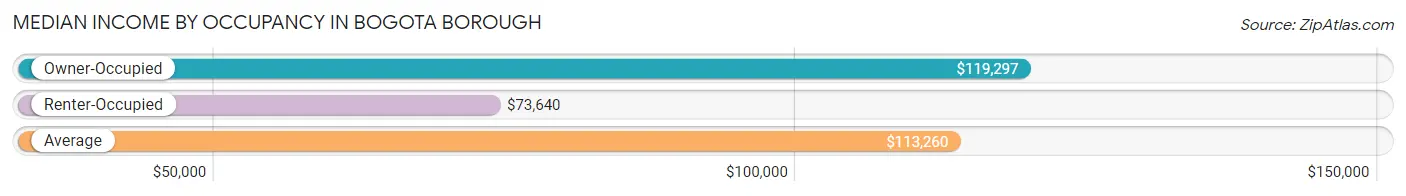
| Occupancy Type | # Households | Median Income |
| Owner-Occupied | 2,155 (67.4%) | $119,297 |
| Renter-Occupied | 1,044 (32.6%) | $73,640 |
| Average | 3,199 (100.0%) | $113,260 |
Occupancy by Householder Income Bracket in Bogota borough
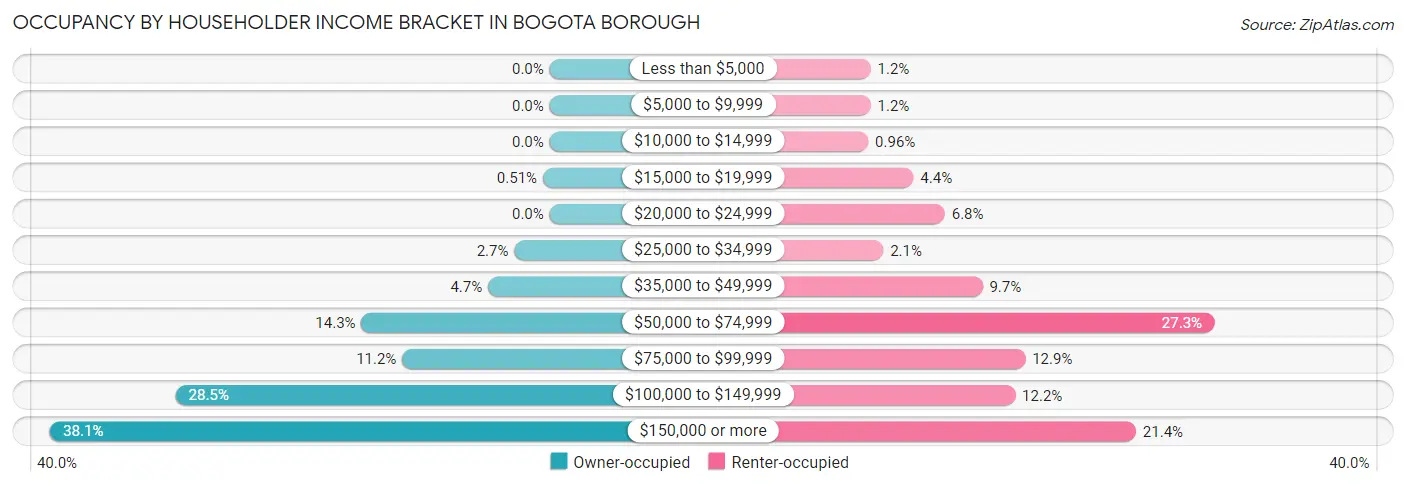
| Income Bracket | Owner-occupied | Renter-occupied |
| Less than $5,000 | 0 (0.0%) | 12 (1.1%) |
| $5,000 to $9,999 | 0 (0.0%) | 12 (1.1%) |
| $10,000 to $14,999 | 0 (0.0%) | 10 (1.0%) |
| $15,000 to $19,999 | 11 (0.5%) | 46 (4.4%) |
| $20,000 to $24,999 | 0 (0.0%) | 71 (6.8%) |
| $25,000 to $34,999 | 58 (2.7%) | 22 (2.1%) |
| $35,000 to $49,999 | 101 (4.7%) | 101 (9.7%) |
| $50,000 to $74,999 | 309 (14.3%) | 285 (27.3%) |
| $75,000 to $99,999 | 242 (11.2%) | 135 (12.9%) |
| $100,000 to $149,999 | 614 (28.5%) | 127 (12.2%) |
| $150,000 or more | 820 (38.1%) | 223 (21.4%) |
| Total | 2,155 (100.0%) | 1,044 (100.0%) |
Monthly Housing Cost Tiers in Bogota borough
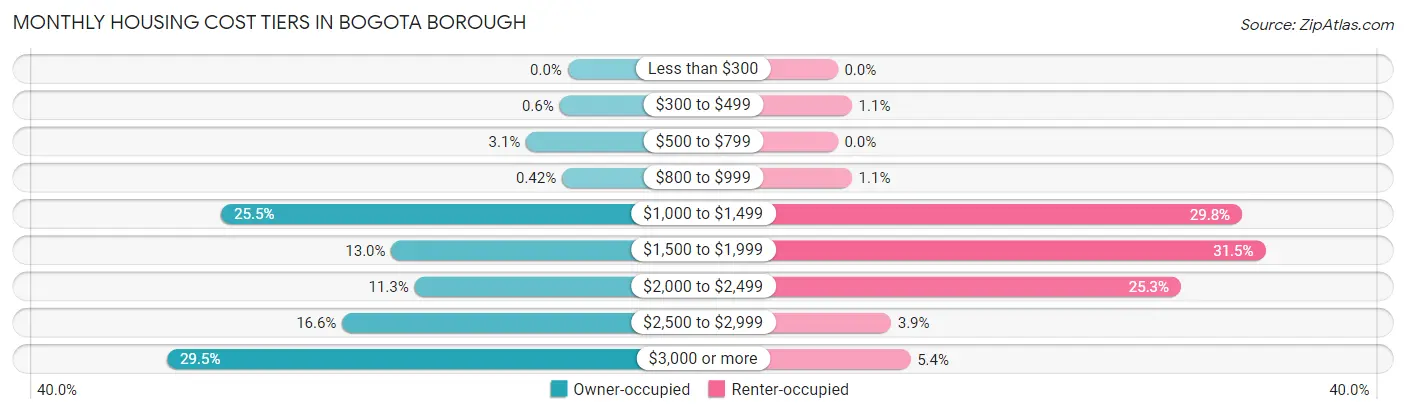
| Monthly Cost | Owner-occupied | Renter-occupied |
| Less than $300 | 0 (0.0%) | 0 (0.0%) |
| $300 to $499 | 13 (0.6%) | 11 (1.1%) |
| $500 to $799 | 66 (3.1%) | 0 (0.0%) |
| $800 to $999 | 9 (0.4%) | 11 (1.1%) |
| $1,000 to $1,499 | 550 (25.5%) | 311 (29.8%) |
| $1,500 to $1,999 | 280 (13.0%) | 329 (31.5%) |
| $2,000 to $2,499 | 243 (11.3%) | 264 (25.3%) |
| $2,500 to $2,999 | 358 (16.6%) | 41 (3.9%) |
| $3,000 or more | 636 (29.5%) | 56 (5.4%) |
| Total | 2,155 (100.0%) | 1,044 (100.0%) |
Physical Housing Characteristics in Bogota borough
Housing Structures in Bogota borough
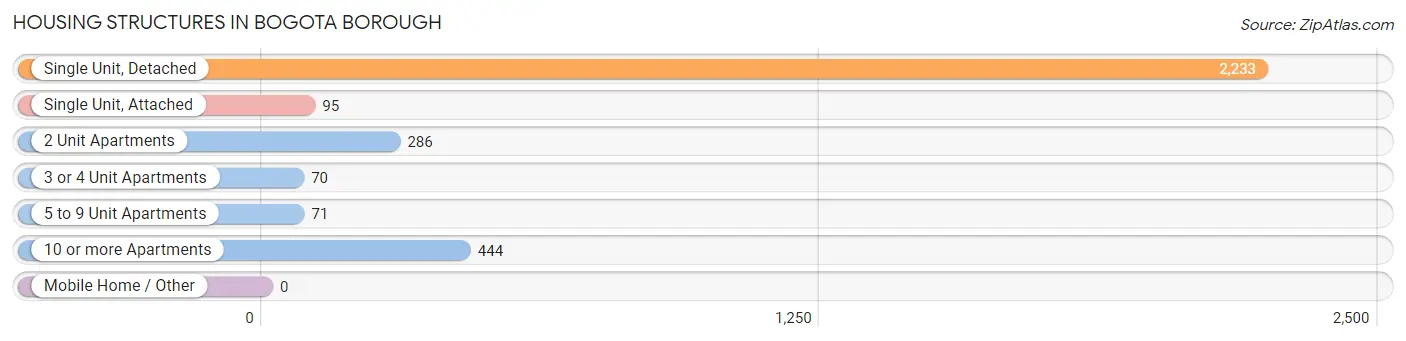
| Structure Type | # Housing Units | % Housing Units |
| Single Unit, Detached | 2,233 | 69.8% |
| Single Unit, Attached | 95 | 3.0% |
| 2 Unit Apartments | 286 | 8.9% |
| 3 or 4 Unit Apartments | 70 | 2.2% |
| 5 to 9 Unit Apartments | 71 | 2.2% |
| 10 or more Apartments | 444 | 13.9% |
| Mobile Home / Other | 0 | 0.0% |
| Total | 3,199 | 100.0% |
Housing Structures by Occupancy in Bogota borough
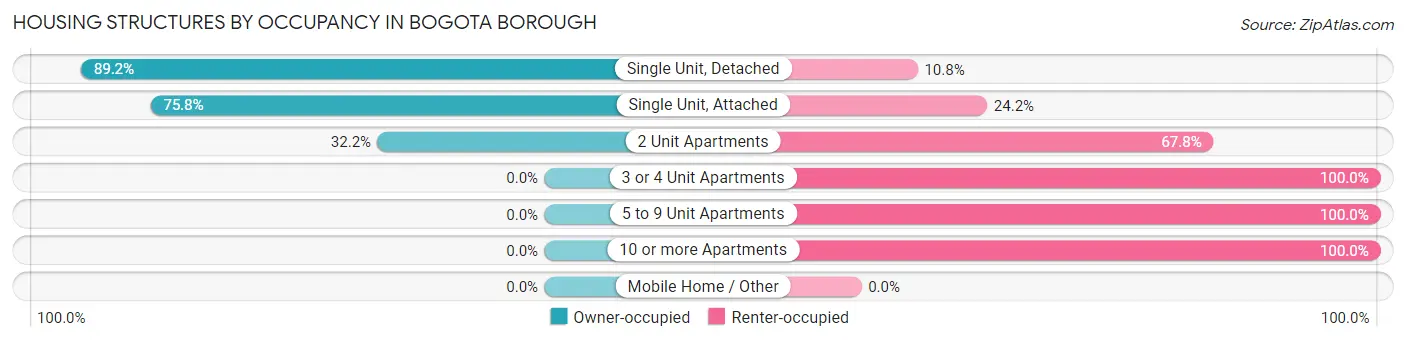
| Structure Type | Owner-occupied | Renter-occupied |
| Single Unit, Detached | 1,991 (89.2%) | 242 (10.8%) |
| Single Unit, Attached | 72 (75.8%) | 23 (24.2%) |
| 2 Unit Apartments | 92 (32.2%) | 194 (67.8%) |
| 3 or 4 Unit Apartments | 0 (0.0%) | 70 (100.0%) |
| 5 to 9 Unit Apartments | 0 (0.0%) | 71 (100.0%) |
| 10 or more Apartments | 0 (0.0%) | 444 (100.0%) |
| Mobile Home / Other | 0 (0.0%) | 0 (0.0%) |
| Total | 2,155 (67.4%) | 1,044 (32.6%) |
Housing Structures by Number of Rooms in Bogota borough
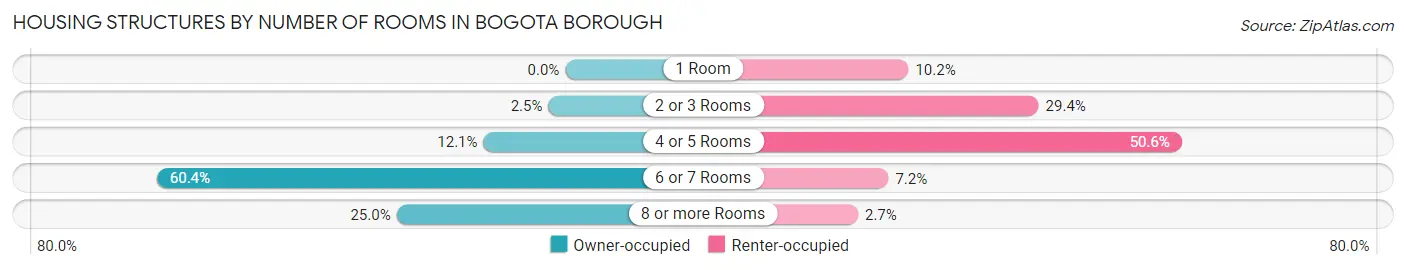
| Number of Rooms | Owner-occupied | Renter-occupied |
| 1 Room | 0 (0.0%) | 106 (10.2%) |
| 2 or 3 Rooms | 54 (2.5%) | 307 (29.4%) |
| 4 or 5 Rooms | 261 (12.1%) | 528 (50.6%) |
| 6 or 7 Rooms | 1,302 (60.4%) | 75 (7.2%) |
| 8 or more Rooms | 538 (25.0%) | 28 (2.7%) |
| Total | 2,155 (100.0%) | 1,044 (100.0%) |
Housing Structure by Heating Type in Bogota borough
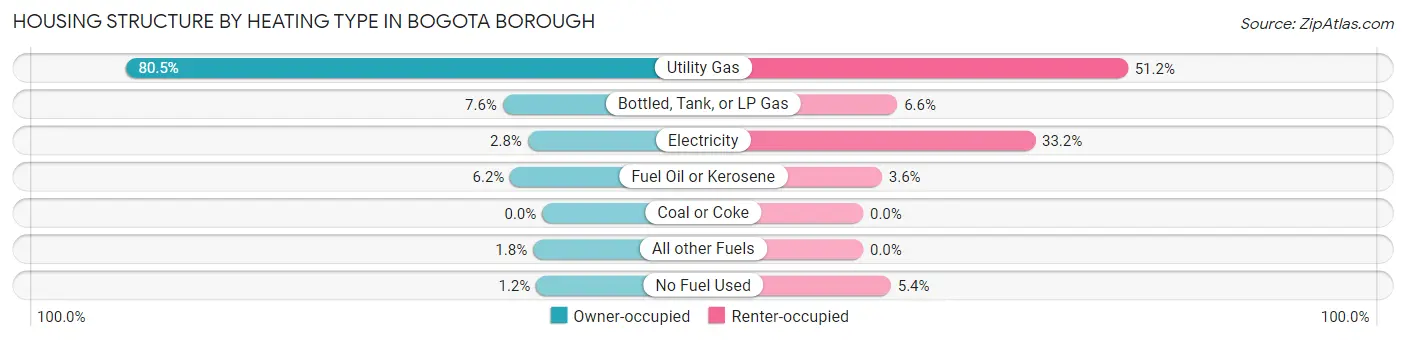
| Heating Type | Owner-occupied | Renter-occupied |
| Utility Gas | 1,735 (80.5%) | 534 (51.1%) |
| Bottled, Tank, or LP Gas | 164 (7.6%) | 69 (6.6%) |
| Electricity | 60 (2.8%) | 347 (33.2%) |
| Fuel Oil or Kerosene | 133 (6.2%) | 38 (3.6%) |
| Coal or Coke | 0 (0.0%) | 0 (0.0%) |
| All other Fuels | 38 (1.8%) | 0 (0.0%) |
| No Fuel Used | 25 (1.2%) | 56 (5.4%) |
| Total | 2,155 (100.0%) | 1,044 (100.0%) |
Household Vehicle Usage in Bogota borough
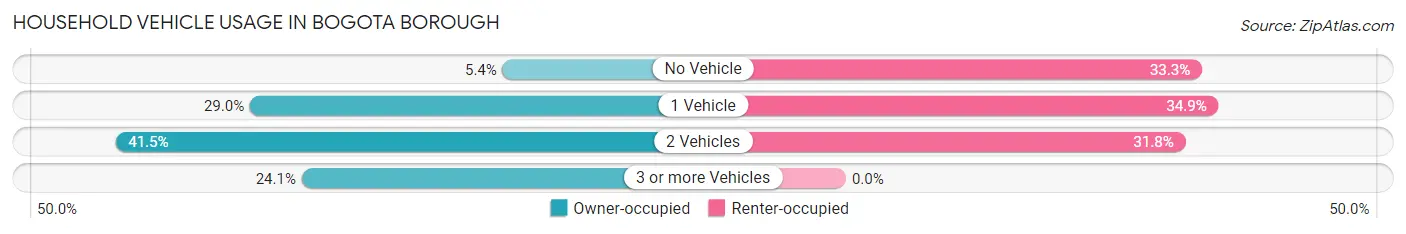
| Vehicles per Household | Owner-occupied | Renter-occupied |
| No Vehicle | 116 (5.4%) | 348 (33.3%) |
| 1 Vehicle | 624 (29.0%) | 364 (34.9%) |
| 2 Vehicles | 895 (41.5%) | 332 (31.8%) |
| 3 or more Vehicles | 520 (24.1%) | 0 (0.0%) |
| Total | 2,155 (100.0%) | 1,044 (100.0%) |
Real Estate & Mortgages in Bogota borough
Real Estate and Mortgage Overview in Bogota borough
| Characteristic | Without Mortgage | With Mortgage |
| Housing Units | 792 | 1,363 |
| Median Property Value | $398,700 | $438,600 |
| Median Household Income | $118,568 | $583 |
| Monthly Housing Costs | $1,366 | $636 |
| Real Estate Taxes | $10,001 | $25 |
Property Value by Mortgage Status in Bogota borough
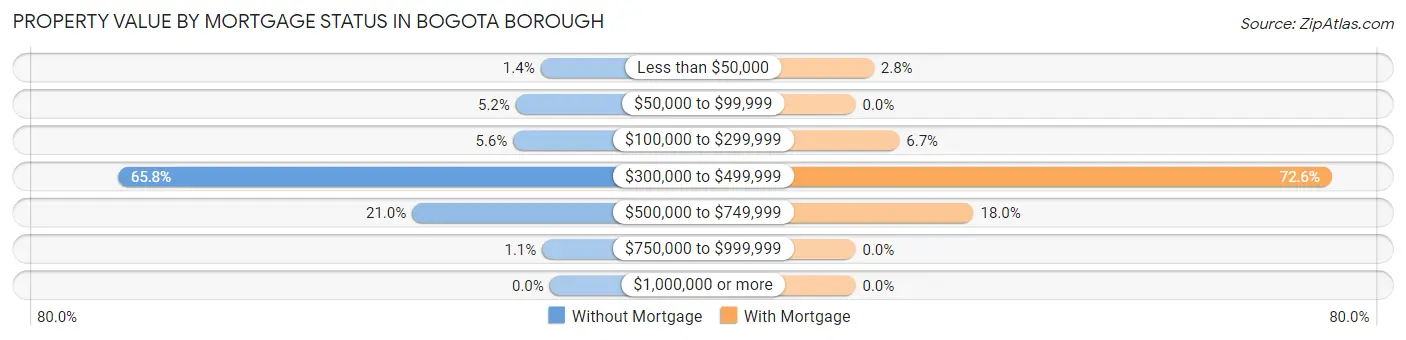
| Property Value | Without Mortgage | With Mortgage |
| Less than $50,000 | 11 (1.4%) | 38 (2.8%) |
| $50,000 to $99,999 | 41 (5.2%) | 0 (0.0%) |
| $100,000 to $299,999 | 44 (5.6%) | 91 (6.7%) |
| $300,000 to $499,999 | 521 (65.8%) | 989 (72.6%) |
| $500,000 to $749,999 | 166 (21.0%) | 245 (18.0%) |
| $750,000 to $999,999 | 9 (1.1%) | 0 (0.0%) |
| $1,000,000 or more | 0 (0.0%) | 0 (0.0%) |
| Total | 792 (100.0%) | 1,363 (100.0%) |
Household Income by Mortgage Status in Bogota borough
| Household Income | Without Mortgage | With Mortgage |
| Less than $10,000 | 0 (0.0%) | 61 (4.5%) |
| $10,000 to $24,999 | 11 (1.4%) | 0 (0.0%) |
| $25,000 to $34,999 | 21 (2.6%) | 0 (0.0%) |
| $35,000 to $49,999 | 61 (7.7%) | 37 (2.7%) |
| $50,000 to $74,999 | 118 (14.9%) | 40 (2.9%) |
| $75,000 to $99,999 | 119 (15.0%) | 191 (14.0%) |
| $100,000 to $149,999 | 225 (28.4%) | 123 (9.0%) |
| $150,000 or more | 237 (29.9%) | 389 (28.5%) |
| Total | 792 (100.0%) | 1,363 (100.0%) |
Property Value to Household Income Ratio in Bogota borough
| Value-to-Income Ratio | Without Mortgage | With Mortgage |
| Less than 2.0x | 177 (22.4%) | 131,563 (9,652.5%) |
| 2.0x to 2.9x | 250 (31.6%) | 368 (27.0%) |
| 3.0x to 3.9x | 51 (6.4%) | 216 (15.9%) |
| 4.0x or more | 314 (39.7%) | 261 (19.2%) |
| Total | 792 (100.0%) | 1,363 (100.0%) |
Real Estate Taxes by Mortgage Status in Bogota borough
| Property Taxes | Without Mortgage | With Mortgage |
| Less than $800 | 0 (0.0%) | 0 (0.0%) |
| $800 to $1,499 | 0 (0.0%) | 13 (0.9%) |
| $800 to $1,499 | 792 (100.0%) | 0 (0.0%) |
| Total | 792 (100.0%) | 1,363 (100.0%) |
Health & Disability in Bogota borough
Health Insurance Coverage by Age in Bogota borough
| Age Bracket | With Coverage | Without Coverage |
| Under 6 Years | 710 (100.0%) | 0 (0.0%) |
| 6 to 18 Years | 1,000 (87.6%) | 141 (12.4%) |
| 19 to 25 Years | 510 (67.5%) | 246 (32.5%) |
| 26 to 34 Years | 672 (93.2%) | 49 (6.8%) |
| 35 to 44 Years | 1,539 (87.9%) | 212 (12.1%) |
| 45 to 54 Years | 946 (91.0%) | 94 (9.0%) |
| 55 to 64 Years | 1,182 (91.1%) | 115 (8.9%) |
| 65 to 74 Years | 953 (100.0%) | 0 (0.0%) |
| 75 Years and older | 538 (100.0%) | 0 (0.0%) |
| Total | 8,050 (90.4%) | 857 (9.6%) |
Health Insurance Coverage by Citizenship Status in Bogota borough
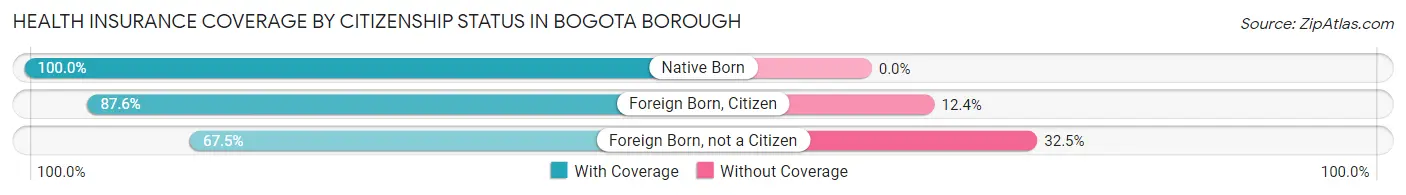
| Citizenship Status | With Coverage | Without Coverage |
| Native Born | 710 (100.0%) | 0 (0.0%) |
| Foreign Born, Citizen | 1,000 (87.6%) | 141 (12.4%) |
| Foreign Born, not a Citizen | 510 (67.5%) | 246 (32.5%) |
Health Insurance Coverage by Household Income in Bogota borough
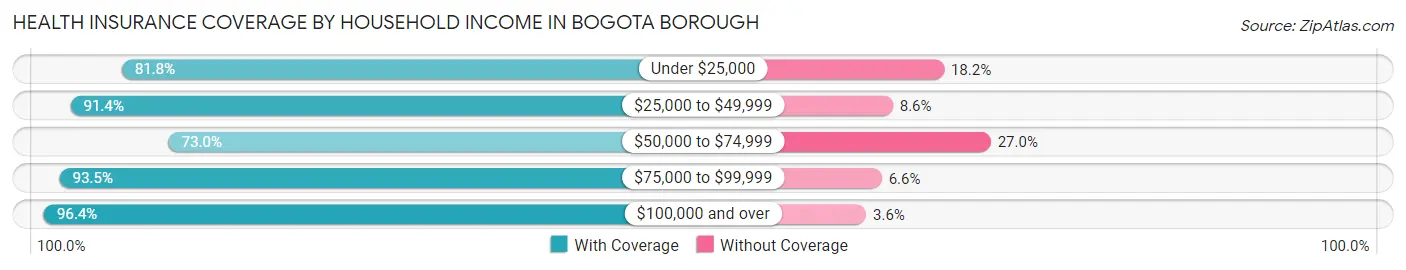
| Household Income | With Coverage | Without Coverage |
| Under $25,000 | 229 (81.8%) | 51 (18.2%) |
| $25,000 to $49,999 | 403 (91.4%) | 38 (8.6%) |
| $50,000 to $74,999 | 1,389 (73.0%) | 513 (27.0%) |
| $75,000 to $99,999 | 884 (93.4%) | 62 (6.6%) |
| $100,000 and over | 5,115 (96.4%) | 192 (3.6%) |
Public vs Private Health Insurance Coverage by Age in Bogota borough
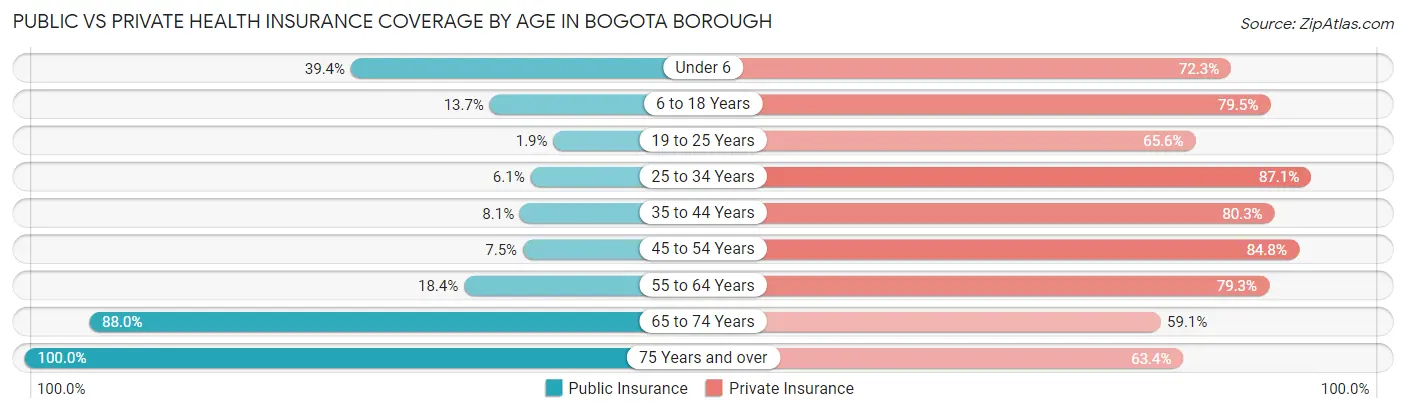
| Age Bracket | Public Insurance | Private Insurance |
| Under 6 | 280 (39.4%) | 513 (72.3%) |
| 6 to 18 Years | 156 (13.7%) | 907 (79.5%) |
| 19 to 25 Years | 14 (1.8%) | 496 (65.6%) |
| 25 to 34 Years | 44 (6.1%) | 628 (87.1%) |
| 35 to 44 Years | 141 (8.1%) | 1,406 (80.3%) |
| 45 to 54 Years | 78 (7.5%) | 882 (84.8%) |
| 55 to 64 Years | 239 (18.4%) | 1,028 (79.3%) |
| 65 to 74 Years | 839 (88.0%) | 563 (59.1%) |
| 75 Years and over | 538 (100.0%) | 341 (63.4%) |
| Total | 2,329 (26.2%) | 6,764 (75.9%) |
Disability Status by Sex by Age in Bogota borough
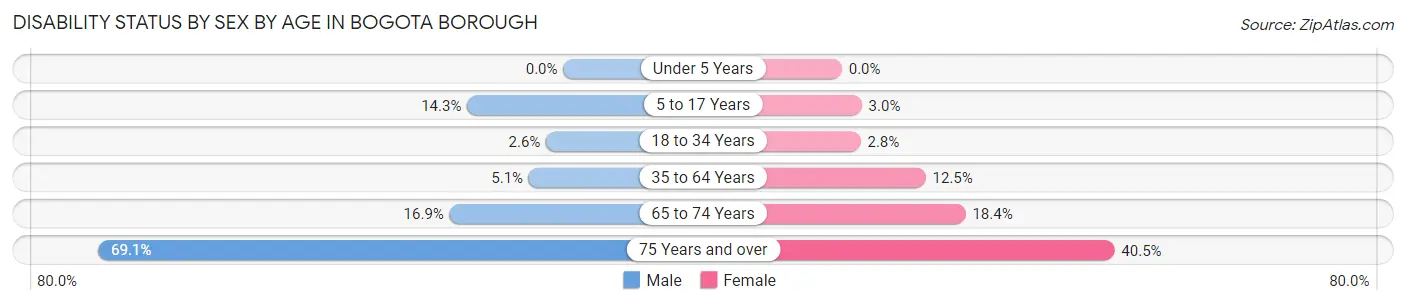
| Age Bracket | Male | Female |
| Under 5 Years | 0 (0.0%) | 0 (0.0%) |
| 5 to 17 Years | 101 (14.3%) | 17 (2.9%) |
| 18 to 34 Years | 13 (2.5%) | 29 (2.8%) |
| 35 to 64 Years | 105 (5.1%) | 253 (12.4%) |
| 65 to 74 Years | 80 (16.9%) | 88 (18.4%) |
| 75 Years and over | 143 (69.1%) | 134 (40.5%) |
Disability Class by Sex by Age in Bogota borough
Disability Class: Hearing Difficulty
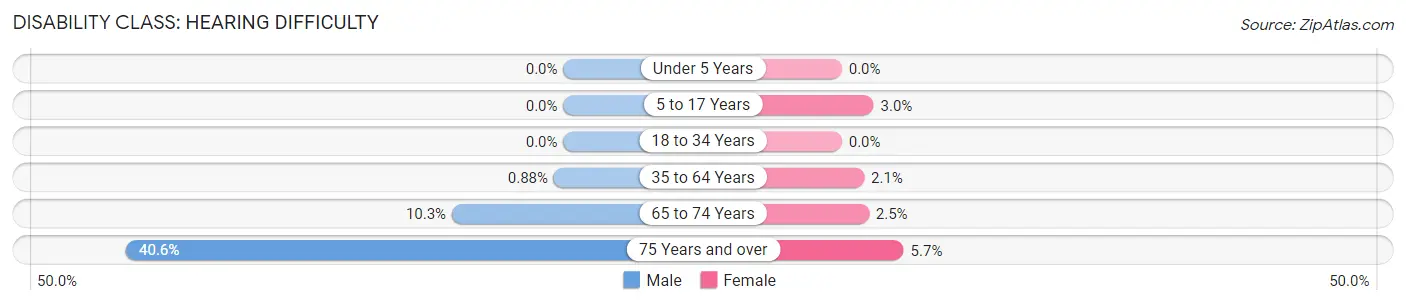
| Age Bracket | Male | Female |
| Under 5 Years | 0 (0.0%) | 0 (0.0%) |
| 5 to 17 Years | 0 (0.0%) | 17 (2.9%) |
| 18 to 34 Years | 0 (0.0%) | 0 (0.0%) |
| 35 to 64 Years | 18 (0.9%) | 42 (2.1%) |
| 65 to 74 Years | 49 (10.3%) | 12 (2.5%) |
| 75 Years and over | 84 (40.6%) | 19 (5.7%) |
Disability Class: Vision Difficulty
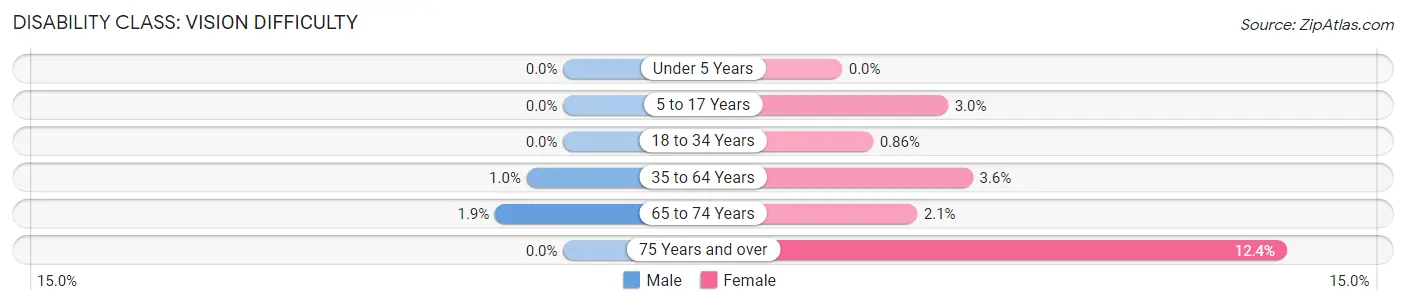
| Age Bracket | Male | Female |
| Under 5 Years | 0 (0.0%) | 0 (0.0%) |
| 5 to 17 Years | 0 (0.0%) | 17 (2.9%) |
| 18 to 34 Years | 0 (0.0%) | 9 (0.9%) |
| 35 to 64 Years | 21 (1.0%) | 74 (3.6%) |
| 65 to 74 Years | 9 (1.9%) | 10 (2.1%) |
| 75 Years and over | 0 (0.0%) | 41 (12.4%) |
Disability Class: Cognitive Difficulty
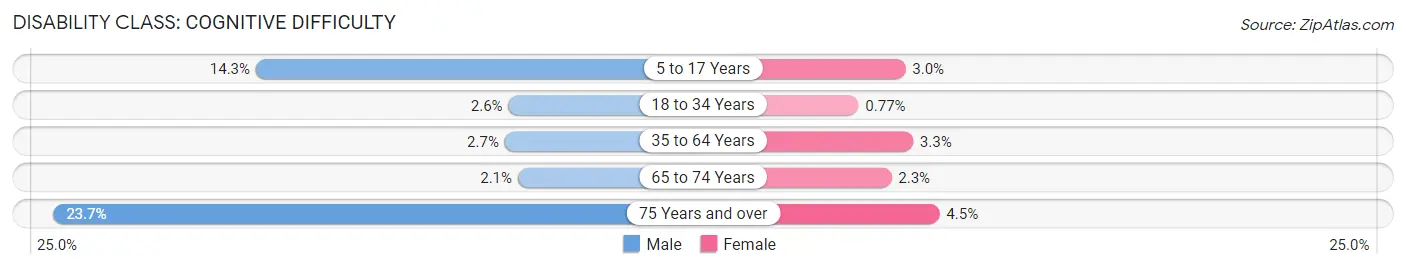
| Age Bracket | Male | Female |
| 5 to 17 Years | 101 (14.3%) | 17 (2.9%) |
| 18 to 34 Years | 13 (2.5%) | 8 (0.8%) |
| 35 to 64 Years | 56 (2.7%) | 67 (3.3%) |
| 65 to 74 Years | 10 (2.1%) | 11 (2.3%) |
| 75 Years and over | 49 (23.7%) | 15 (4.5%) |
Disability Class: Ambulatory Difficulty
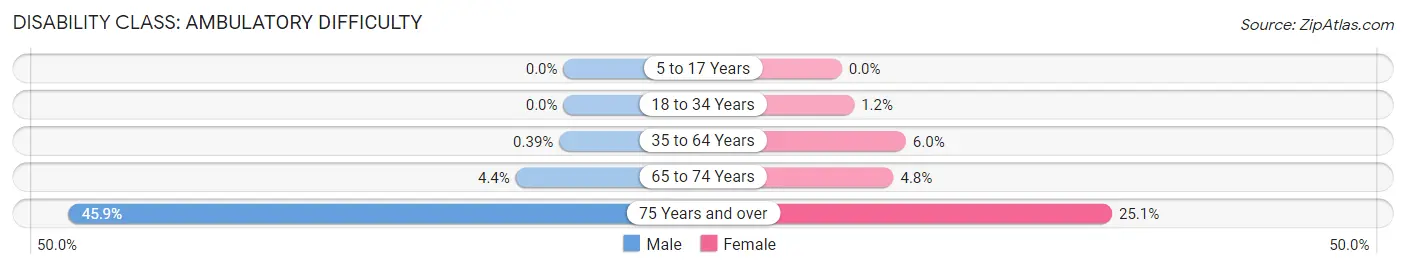
| Age Bracket | Male | Female |
| 5 to 17 Years | 0 (0.0%) | 0 (0.0%) |
| 18 to 34 Years | 0 (0.0%) | 12 (1.1%) |
| 35 to 64 Years | 8 (0.4%) | 121 (5.9%) |
| 65 to 74 Years | 21 (4.4%) | 23 (4.8%) |
| 75 Years and over | 95 (45.9%) | 83 (25.1%) |
Disability Class: Self-Care Difficulty
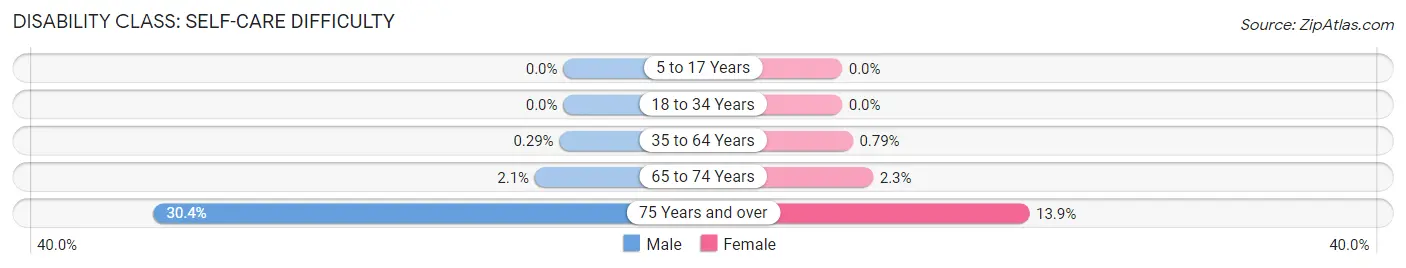
| Age Bracket | Male | Female |
| 5 to 17 Years | 0 (0.0%) | 0 (0.0%) |
| 18 to 34 Years | 0 (0.0%) | 0 (0.0%) |
| 35 to 64 Years | 6 (0.3%) | 16 (0.8%) |
| 65 to 74 Years | 10 (2.1%) | 11 (2.3%) |
| 75 Years and over | 63 (30.4%) | 46 (13.9%) |
Technology Access in Bogota borough
Computing Device Access in Bogota borough
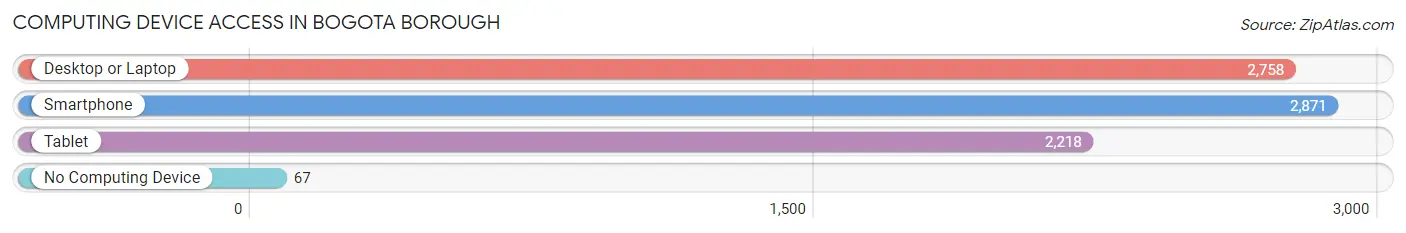
| Device Type | # Households | % Households |
| Desktop or Laptop | 2,758 | 86.2% |
| Smartphone | 2,871 | 89.7% |
| Tablet | 2,218 | 69.3% |
| No Computing Device | 67 | 2.1% |
| Total | 3,199 | 100.0% |
Internet Access in Bogota borough
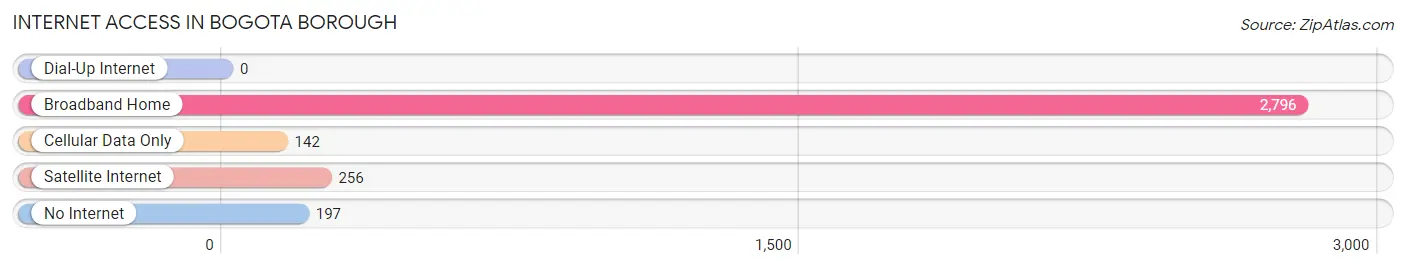
| Internet Type | # Households | % Households |
| Dial-Up Internet | 0 | 0.0% |
| Broadband Home | 2,796 | 87.4% |
| Cellular Data Only | 142 | 4.4% |
| Satellite Internet | 256 | 8.0% |
| No Internet | 197 | 6.2% |
| Total | 3,199 | 100.0% |
Bogota borough Summary
Bogota Borough is a small borough located in Bergen County, New Jersey. It is situated on the Hackensack River, just north of the city of Hackensack. The borough was incorporated in 1894 and is home to a population of 8,187 people as of the 2010 census.
History
The area that is now Bogota was originally inhabited by the Hackensack Indians, who were part of the Lenni Lenape tribe. The area was first settled by Dutch settlers in the early 1700s. The area was known as “Bogota” after the Dutch word for “swamp”. The area was part of the larger Hackensack Township until 1894, when it was incorporated as the Borough of Bogota.
Geography
Bogota is located in Bergen County, New Jersey. It is situated on the Hackensack River, just north of the city of Hackensack. The borough is bordered by the boroughs of Teaneck and Ridgefield Park to the north, Hackensack to the south, and the townships of Lodi and Hasbrouck Heights to the east. The borough covers an area of 1.2 square miles and is home to a population of 8,187 people as of the 2010 census.
Economy
Bogota is a primarily residential community, with a small commercial district located along the Hackensack River. The borough is home to a variety of small businesses, including restaurants, retail stores, and professional services. The borough is also home to a number of industrial and manufacturing businesses, including a printing company, a plastics manufacturer, and a metal fabrication company.
Demographics
As of the 2010 census, Bogota had a population of 8,187 people. The racial makeup of the borough was 79.2% White, 8.2% African American, 0.3% Native American, 5.2% Asian, and 6.1% from other races. Hispanic or Latino of any race were 18.2% of the population.
The median household income in Bogota was $68,958, and the median family income was $77,917. The per capita income was $30,945. About 5.2% of families and 6.7% of the population were below the poverty line, including 8.2% of those under age 18 and 6.2% of those age 65 or over.
Bogota is a diverse community, with a variety of cultures and backgrounds represented. The borough is home to a large Italian-American population, as well as a growing Hispanic population. The borough is also home to a large Jewish community, with a number of synagogues located in the area.
Common Questions
What is Per Capita Income in Bogota borough?
Per Capita income in Bogota borough is $48,011.
What is the Median Family Income in Bogota borough?
Median Family Income in Bogota borough is $114,271.
What is the Median Household income in Bogota borough?
Median Household Income in Bogota borough is $113,260.
What is Income or Wage Gap in Bogota borough?
Income or Wage Gap in Bogota borough is 31.8%.
Women in Bogota borough earn 68.2 cents for every dollar earned by a man.
What is Inequality or Gini Index in Bogota borough?
Inequality or Gini Index in Bogota borough is 0.36.
What is the Total Population of Bogota borough?
Total Population of Bogota borough is 8,940.
What is the Total Male Population of Bogota borough?
Total Male Population of Bogota borough is 4,115.
What is the Total Female Population of Bogota borough?
Total Female Population of Bogota borough is 4,825.
What is the Ratio of Males per 100 Females in Bogota borough?
There are 85.28 Males per 100 Females in Bogota borough.
What is the Ratio of Females per 100 Males in Bogota borough?
There are 117.25 Females per 100 Males in Bogota borough.
What is the Median Population Age in Bogota borough?
Median Population Age in Bogota borough is 42.2 Years.
What is the Average Family Size in Bogota borough
Average Family Size in Bogota borough is 3.2 People.
What is the Average Household Size in Bogota borough
Average Household Size in Bogota borough is 2.8 People.
How Large is the Labor Force in Bogota borough?
There are 5,034 People in the Labor Forcein in Bogota borough.
What is the Percentage of People in the Labor Force in Bogota borough?
69.0% of People are in the Labor Force in Bogota borough.
What is the Unemployment Rate in Bogota borough?
Unemployment Rate in Bogota borough is 6.5%.