Cities with the Largest Swedish Community in New Jersey
RELATED REPORTS & OPTIONS
Swedish
New Jersey
Compare Cities
Map of Cities with the Largest Swedish Community in New Jersey
0
800
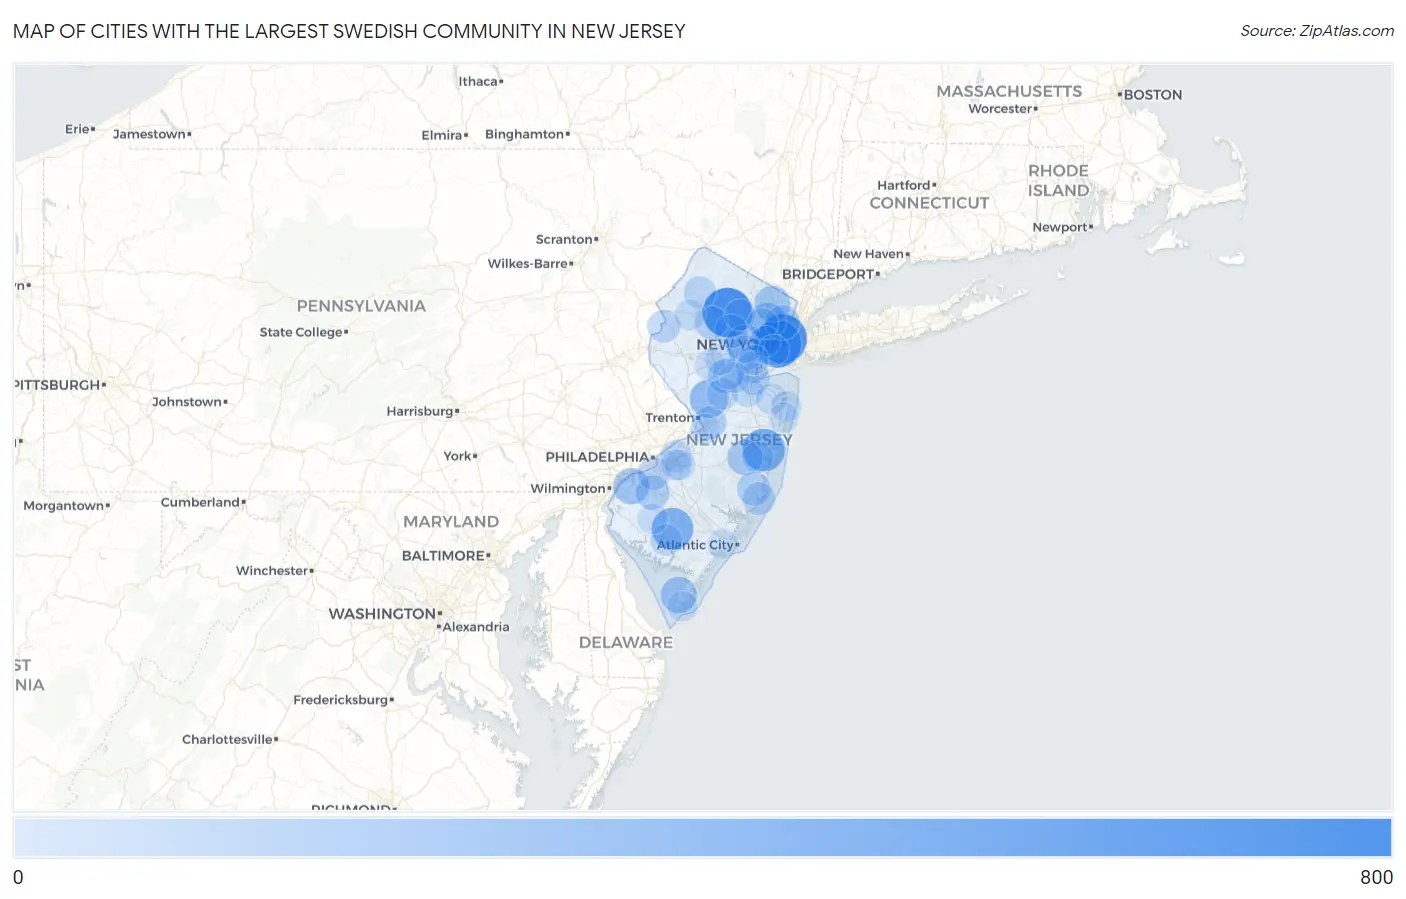
Cities with the Largest Swedish Community in New Jersey
| City | Swedish | vs State | vs National | |
| 1. | White Meadow Lake | 650 | 42,298(1.54%)#1 | 3,471,233(0.02%)#789 |
| 2. | Hoboken | 634 | 42,298(1.50%)#2 | 3,471,233(0.02%)#803 |
| 3. | Jersey City | 596 | 42,298(1.41%)#3 | 3,471,233(0.02%)#871 |
| 4. | Toms River | 441 | 42,298(1.04%)#4 | 3,471,233(0.01%)#1,179 |
| 5. | Vineland | 416 | 42,298(0.98%)#5 | 3,471,233(0.01%)#1,258 |
| 6. | Paramus Borough | 343 | 42,298(0.81%)#6 | 3,471,233(0.01%)#1,505 |
| 7. | Princeton | 315 | 42,298(0.74%)#7 | 3,471,233(0.01%)#1,627 |
| 8. | Summit | 310 | 42,298(0.73%)#8 | 3,471,233(0.01%)#1,645 |
| 9. | Glen Ridge Borough | 307 | 42,298(0.73%)#9 | 3,471,233(0.01%)#1,666 |
| 10. | Haddonfield Borough | 298 | 42,298(0.70%)#10 | 3,471,233(0.01%)#1,714 |
| 11. | Metuchen Borough | 290 | 42,298(0.69%)#11 | 3,471,233(0.01%)#1,754 |
| 12. | Point Pleasant Borough | 288 | 42,298(0.68%)#12 | 3,471,233(0.01%)#1,764 |
| 13. | Clifton | 274 | 42,298(0.65%)#13 | 3,471,233(0.01%)#1,852 |
| 14. | Villas | 259 | 42,298(0.61%)#14 | 3,471,233(0.01%)#1,956 |
| 15. | Beckett | 259 | 42,298(0.61%)#15 | 3,471,233(0.01%)#1,958 |
| 16. | Ridgewood | 256 | 42,298(0.61%)#16 | 3,471,233(0.01%)#1,966 |
| 17. | Franklin Borough | 242 | 42,298(0.57%)#17 | 3,471,233(0.01%)#2,079 |
| 18. | Crestwood Village | 238 | 42,298(0.56%)#18 | 3,471,233(0.01%)#2,113 |
| 19. | Basking Ridge | 238 | 42,298(0.56%)#19 | 3,471,233(0.01%)#2,114 |
| 20. | Cresskill Borough | 229 | 42,298(0.54%)#20 | 3,471,233(0.01%)#2,185 |
| 21. | Ridgefield Park | 217 | 42,298(0.51%)#21 | 3,471,233(0.01%)#2,284 |
| 22. | Westfield | 201 | 42,298(0.48%)#22 | 3,471,233(0.01%)#2,418 |
| 23. | Middlebush | 200 | 42,298(0.47%)#23 | 3,471,233(0.01%)#2,439 |
| 24. | Richwood | 199 | 42,298(0.47%)#24 | 3,471,233(0.01%)#2,448 |
| 25. | Westmont | 197 | 42,298(0.47%)#25 | 3,471,233(0.01%)#2,462 |
| 26. | Medford Lakes Borough | 190 | 42,298(0.45%)#26 | 3,471,233(0.01%)#2,534 |
| 27. | Franklin Lakes Borough | 185 | 42,298(0.44%)#27 | 3,471,233(0.01%)#2,584 |
| 28. | Kinnelon Borough | 185 | 42,298(0.44%)#28 | 3,471,233(0.01%)#2,585 |
| 29. | Ocean Acres | 184 | 42,298(0.44%)#29 | 3,471,233(0.01%)#2,594 |
| 30. | Morristown | 183 | 42,298(0.43%)#30 | 3,471,233(0.01%)#2,604 |
| 31. | Hopatcong Borough | 173 | 42,298(0.41%)#31 | 3,471,233(0.00%)#2,691 |
| 32. | Chatham Borough | 173 | 42,298(0.41%)#32 | 3,471,233(0.00%)#2,694 |
| 33. | Succasunna | 171 | 42,298(0.40%)#33 | 3,471,233(0.00%)#2,720 |
| 34. | Yardville | 169 | 42,298(0.40%)#34 | 3,471,233(0.00%)#2,754 |
| 35. | Atlantic Highlands Borough | 163 | 42,298(0.39%)#35 | 3,471,233(0.00%)#2,832 |
| 36. | Red Bank Borough | 161 | 42,298(0.38%)#36 | 3,471,233(0.00%)#2,860 |
| 37. | Beach Haven West | 160 | 42,298(0.38%)#37 | 3,471,233(0.00%)#2,877 |
| 38. | Belvidere | 159 | 42,298(0.38%)#38 | 3,471,233(0.00%)#2,896 |
| 39. | Woodbury | 157 | 42,298(0.37%)#39 | 3,471,233(0.00%)#2,921 |
| 40. | Newton | 153 | 42,298(0.36%)#40 | 3,471,233(0.00%)#2,975 |
| 41. | South Amboy | 151 | 42,298(0.36%)#41 | 3,471,233(0.00%)#2,997 |
| 42. | Woodbridge | 146 | 42,298(0.35%)#42 | 3,471,233(0.00%)#3,058 |
| 43. | Moorestown Lenola | 141 | 42,298(0.33%)#43 | 3,471,233(0.00%)#3,153 |
| 44. | Cliffside Park Borough | 137 | 42,298(0.32%)#44 | 3,471,233(0.00%)#3,219 |
| 45. | New Milford Borough | 135 | 42,298(0.32%)#45 | 3,471,233(0.00%)#3,268 |
| 46. | Palermo | 133 | 42,298(0.31%)#46 | 3,471,233(0.00%)#3,321 |
| 47. | Old Bridge | 131 | 42,298(0.31%)#47 | 3,471,233(0.00%)#3,352 |
| 48. | Glassboro Borough | 131 | 42,298(0.31%)#48 | 3,471,233(0.00%)#3,353 |
| 49. | Lake Hopatcong | 131 | 42,298(0.31%)#49 | 3,471,233(0.00%)#3,357 |
| 50. | Millville | 130 | 42,298(0.31%)#50 | 3,471,233(0.00%)#3,373 |
| 51. | Monmouth Junction | 127 | 42,298(0.30%)#51 | 3,471,233(0.00%)#3,440 |
| 52. | South Plainfield Borough | 126 | 42,298(0.30%)#52 | 3,471,233(0.00%)#3,457 |
| 53. | Bellmawr Borough | 125 | 42,298(0.30%)#53 | 3,471,233(0.00%)#3,483 |
| 54. | Allendale Borough | 124 | 42,298(0.29%)#54 | 3,471,233(0.00%)#3,506 |
| 55. | New Providence Borough | 121 | 42,298(0.29%)#55 | 3,471,233(0.00%)#3,561 |
| 56. | Collingswood Borough | 120 | 42,298(0.28%)#56 | 3,471,233(0.00%)#3,585 |
| 57. | Boonton | 119 | 42,298(0.28%)#57 | 3,471,233(0.00%)#3,611 |
| 58. | North Caldwell Borough | 119 | 42,298(0.28%)#58 | 3,471,233(0.00%)#3,612 |
| 59. | Lyons | 119 | 42,298(0.28%)#59 | 3,471,233(0.00%)#3,614 |
| 60. | Somerville Borough | 118 | 42,298(0.28%)#60 | 3,471,233(0.00%)#3,634 |
| 61. | Rutherford Borough | 117 | 42,298(0.28%)#61 | 3,471,233(0.00%)#3,660 |
| 62. | Holiday City South | 117 | 42,298(0.28%)#62 | 3,471,233(0.00%)#3,667 |
| 63. | Highland Park Borough | 115 | 42,298(0.27%)#63 | 3,471,233(0.00%)#3,701 |
| 64. | Panther Valley | 115 | 42,298(0.27%)#64 | 3,471,233(0.00%)#3,704 |
| 65. | Somerset | 114 | 42,298(0.27%)#65 | 3,471,233(0.00%)#3,714 |
| 66. | Eatontown Borough | 113 | 42,298(0.27%)#66 | 3,471,233(0.00%)#3,742 |
| 67. | Beachwood Borough | 113 | 42,298(0.27%)#67 | 3,471,233(0.00%)#3,745 |
| 68. | Audubon Borough | 113 | 42,298(0.27%)#68 | 3,471,233(0.00%)#3,750 |
| 69. | Lincroft | 112 | 42,298(0.26%)#69 | 3,471,233(0.00%)#3,775 |
| 70. | Upper Montclair | 108 | 42,298(0.26%)#70 | 3,471,233(0.00%)#3,886 |
| 71. | South Toms River Borough | 108 | 42,298(0.26%)#71 | 3,471,233(0.00%)#3,899 |
| 72. | Bradley Gardens | 104 | 42,298(0.25%)#72 | 3,471,233(0.00%)#3,986 |
| 73. | New Brunswick | 103 | 42,298(0.24%)#73 | 3,471,233(0.00%)#4,004 |
| 74. | Long Branch | 103 | 42,298(0.24%)#74 | 3,471,233(0.00%)#4,006 |
| 75. | Marlton | 103 | 42,298(0.24%)#75 | 3,471,233(0.00%)#4,015 |
| 76. | Union Beach Borough | 103 | 42,298(0.24%)#76 | 3,471,233(0.00%)#4,023 |
| 77. | Newark | 102 | 42,298(0.24%)#77 | 3,471,233(0.00%)#4,034 |
| 78. | Preakness | 102 | 42,298(0.24%)#78 | 3,471,233(0.00%)#4,042 |
| 79. | Greentree | 102 | 42,298(0.24%)#79 | 3,471,233(0.00%)#4,044 |
| 80. | Martinsville | 99 | 42,298(0.23%)#80 | 3,471,233(0.00%)#4,122 |
| 81. | Little Silver Borough | 99 | 42,298(0.23%)#81 | 3,471,233(0.00%)#4,129 |
| 82. | Olivet | 99 | 42,298(0.23%)#82 | 3,471,233(0.00%)#4,137 |
| 83. | Westwood Borough | 98 | 42,298(0.23%)#83 | 3,471,233(0.00%)#4,149 |
| 84. | Bargaintown | 98 | 42,298(0.23%)#84 | 3,471,233(0.00%)#4,157 |
| 85. | Great Notch | 97 | 42,298(0.23%)#85 | 3,471,233(0.00%)#4,188 |
| 86. | Bayonne | 96 | 42,298(0.23%)#86 | 3,471,233(0.00%)#4,199 |
| 87. | Cape May | 95 | 42,298(0.22%)#87 | 3,471,233(0.00%)#4,240 |
| 88. | River Edge Borough | 90 | 42,298(0.21%)#88 | 3,471,233(0.00%)#4,363 |
| 89. | Hillsdale Borough | 90 | 42,298(0.21%)#89 | 3,471,233(0.00%)#4,366 |
| 90. | Madison Borough | 88 | 42,298(0.21%)#90 | 3,471,233(0.00%)#4,435 |
| 91. | Northfield | 88 | 42,298(0.21%)#91 | 3,471,233(0.00%)#4,441 |
| 92. | Fair Haven Borough | 88 | 42,298(0.21%)#92 | 3,471,233(0.00%)#4,446 |
| 93. | Mizpah | 88 | 42,298(0.21%)#93 | 3,471,233(0.00%)#4,464 |
| 94. | Bordentown | 87 | 42,298(0.21%)#94 | 3,471,233(0.00%)#4,491 |
| 95. | Rahway | 86 | 42,298(0.20%)#95 | 3,471,233(0.00%)#4,508 |
| 96. | Fair Lawn Borough | 85 | 42,298(0.20%)#96 | 3,471,233(0.00%)#4,543 |
| 97. | Asbury Park | 85 | 42,298(0.20%)#97 | 3,471,233(0.00%)#4,550 |
| 98. | West Long Branch Borough | 84 | 42,298(0.20%)#98 | 3,471,233(0.00%)#4,586 |
| 99. | Parsippany | 83 | 42,298(0.20%)#99 | 3,471,233(0.00%)#4,609 |
| 100. | Bernardsville Borough | 83 | 42,298(0.20%)#100 | 3,471,233(0.00%)#4,616 |
Common Questions
What are the Top 10 Cities with the Largest Swedish Community in New Jersey?
Top 10 Cities with the Largest Swedish Community in New Jersey are:
#1
650
#2
634
#3
596
#4
441
#5
416
#6
315
#7
310
#8
274
#9
259
#10
259
What city has the Largest Swedish Community in New Jersey?
White Meadow Lake has the Largest Swedish Community in New Jersey with 650.
What is the Total Swedish Population in the State of New Jersey?
Total Swedish Population in New Jersey is 42,298.
What is the Total Swedish Population in the United States?
Total Swedish Population in the United States is 3,471,233.