Cities with the Largest Italian Community in New Jersey
RELATED REPORTS & OPTIONS
Italian
New Jersey
Compare Cities
Map of Cities with the Largest Italian Community in New Jersey
0
25,000
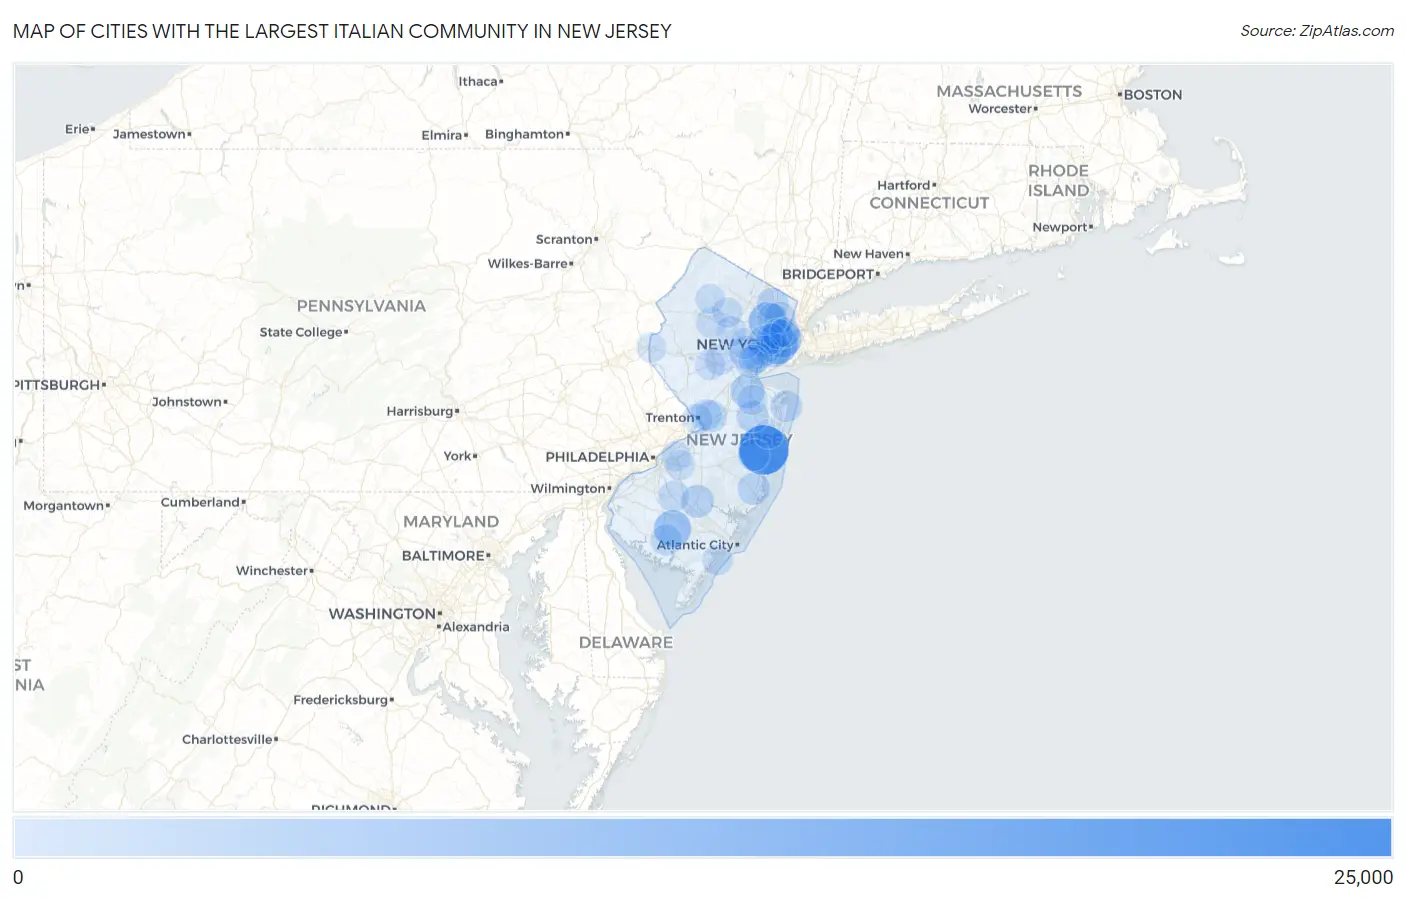
Cities with the Largest Italian Community in New Jersey
| City | Italian | vs State | vs National | |
| 1. | Toms River | 24,573 | 1,321,850(1.86%)#1 | 16,316,728(0.15%)#24 |
| 2. | Jersey City | 14,072 | 1,321,850(1.06%)#2 | 16,316,728(0.09%)#63 |
| 3. | Hoboken | 10,945 | 1,321,850(0.83%)#3 | 16,316,728(0.07%)#95 |
| 4. | Clifton | 10,621 | 1,321,850(0.80%)#4 | 16,316,728(0.07%)#101 |
| 5. | Vineland | 10,052 | 1,321,850(0.76%)#5 | 16,316,728(0.06%)#110 |
| 6. | Sicklerville | 7,534 | 1,321,850(0.57%)#6 | 16,316,728(0.05%)#203 |
| 7. | Bayonne | 7,387 | 1,321,850(0.56%)#7 | 16,316,728(0.05%)#208 |
| 8. | Old Bridge | 6,578 | 1,321,850(0.50%)#8 | 16,316,728(0.04%)#240 |
| 9. | Sayreville Borough | 5,636 | 1,321,850(0.43%)#9 | 16,316,728(0.03%)#311 |
| 10. | Westfield | 5,380 | 1,321,850(0.41%)#10 | 16,316,728(0.03%)#339 |
| 11. | Hawthorne Borough | 5,268 | 1,321,850(0.40%)#11 | 16,316,728(0.03%)#350 |
| 12. | Hammonton | 5,198 | 1,321,850(0.39%)#12 | 16,316,728(0.03%)#357 |
| 13. | Point Pleasant Borough | 4,961 | 1,321,850(0.38%)#13 | 16,316,728(0.03%)#384 |
| 14. | Newark | 4,820 | 1,321,850(0.36%)#14 | 16,316,728(0.03%)#407 |
| 15. | Ocean Acres | 4,679 | 1,321,850(0.35%)#15 | 16,316,728(0.03%)#423 |
| 16. | Fair Lawn Borough | 4,640 | 1,321,850(0.35%)#16 | 16,316,728(0.03%)#430 |
| 17. | Paramus Borough | 4,601 | 1,321,850(0.35%)#17 | 16,316,728(0.03%)#432 |
| 18. | South Plainfield Borough | 4,590 | 1,321,850(0.35%)#18 | 16,316,728(0.03%)#435 |
| 19. | West Freehold | 4,584 | 1,321,850(0.35%)#19 | 16,316,728(0.03%)#438 |
| 20. | Glassboro Borough | 4,581 | 1,321,850(0.35%)#20 | 16,316,728(0.03%)#439 |
| 21. | Preakness | 4,342 | 1,321,850(0.33%)#21 | 16,316,728(0.03%)#480 |
| 22. | Ridgewood | 4,238 | 1,321,850(0.32%)#22 | 16,316,728(0.03%)#492 |
| 23. | Long Branch | 4,128 | 1,321,850(0.31%)#23 | 16,316,728(0.03%)#513 |
| 24. | Holiday City Berkeley | 4,103 | 1,321,850(0.31%)#24 | 16,316,728(0.03%)#518 |
| 25. | Hamilton Square | 4,014 | 1,321,850(0.30%)#25 | 16,316,728(0.02%)#530 |
| 26. | Tinton Falls Borough | 3,828 | 1,321,850(0.29%)#26 | 16,316,728(0.02%)#555 |
| 27. | Millville | 3,815 | 1,321,850(0.29%)#27 | 16,316,728(0.02%)#556 |
| 28. | Madison Borough | 3,740 | 1,321,850(0.28%)#28 | 16,316,728(0.02%)#569 |
| 29. | Hillsborough | 3,719 | 1,321,850(0.28%)#29 | 16,316,728(0.02%)#576 |
| 30. | Mercerville | 3,706 | 1,321,850(0.28%)#30 | 16,316,728(0.02%)#580 |
| 31. | Hackensack | 3,690 | 1,321,850(0.28%)#31 | 16,316,728(0.02%)#583 |
| 32. | Ramsey Borough | 3,672 | 1,321,850(0.28%)#32 | 16,316,728(0.02%)#586 |
| 33. | Hopatcong Borough | 3,572 | 1,321,850(0.27%)#33 | 16,316,728(0.02%)#610 |
| 34. | Elizabeth | 3,457 | 1,321,850(0.26%)#34 | 16,316,728(0.02%)#638 |
| 35. | Rutherford Borough | 3,443 | 1,321,850(0.26%)#35 | 16,316,728(0.02%)#639 |
| 36. | Williamstown | 3,393 | 1,321,850(0.26%)#36 | 16,316,728(0.02%)#651 |
| 37. | Lodi Borough | 3,329 | 1,321,850(0.25%)#37 | 16,316,728(0.02%)#667 |
| 38. | Oak Ridge | 3,235 | 1,321,850(0.24%)#38 | 16,316,728(0.02%)#685 |
| 39. | Westmont | 3,200 | 1,321,850(0.24%)#39 | 16,316,728(0.02%)#692 |
| 40. | Colonia | 3,196 | 1,321,850(0.24%)#40 | 16,316,728(0.02%)#694 |
| 41. | Parsippany | 3,170 | 1,321,850(0.24%)#41 | 16,316,728(0.02%)#702 |
| 42. | Pompton Plains | 3,071 | 1,321,850(0.23%)#42 | 16,316,728(0.02%)#729 |
| 43. | Florham Park Borough | 3,044 | 1,321,850(0.23%)#43 | 16,316,728(0.02%)#738 |
| 44. | Dumont Borough | 3,012 | 1,321,850(0.23%)#44 | 16,316,728(0.02%)#745 |
| 45. | Linden | 3,005 | 1,321,850(0.23%)#45 | 16,316,728(0.02%)#748 |
| 46. | Haddonfield Borough | 3,005 | 1,321,850(0.23%)#46 | 16,316,728(0.02%)#749 |
| 47. | Oakland Borough | 3,000 | 1,321,850(0.23%)#47 | 16,316,728(0.02%)#752 |
| 48. | Hasbrouck Heights Borough | 2,998 | 1,321,850(0.23%)#48 | 16,316,728(0.02%)#755 |
| 49. | Hillsdale Borough | 2,961 | 1,321,850(0.22%)#49 | 16,316,728(0.02%)#769 |
| 50. | Middlesex Borough | 2,957 | 1,321,850(0.22%)#50 | 16,316,728(0.02%)#771 |
| 51. | Garfield | 2,954 | 1,321,850(0.22%)#51 | 16,316,728(0.02%)#772 |
| 52. | Totowa Borough | 2,909 | 1,321,850(0.22%)#52 | 16,316,728(0.02%)#791 |
| 53. | Elmwood Park Borough | 2,906 | 1,321,850(0.22%)#53 | 16,316,728(0.02%)#793 |
| 54. | Summit | 2,893 | 1,321,850(0.22%)#54 | 16,316,728(0.02%)#796 |
| 55. | Wanaque Borough | 2,878 | 1,321,850(0.22%)#55 | 16,316,728(0.02%)#804 |
| 56. | Kinnelon Borough | 2,865 | 1,321,850(0.22%)#56 | 16,316,728(0.02%)#806 |
| 57. | Pompton Lakes Borough | 2,839 | 1,321,850(0.21%)#57 | 16,316,728(0.02%)#813 |
| 58. | Fort Lee Borough | 2,788 | 1,321,850(0.21%)#58 | 16,316,728(0.02%)#833 |
| 59. | Martinsville | 2,751 | 1,321,850(0.21%)#59 | 16,316,728(0.02%)#850 |
| 60. | Park Ridge Borough | 2,745 | 1,321,850(0.21%)#60 | 16,316,728(0.02%)#856 |
| 61. | Secaucus | 2,726 | 1,321,850(0.21%)#61 | 16,316,728(0.02%)#867 |
| 62. | Ocean City | 2,711 | 1,321,850(0.21%)#62 | 16,316,728(0.02%)#874 |
| 63. | Succasunna | 2,708 | 1,321,850(0.20%)#63 | 16,316,728(0.02%)#875 |
| 64. | Kearny | 2,700 | 1,321,850(0.20%)#64 | 16,316,728(0.02%)#878 |
| 65. | Beachwood Borough | 2,693 | 1,321,850(0.20%)#65 | 16,316,728(0.02%)#882 |
| 66. | Robertsville | 2,681 | 1,321,850(0.20%)#66 | 16,316,728(0.02%)#889 |
| 67. | Emerson Borough | 2,627 | 1,321,850(0.20%)#67 | 16,316,728(0.02%)#910 |
| 68. | Flanders | 2,617 | 1,321,850(0.20%)#68 | 16,316,728(0.02%)#913 |
| 69. | Wood Ridge Borough | 2,603 | 1,321,850(0.20%)#69 | 16,316,728(0.02%)#915 |
| 70. | Bellmawr Borough | 2,591 | 1,321,850(0.20%)#70 | 16,316,728(0.02%)#920 |
| 71. | New Milford Borough | 2,585 | 1,321,850(0.20%)#71 | 16,316,728(0.02%)#921 |
| 72. | Morristown | 2,579 | 1,321,850(0.20%)#72 | 16,316,728(0.02%)#924 |
| 73. | Bradley Gardens | 2,563 | 1,321,850(0.19%)#73 | 16,316,728(0.02%)#933 |
| 74. | New Providence Borough | 2,541 | 1,321,850(0.19%)#74 | 16,316,728(0.02%)#944 |
| 75. | Woodland Park Borough | 2,540 | 1,321,850(0.19%)#75 | 16,316,728(0.02%)#946 |
| 76. | Waldwick Borough | 2,526 | 1,321,850(0.19%)#76 | 16,316,728(0.02%)#952 |
| 77. | Westwood Borough | 2,521 | 1,321,850(0.19%)#77 | 16,316,728(0.02%)#954 |
| 78. | Moorestown Lenola | 2,491 | 1,321,850(0.19%)#78 | 16,316,728(0.02%)#972 |
| 79. | Rahway | 2,484 | 1,321,850(0.19%)#79 | 16,316,728(0.02%)#974 |
| 80. | Eatontown Borough | 2,474 | 1,321,850(0.19%)#80 | 16,316,728(0.02%)#978 |
| 81. | Whippany | 2,452 | 1,321,850(0.19%)#81 | 16,316,728(0.02%)#985 |
| 82. | Trenton | 2,441 | 1,321,850(0.18%)#82 | 16,316,728(0.01%)#986 |
| 83. | West Long Branch Borough | 2,439 | 1,321,850(0.18%)#83 | 16,316,728(0.01%)#989 |
| 84. | White Meadow Lake | 2,408 | 1,321,850(0.18%)#84 | 16,316,728(0.01%)#1,000 |
| 85. | Lake Hiawatha | 2,407 | 1,321,850(0.18%)#85 | 16,316,728(0.01%)#1,003 |
| 86. | Metuchen Borough | 2,405 | 1,321,850(0.18%)#86 | 16,316,728(0.01%)#1,004 |
| 87. | Collingswood Borough | 2,391 | 1,321,850(0.18%)#87 | 16,316,728(0.01%)#1,010 |
| 88. | North Arlington Borough | 2,389 | 1,321,850(0.18%)#88 | 16,316,728(0.01%)#1,011 |
| 89. | Cliffside Park Borough | 2,383 | 1,321,850(0.18%)#89 | 16,316,728(0.01%)#1,015 |
| 90. | Roselle Park Borough | 2,368 | 1,321,850(0.18%)#90 | 16,316,728(0.01%)#1,022 |
| 91. | West New York | 2,363 | 1,321,850(0.18%)#91 | 16,316,728(0.01%)#1,026 |
| 92. | River Edge Borough | 2,362 | 1,321,850(0.18%)#92 | 16,316,728(0.01%)#1,027 |
| 93. | North Haledon Borough | 2,362 | 1,321,850(0.18%)#93 | 16,316,728(0.01%)#1,028 |
| 94. | Phillipsburg | 2,334 | 1,321,850(0.18%)#94 | 16,316,728(0.01%)#1,044 |
| 95. | Franklin Lakes Borough | 2,332 | 1,321,850(0.18%)#95 | 16,316,728(0.01%)#1,048 |
| 96. | Marlton | 2,276 | 1,321,850(0.17%)#96 | 16,316,728(0.01%)#1,072 |
| 97. | Lake Mohawk | 2,258 | 1,321,850(0.17%)#97 | 16,316,728(0.01%)#1,082 |
| 98. | Ramtown | 2,214 | 1,321,850(0.17%)#98 | 16,316,728(0.01%)#1,104 |
| 99. | Ringwood Borough | 2,175 | 1,321,850(0.16%)#99 | 16,316,728(0.01%)#1,126 |
| 100. | Caldwell Borough | 2,150 | 1,321,850(0.16%)#100 | 16,316,728(0.01%)#1,141 |
Common Questions
What are the Top 10 Cities with the Largest Italian Community in New Jersey?
Top 10 Cities with the Largest Italian Community in New Jersey are:
#1
24,573
#2
14,072
#3
10,945
#4
10,621
#5
10,052
#6
7,387
#7
6,578
#8
5,380
#9
5,198
#10
4,820
What city has the Largest Italian Community in New Jersey?
Toms River has the Largest Italian Community in New Jersey with 24,573.
What is the Total Italian Population in the State of New Jersey?
Total Italian Population in New Jersey is 1,321,850.
What is the Total Italian Population in the United States?
Total Italian Population in the United States is 16,316,728.