Cities with the Most Immigrants from Ethiopia in New Jersey
RELATED REPORTS & OPTIONS
Ethiopia
New Jersey
Compare Cities
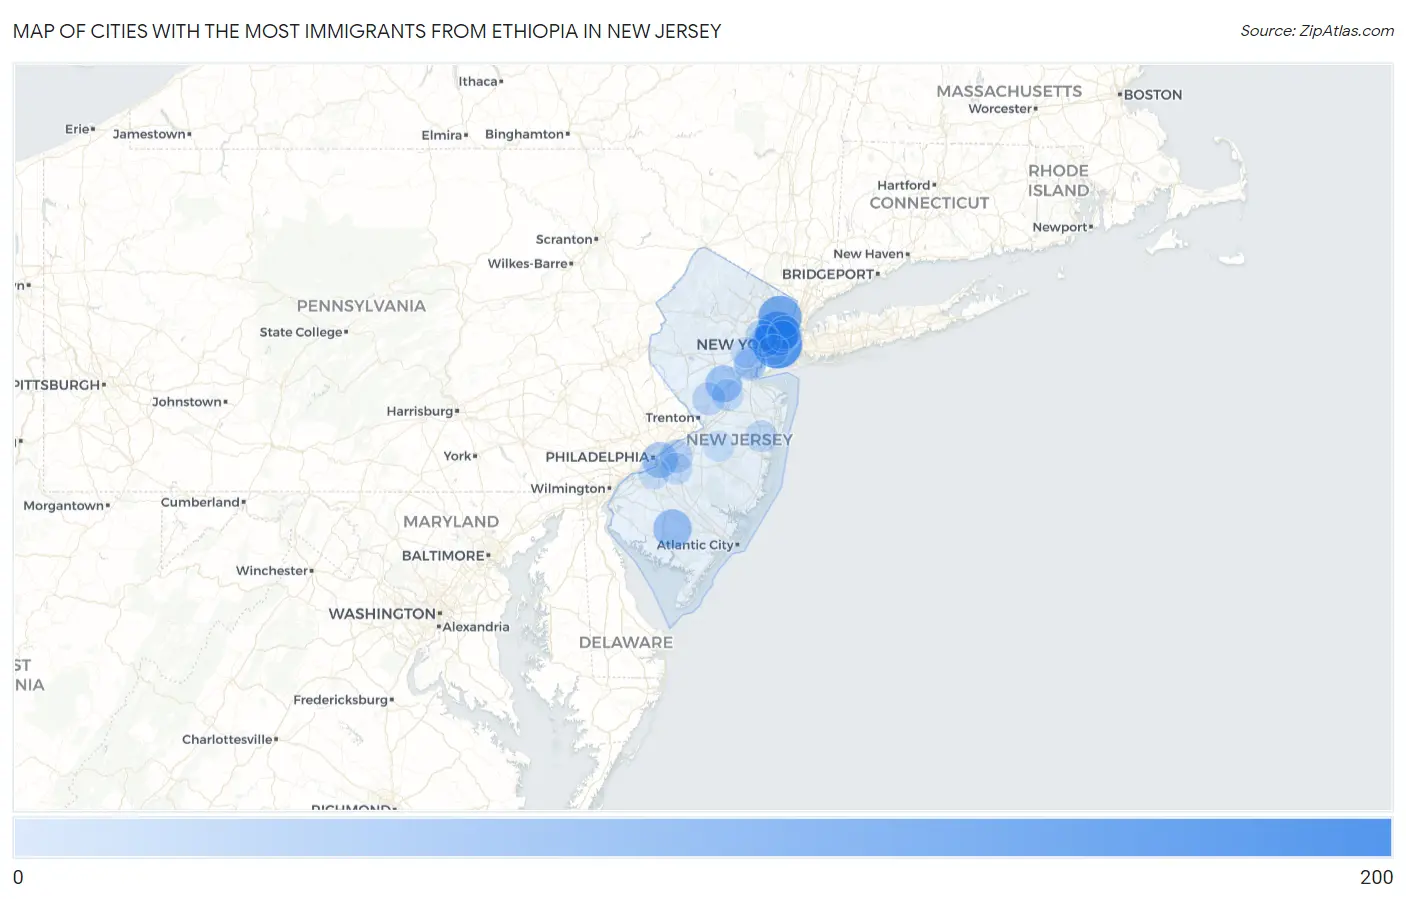
Map of Cities with the Most Immigrants from Ethiopia in New Jersey
0
200
Cities with the Most Immigrants from Ethiopia in New Jersey
| City | Ethiopia | vs State | vs National | |
| 1. | Collingswood Borough | 157 | 2,083(7.54%)#1 | 275,476(0.06%)#261 |
| 2. | Jersey City | 151 | 2,083(7.25%)#2 | 275,476(0.05%)#269 |
| 3. | Edgewater Borough | 151 | 2,083(7.25%)#3 | 275,476(0.05%)#272 |
| 4. | Secaucus | 110 | 2,083(5.28%)#4 | 275,476(0.04%)#355 |
| 5. | Hackensack | 104 | 2,083(4.99%)#5 | 275,476(0.04%)#372 |
| 6. | Vineland | 64 | 2,083(3.07%)#6 | 275,476(0.02%)#504 |
| 7. | Franklin Park | 52 | 2,083(2.50%)#7 | 275,476(0.02%)#579 |
| 8. | Camden | 44 | 2,083(2.11%)#8 | 275,476(0.02%)#639 |
| 9. | Ridgefield Borough | 35 | 2,083(1.68%)#9 | 275,476(0.01%)#734 |
| 10. | West New York | 25 | 2,083(1.20%)#10 | 275,476(0.01%)#863 |
| 11. | Dunellen Borough | 24 | 2,083(1.15%)#11 | 275,476(0.01%)#884 |
| 12. | Moorestown Lenola | 23 | 2,083(1.10%)#12 | 275,476(0.01%)#899 |
| 13. | Princeton | 22 | 2,083(1.06%)#13 | 275,476(0.01%)#916 |
| 14. | New Milford Borough | 21 | 2,083(1.01%)#14 | 275,476(0.01%)#936 |
| 15. | Colonia | 18 | 2,083(0.86%)#15 | 275,476(0.01%)#988 |
| 16. | East Orange | 17 | 2,083(0.82%)#16 | 275,476(0.01%)#1,002 |
| 17. | Newark | 16 | 2,083(0.77%)#17 | 275,476(0.01%)#1,018 |
| 18. | Lakewood | 14 | 2,083(0.67%)#18 | 275,476(0.01%)#1,067 |
| 19. | Parsippany | 14 | 2,083(0.67%)#19 | 275,476(0.01%)#1,073 |
| 20. | Springdale | 14 | 2,083(0.67%)#20 | 275,476(0.01%)#1,076 |
| 21. | Dayton | 14 | 2,083(0.67%)#21 | 275,476(0.01%)#1,085 |
| 22. | Bellmawr Borough | 13 | 2,083(0.62%)#22 | 275,476(0.00%)#1,109 |
| 23. | Iselin | 12 | 2,083(0.58%)#23 | 275,476(0.00%)#1,136 |
| 24. | Carteret Borough | 11 | 2,083(0.53%)#24 | 275,476(0.00%)#1,169 |
| 25. | Woodbury | 9 | 2,083(0.43%)#25 | 275,476(0.00%)#1,239 |
| 26. | Union City | 7 | 2,083(0.34%)#26 | 275,476(0.00%)#1,289 |
| 27. | Westfield | 7 | 2,083(0.34%)#27 | 275,476(0.00%)#1,298 |
| 28. | South Plainfield Borough | 7 | 2,083(0.34%)#28 | 275,476(0.00%)#1,302 |
| 29. | Mcguire Afb | 7 | 2,083(0.34%)#29 | 275,476(0.00%)#1,312 |
| 30. | Woodlynne Borough | 7 | 2,083(0.34%)#30 | 275,476(0.00%)#1,313 |
| 31. | Haddonfield Borough | 5 | 2,083(0.24%)#31 | 275,476(0.00%)#1,369 |
| 32. | Lawnside Borough | 5 | 2,083(0.24%)#32 | 275,476(0.00%)#1,377 |
| 33. | Bayonne | 2 | 2,083(0.10%)#33 | 275,476(0.00%)#1,441 |
Common Questions
What are the Top 10 Cities with the Most Immigrants from Ethiopia in New Jersey?
Top 10 Cities with the Most Immigrants from Ethiopia in New Jersey are:
#1
151
#2
110
#3
104
#4
64
#5
52
#6
44
#7
25
#8
23
#9
22
#10
18
What city has the Most Immigrants from Ethiopia in New Jersey?
Jersey City has the Most Immigrants from Ethiopia in New Jersey with 151.
What is the Total Immigrants from Ethiopia in the State of New Jersey?
Total Immigrants from Ethiopia in New Jersey is 2,083.
What is the Total Immigrants from Ethiopia in the United States?
Total Immigrants from Ethiopia in the United States is 275,476.